
What Is an Inversion FVG and BPR? Why a Broken Gap Flips Its Role
Historical examples for learning · not current prices or trade recommendations.
Contents
In the fair value gap (FVG) series, I noted that an FVG that gets fully filled and then closes beyond the far side with a candle body can become an inversion FVG with its role reversed, and that it would get its own topic. This topic is that story. This lesson uses concept illustrations and a real Bitcoin (BTC) chart to explain why a broken FVG takes on the opposite role, and what a balanced price range (BPR) — two opposite-direction FVGs that overlap — actually is.
1. The One-Line Definition: An FVG Broken by a Close Works in Reverse
An inversion fair value gap (IFVG) is an FVG that a candle body has closed beyond, past its far edge. Some traders also call it an "Inverse FVG." A bullish FVG inverts the moment a candle closes below the FVG's bottom; a bearish FVG inverts the moment a candle closes above its top.
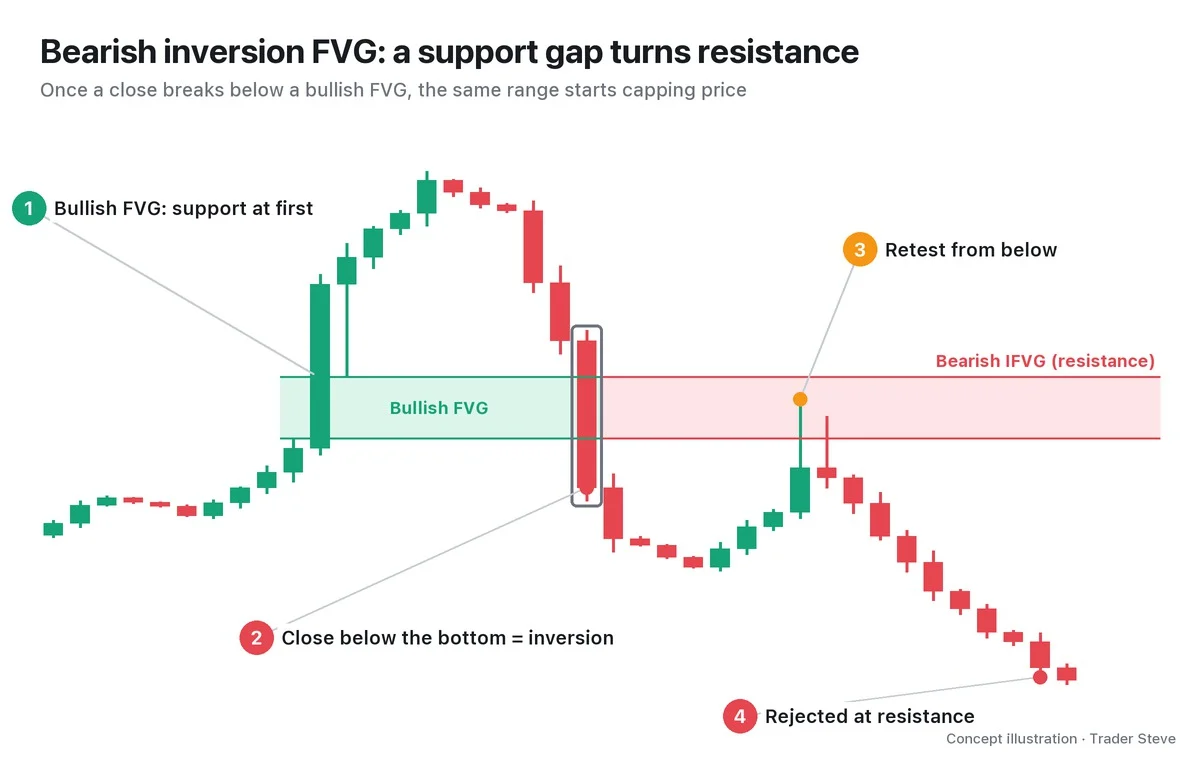
The yardstick is the close. If a wick pokes through the far side of the FVG but the body closes back inside, the FVG has only been "fully filled" — it has not inverted. Part 2 covers the rules that separate a wick from a close in detail. If FVGs themselves are new to you, start with ICT FVG Part 1 (related lesson); it will make this much easier to follow.
2. Why It Flips: Trapped Traders' Breakeven and the Breakers' New Orders
Take a bullish FVG. When price pulls back into the gap, some traders buy inside it, thinking "this should hold." But if a candle then closes below the gap, those buyers are trapped in a losing position.
- Trapped buyers' breakeven size: when price climbs back up to that gap, sell orders appear from traders thinking "let me at least get out at breakeven." The range that used to be support now becomes a place where sell orders are waiting.
- The breakers' new orders: the sellers who broke the gap on a closing basis want to add size if price pulls back into that same range.
Because both sets of orders gather in the same range, a broken gap often takes on the opposite role. It is the same principle as the support/resistance flip (S/R flip; see Basics Support and Resistance, basics/support-resistance) — a broken support line turns into resistance — and an IFVG simply applies it to the "empty price range" of an FVG.
On a stock chart, drawing the line left by a gap, I explained this flip like this:
"This line is the biggest one. It's where price kept finding support, and when it broke, it turned into resistance. There's a good chance price gets pushed back up to this level to test it." — Trader Steve, live stream, Aug 31, 2026 (translated from Korean) · ▶ Watch the stream highlights (Korean audio)
"Coming back to test it" is the key phrase. A broken gap is a place that may get revisited and tested, and what you watch is whether it plays the opposite role during that test.
3. Bullish and Bearish Inversion FVGs
Inversion FVGs also come in two directions. The name follows the role the zone plays after inversion.
| Type | Original FVG | Inversion condition | Role after inversion | Invalidation |
|---|---|---|---|---|
| Bearish inversion FVG (bearish IFVG) | bullish FVG | a close below the FVG's bottom | resistance | a close back above the top |
| Bullish inversion FVG (bullish IFVG) | bearish FVG | a close above the FVG's top | support | a close back below the bottom |
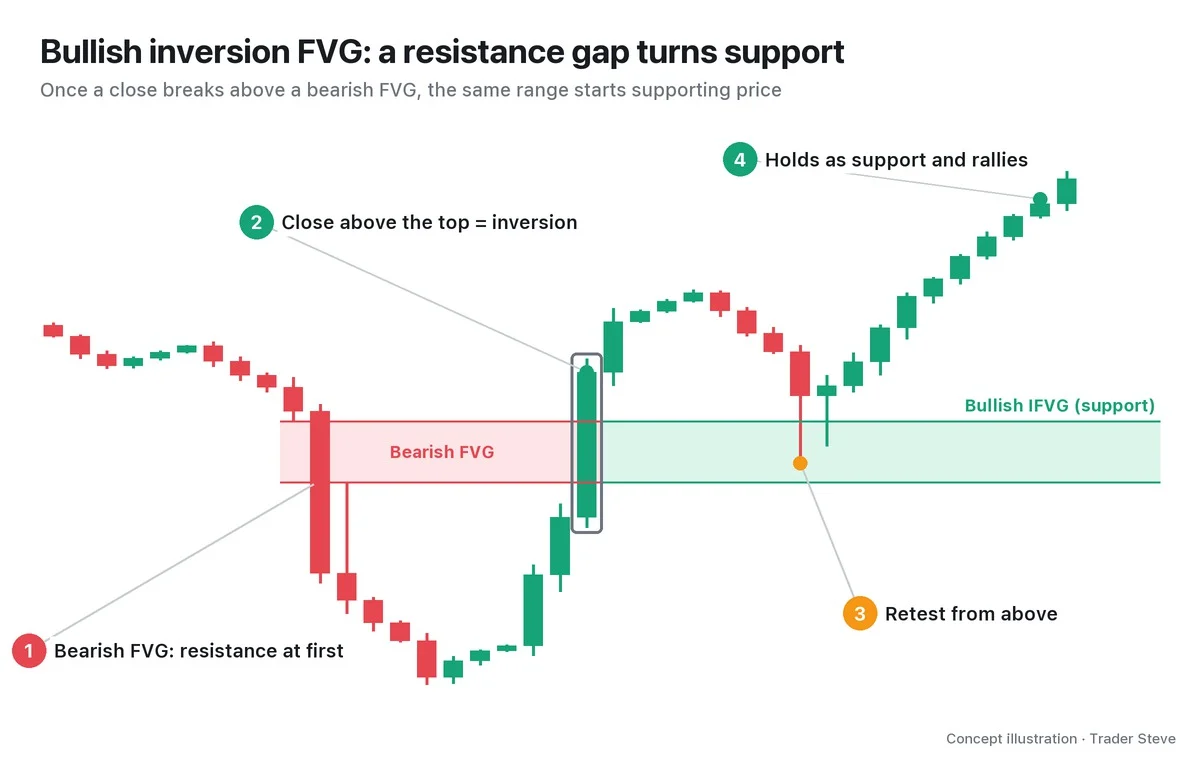
The zone is simply the original FVG box. Keep the consequent encroachment (CE) — the exact midpoint (50%) of the FVG — marked as well. If price closes back through the inversion FVG in the opposite direction (invalidation), treat the zone as neither support nor resistance any longer and delete it.
4. BPR: Where Two Opposite FVGs Overlap
A BPR is the price range where two opposite-direction FVGs, formed a short time apart, overlap. If price drops sharply and leaves a bearish FVG, then immediately rallies sharply and leaves a bullish FVG, only the part where the two boxes overlap is the BPR. Remember that it is the intersection of the two boxes, not the wider range that covers both.
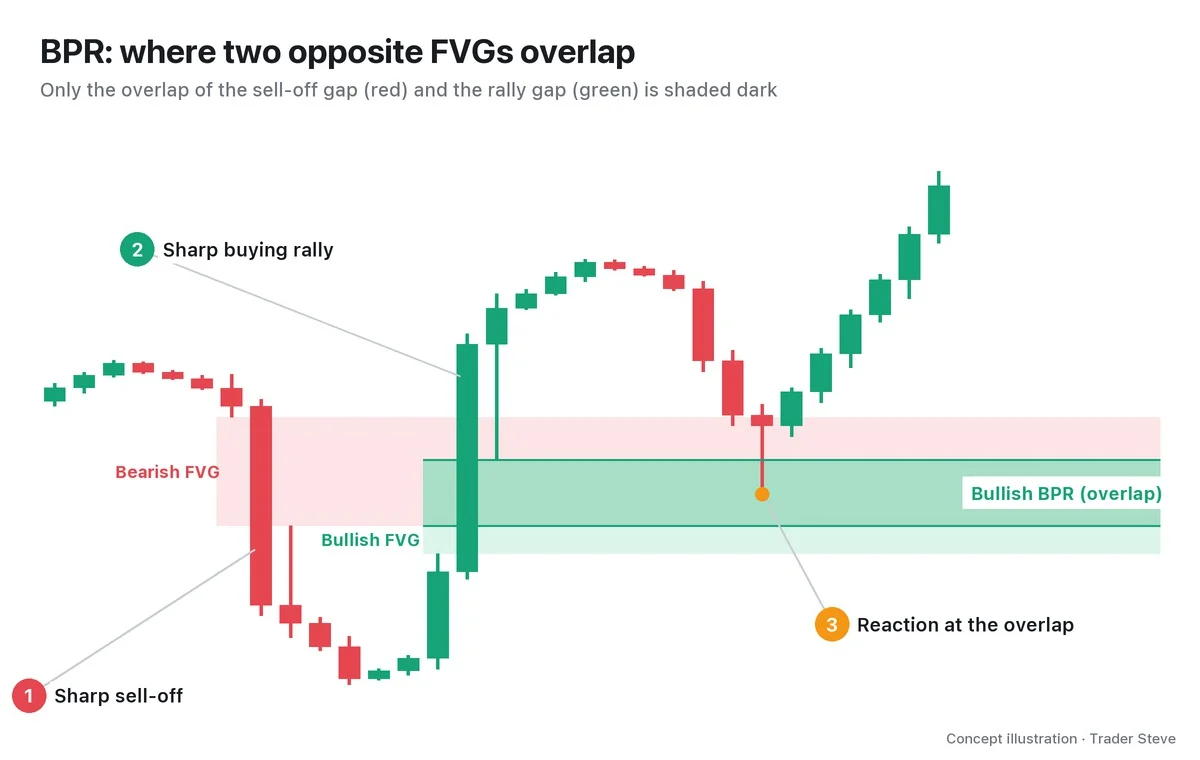
As in the illustration, if the bearish FVG comes first and the bullish FVG second, it is a bullish BPR (read as support); in the reverse order, it is a bearish BPR (read as resistance).
A BPR gets more attention than a single FVG because price passed through the same range sharply once in each direction. It is the intersection of two FVGs left by sharp moves in opposite directions; it does not mean no real trading happened in either direction.
"Say I'm one of the big players. I wanted to sell a lot here. So I just dumped it straight down. But nobody's buying from me. That's how price got pushed down like this. … Once it gets around here, people start buying like crazy." — Trader Steve, live stream, Sep 21, 2026 (translated from Korean) · ▶ Watch the stream highlights (Korean audio)
That was me explaining a spot where gaps overlapped on the Bitcoin weekly chart (Part 4 revisits that chart). For reference, on the live stream I don't use the word "BPR"; I call it "the spot where a fair value gap and an inverse fair value gap overlap." The earlier gap gets flipped by a large candle in the opposite direction, and the new FVG that large candle leaves sits on top of it, so in practice both names point to the same place.
Still, neither an IFVG nor a BPR is a signal — each is a place to watch for a reaction. An overlap does not guarantee that price will hold there (failure cases and statistics are in Parts 4 and 5).
5. A Real Bitcoin Chart: A Broken Bearish FVG Turns Into Support
This is a textbook bullish inversion FVG on the BTC 4-hour chart in September 2026. All times are Korea Standard Time (KST, UTC+9).
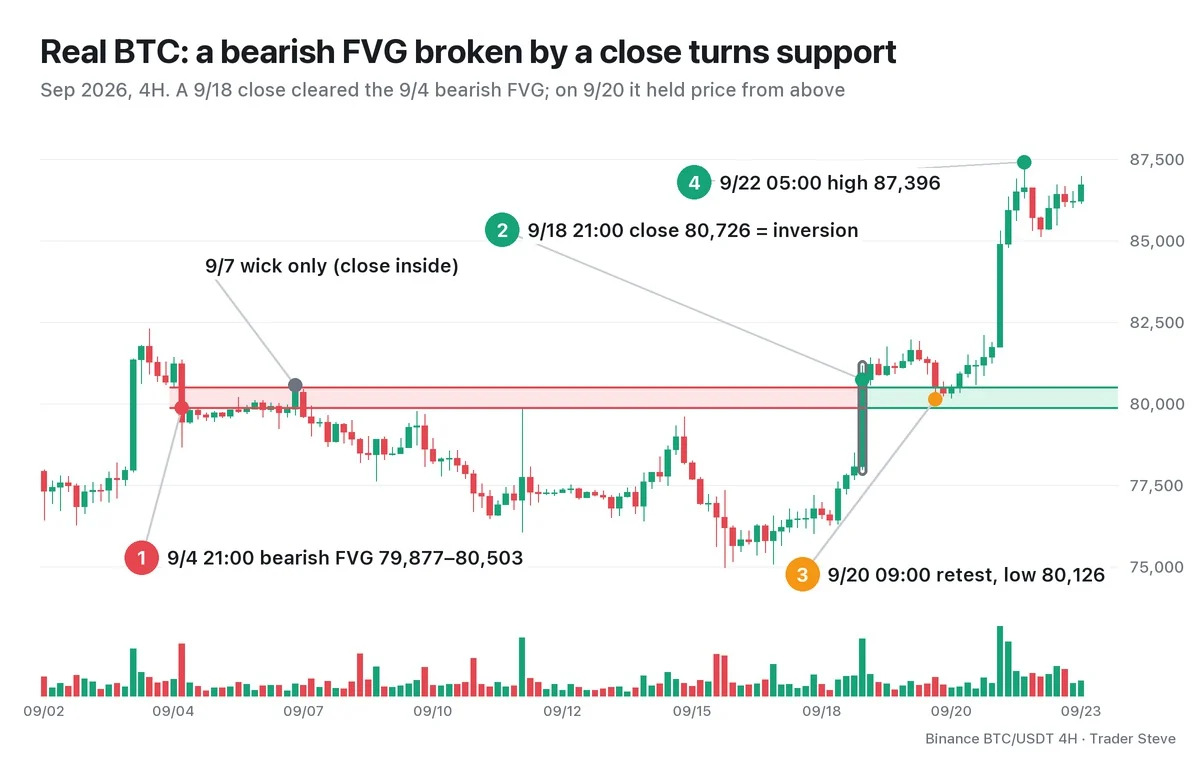
- The Sep 4, 21:00 candle left a bearish FVG at 79,877–80,503 (CE 80,190).
- The Sep 7, 05:00 candle's wick reached 80,560, above the top, but it closed at 80,342, inside the gap. That is not an inversion.
- The Sep 18, 21:00 candle (a +3.4% large bullish candle) closed at 80,726, above the top. On this candle, the bearish FVG turned into a bullish inversion FVG.
- Nine candles (36 hours) later, the Sep 20, 09:00 candle came down from above and reached a low of 80,126. It dug below the CE but stopped above the bottom at 79,877, and closed at 80,486, above the CE.
- A sharp rally began with the Sep 21, 17:00 candle and carried price to a high of 87,396 on the Sep 22, 05:00 candle — about 9.1% above the retest low.
There is one more thing to notice. The large bullish candle that caused the inversion on 9/18 also left a new bullish FVG (78,491–80,556) at the same spot. A new gap sits on top of the flipped gap — the shape I call "the spot where a fair value gap and an inverse fair value gap overlap." The 9/20 retest happened right in that overlapping range.
Of course, this is one example that worked out well. It is common for the same kind of IFVG to break straight through on the retest, and when that happens, the rule is to confirm the close through it in the opposite direction (invalidation) and step away.
Key Takeaways
- An inversion FVG (IFVG) is an FVG that a candle body has closed beyond, past its far edge. A wick that only crosses it is not an inversion.
- An inverted bullish FVG is read as resistance, and an inverted bearish FVG as support. That's because trapped traders' breakeven size and the breakers' new orders gather in the same range.
- A BPR is only the overlap of two opposite-direction FVGs formed a short time apart. It earns attention because sharp moves in opposite directions overlap there.
- An IFVG is invalidated when price closes back through it in the opposite direction. Both are only places to watch for a reaction, not confirmed signals.
In Part 2, we'll cover how to find and draw IFVGs and BPRs precisely on a chart, the rule that separates a wick through a gap from a close through it, and the invalidation line.
If finding broken and overlapping gaps by hand every day across many markets and timeframes is too much, take a look at the Omnisight Report below.
This lesson adapts the text, figures and live-stream quotes of the Trader Steve TA series for the web, translated from the original Korean. Check the text and figure captions for the timing and interpretation of each real example, and read conceptual diagrams and real charts separately.
Corrections: support@omnisight.report


