
What Is a Liquidity Sweep? How Stop Hunts Happen and Why
Historical examples for learning · not current prices or trade recommendations.
Contents
On almost any chart you'll find long wicks that poke just past a high or a low and snap right back. Stops get triggered, and price is back where it started a moment later. In ICT, this move is called a liquidity sweep. This lesson uses charts to show what a liquidity sweep is, why it happens exactly where stop-losses are clustered (a stop hunt), and what it looked like on a real Bitcoin (BTC) daily chart.
1. The One-Line Definition: A Wick That Crosses and Comes Back
A liquidity sweep is a move in which price briefly pushes past an obvious high or low, fills the orders resting beyond it, and then that candle closes back inside. The same thing is also called a liquidity grab or a raid.
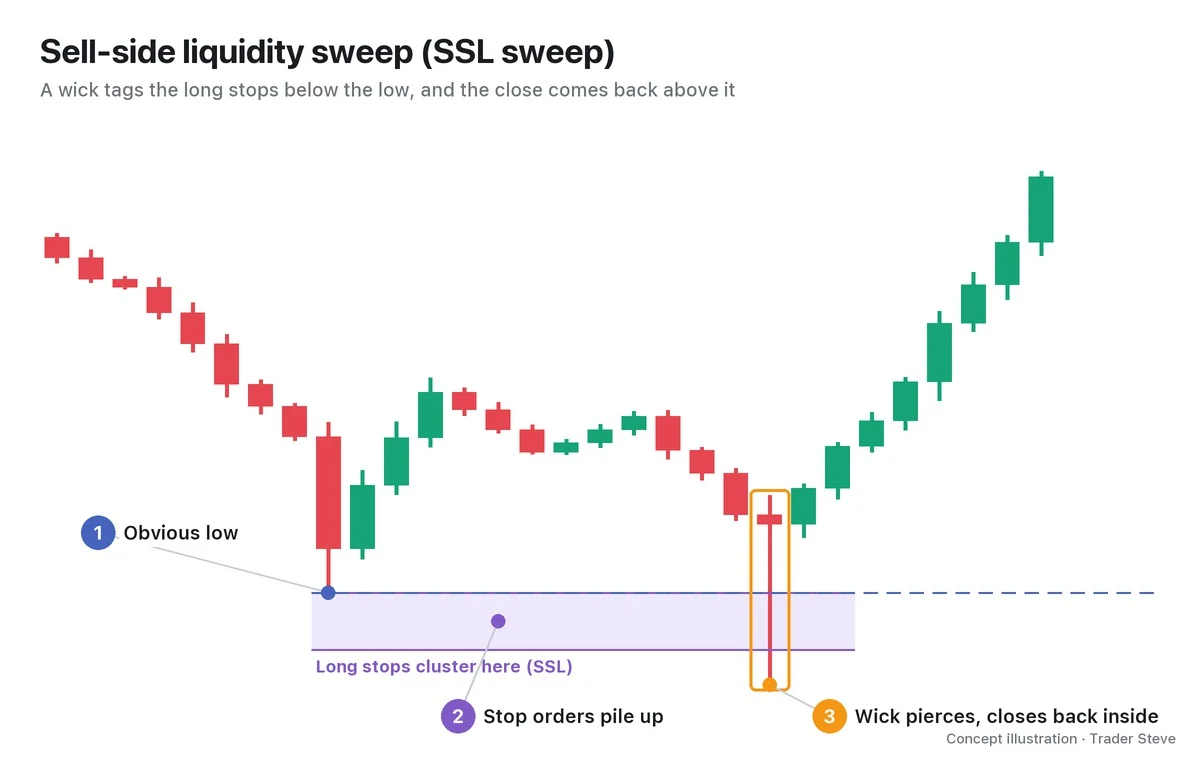
The shape is simple: the wick goes beyond the reference line, but the close stays inside. If price instead crosses the same level, closes outside it as well, and keeps going in that direction, it's a breakout — in ICT terms, a liquidity run. The criteria that separate the two, such as which timeframe's close to use and how far price has to cross, are covered in detail in Part 2.
Keep one thing in mind from the start: a sweep is confirmed only after the candle closes. While the wick is still extending, nobody knows whether it will end as a sweep or turn into a breakout.
2. Where Stop Orders Cluster: BSL Above Highs, SSL Below Lows
What a sweep hits is a price zone where orders are concentrated — in other words, liquidity.
| Type | Location | Orders resting there |
|---|---|---|
| Buy-side liquidity (BSL) | above highs | short stop-losses (market buys) + breakout buys |
| Sell-side liquidity (SSL) | below lows | long stop-losses (market sells) + breakout sells |
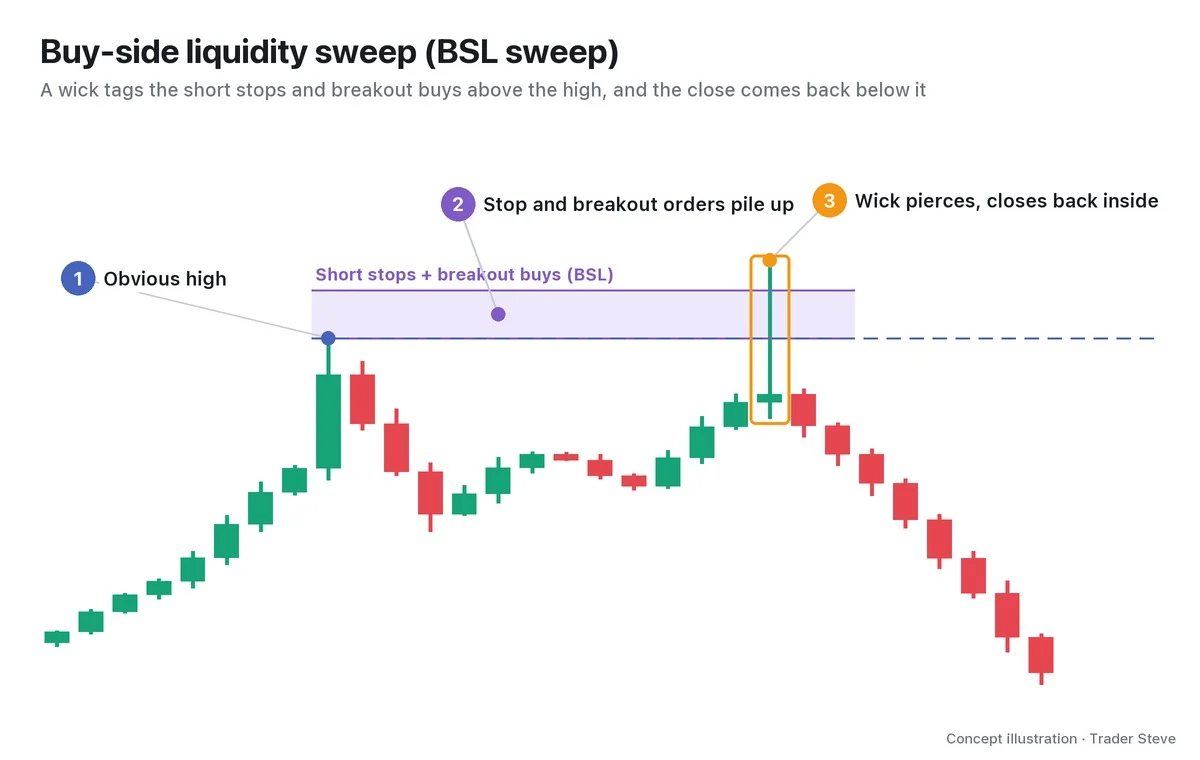
Many traders are taught that "if the low breaks, you're wrong," so long stops cluster just below lows and short stops just above highs. Equal highs and lows (EQH/EQL) — highs or lows lined up at almost the same level — are the classic places where these orders stack up layer on layer. Where and how liquidity builds up is covered separately in the ICT topic Liquidity (BSL and SSL), ict/liquidity.
3. Why Price Stabs There: Big Orders Need Size on the Other Side
That raises a question. Why does price go out of its way to tag the spot where stops are clustered, and then come back?
For big money to buy a lot, someone has to sell that much to it. On a normal order book, there isn't enough sell-side size to absorb a large buy in one go. But below the low sit the long stop-loss orders, and a long stop becomes a market sell the moment it triggers (this assumes stop-market orders; a stop-loss placed as a limit order may not get filled). When price drops below the low, those sells pour out all at once, and the big buyer can fill its whole order against them.
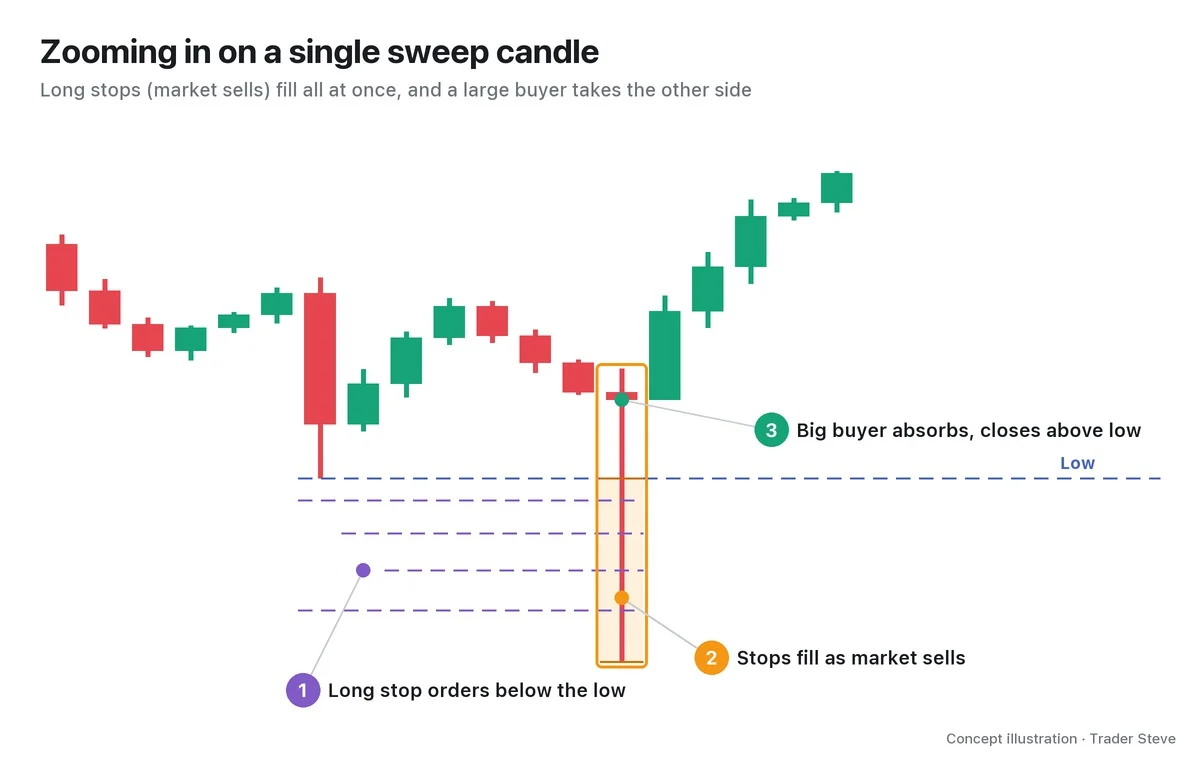
This act of tagging a price zone where stops are clustered and getting those orders filled is called a stop hunt, or a stop run. A chart can't tell you whether anyone did it on purpose. All a chart can show is the fact that "price tagged the zone where stops were clustered and came back." On a live stream, while looking at a stock chart, I once described this moment like this:
"It swept right through here. All the size on the stop line — it set off every stop. 'Get here and a ton of stops blow out' — it swept all of that up and absorbed it. That's a liquidity sweep." — Trader Steve, live stream, Oct 16, 2026 (translated from Korean) · ▶ Watch the stream highlights (Korean audio)
A buy-side sweep above a high is the mirror image. The moment the short stops (market buys) and breakout buys fire, a big seller sells into that size and gets out. Either way, anyone who placed a stop in the obvious spot ends up as the counterparty to a big order.
"If you don't understand this — sorry to say it — you become one of the retail traders who supply the market with liquidity. The seasoned pros show up in force to feed on that liquidity, and they trade it and walk away with the money." — Trader Steve, live stream, Oct 12, 2026 (translated from Korean) · ▶ Watch the stream highlights (Korean audio)
4. The Psychology: Where the People Who Held On Finally Give Up
A sweep zone holds more than orders. It holds people's psychology too.
When price first drops hard, most people hold on. Then a bounce comes and they feel relief — but price gets pushed back down to near the earlier low, and that's when the people who were holding on take their stop-losses, or break mentally and dump. The earlier low has become the psychological line of "this is the one level that has to hold." On a live stream, I pointed to this spot like this:
"The place where that sweep shows up is, for example, psychological. Look, there's liquidity laid out right here, isn't there? … It stabs right into this spot." — Trader Steve, live stream, Oct 16, 2026 (translated from Korean) · ▶ Watch this moment (Short, Korean audio)
So a sweep zone is both "the price where orders are concentrated" and "the price where the people who held on to the end finally give up." Once all the size waiting to be dumped is out, there are fewer sellers left, and it becomes easier for price to return inside.
5. Real BTC: Early September, When One Candle's High and Low Both Got Swept
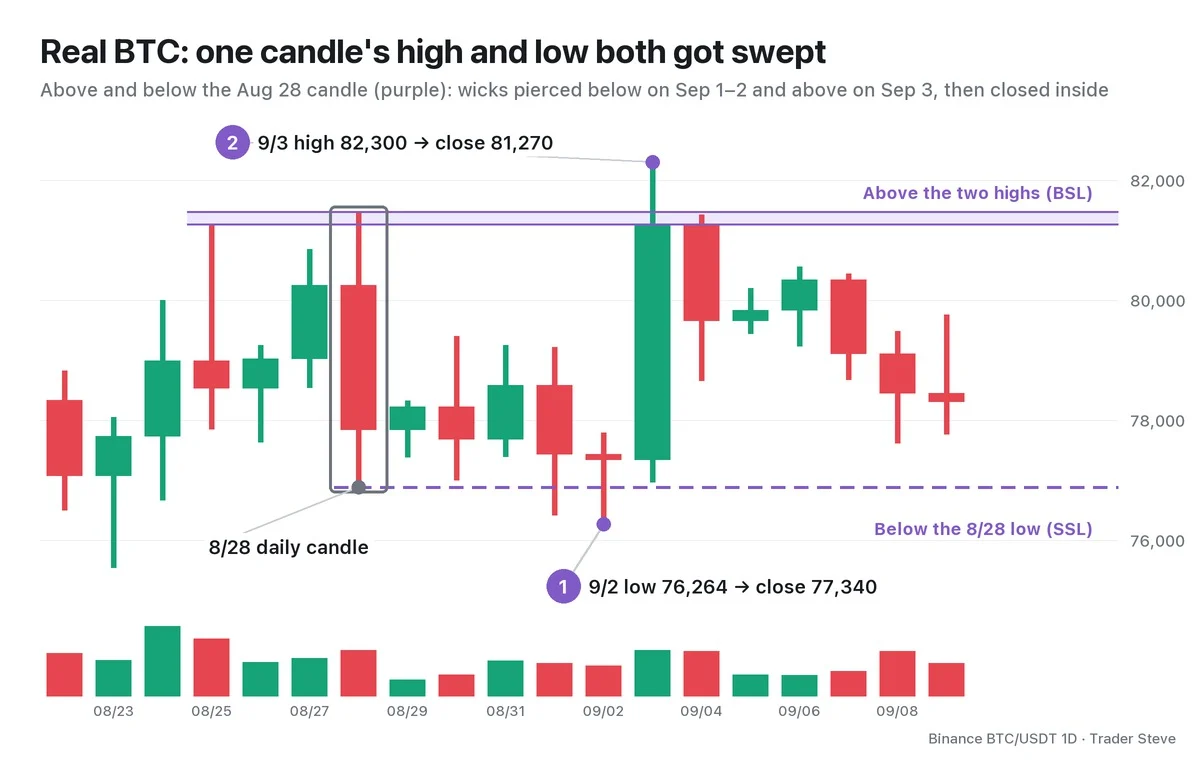
The Aug 28 daily candle had a high of 81,479 and a low of 76,888. Just below that high sat the Aug 25 high of 81,273, so the two highs were only 0.25% apart. You can assume that short stops and breakout buys were stacked above the spot where the two highs overlapped, and long stops below the low.
① First, the downside. On Sep 1 the low was 76,420 and on Sep 2 it was 76,264 — two days in a row, wicks dipped below the Aug 28 low (by up to 0.81%). But the closes were 77,439 and 77,340, back above it. That's a sell-side sweep.
② The very next day, Sep 3, the upside got swept. The high of 82,300 went 1.01% above the two highs, but the close was 81,270, below both of them. It closed about $2 below the Aug 25 high. How to judge a close this tight is covered in Part 2.
In three days, both the top and the bottom of one candle got swept. But the sweeps didn't settle the direction. On Sep 11, price stabbed below the Sep 2 low once more (76,047). A sweep is a record that "stops were swept," not a promise that "price will now reverse."
There's one more thing to see here. A move that clears a high cleanly, like the one intraday on Sep 3, looks like a breakout and draws in orders that chase it. But if the close comes back inside, those chase buys become stop-loss fuel for the next drop. Bait liquidity like this, which pulls people to one side before price reaches the real zone, is called inducement (IDM). It's the same idea I call "baiting longs" or "a move that coaxes out stop-losses" on the live stream. How to find inducement is shown with charts in Part 2.
This early-September scene, with both sides swept, comes back as a case study in ICT Swing Failure Pattern Part 4 (related lesson), and the Sep 3 high side also in ICT Turtle Soup Part 4 (related lesson).
Key Takeaways
- A liquidity sweep is a move where a wick crosses beyond a high or low and the close comes back inside. If the close is outside too, it's a breakout (a run).
- Short stops and breakout buys cluster above highs (BSL); long stops and breakout sells cluster below lows (SSL).
- When stop orders trigger, they become market orders and serve as the counterparty to big orders. That's why those zones get swept (a stop hunt).
- A sweep zone is also the psychological line where the people who held on finally give up.
- A sweep is confirmed only after the close, and even when confirmed, it doesn't guarantee direction.
In Part 2, we'll cover the criteria that separate a sweep from a breakout (reference line, penetration, close and decision timeframe) and how to find inducement. Where liquidity builds up is covered in ICT Liquidity (related lesson), and how to read a sweep as a single-candle pattern continues in the next topic on the swing failure pattern (SFP), ICT Swing Failure Pattern (related lesson).
Checking these reference lines and closes by hand for every market takes a fair amount of time. The Omnisight Report lays them out for each market.
This lesson adapts the text, figures and live-stream quotes of the Trader Steve TA series for the web, translated from the original Korean. Check the text and figure captions for the timing and interpretation of each real example, and read conceptual diagrams and real charts separately.
Corrections: support@omnisight.report


