
What Is Liquidity in ICT? BSL and SSL and Why Orders Pile Up There
Historical examples for learning · not current prices or trade recommendations.
Contents
On a chart you often see price nudge just past the prior high and stall, or blast in one move through a high it couldn't clear for weeks. ICT explains moves like these with liquidity. This lesson uses charts to show what liquidity is, why it builds up above highs and below lows, and why price gets pulled toward it.
1. The One-Line Definition: Prices Where Orders Are Clustered
In the financial news, liquidity means "money flowing through the market." On a chart, it means something a little different.
On a chart, liquidity is a price where orders waiting to be filled are clustered. In particular, it refers to places where these three overlap:
- Stop-loss orders (stops): when price touches a stop placed in advance, a market order fires automatically.
- Forced liquidations: in crypto futures, when margin runs out, the exchange closes the position by force. That, too, ends up as a market order.
- Breakout and breakdown orders: resting orders that say "buy if price clears the high" or "sell if price breaks the low."
These orders are invisible most of the time, then pour in all at once the moment price reaches that level. So think of liquidity as "the place where trading explodes when price gets there."
This assumes stop-market orders. A stop-limit order may go unfilled.
2. BSL Above Highs, SSL Below Lows
Liquidity is split into two kinds by direction.
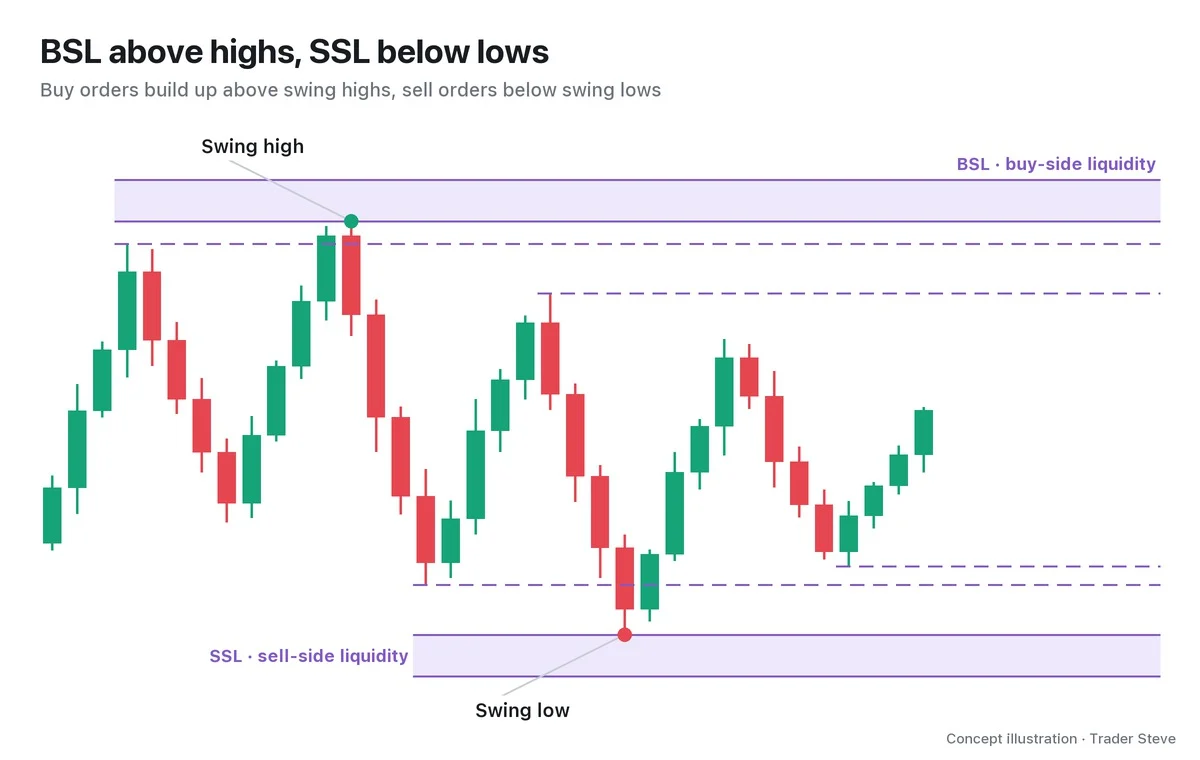
- Buy-side liquidity (BSL): buy orders stacked above a swing high
- Sell-side liquidity (SSL): sell orders stacked below a swing low
Why do "buy" orders pile up above a high? It becomes obvious once you look at who places which orders there.
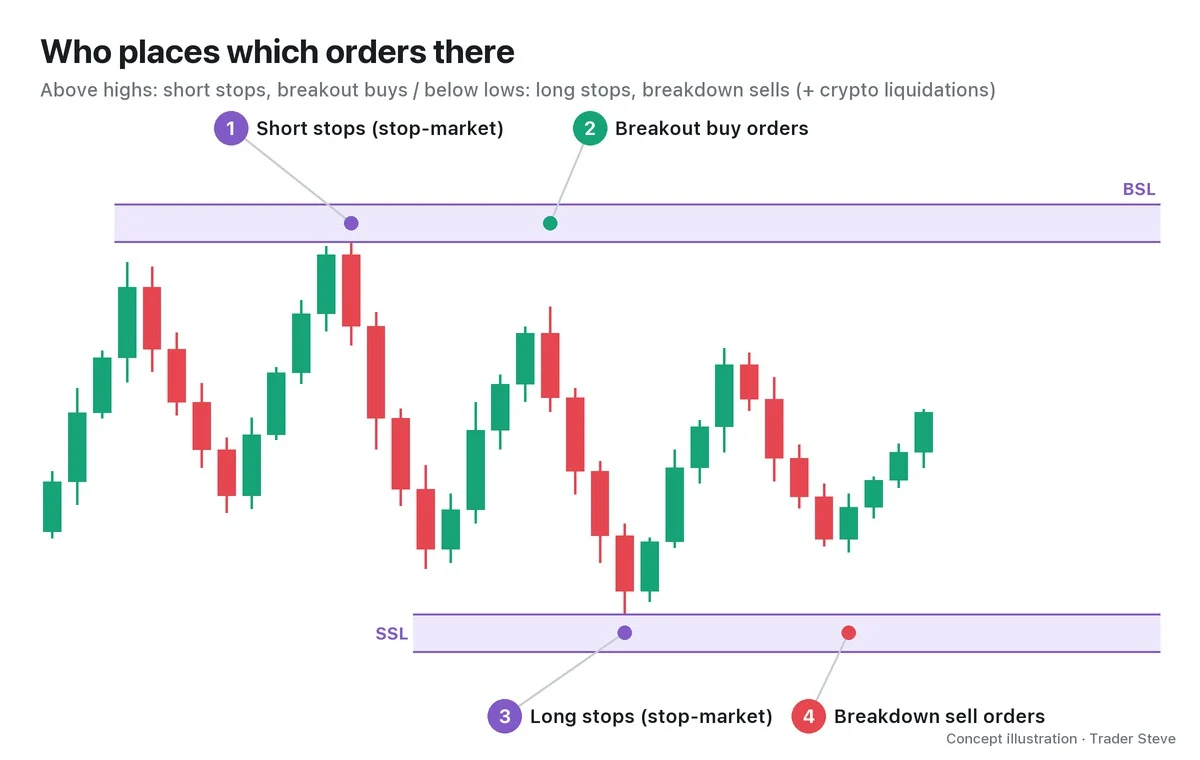
| Type | Location | Orders that build up | When triggered |
|---|---|---|---|
| BSL | above a swing high | ① stop-losses on short positions (buy stops), forced short liquidations, ② breakout buys | a wave of market buy orders hits at once |
| SSL | below a swing low | ③ stop-losses on long positions (sell stops), forced long liquidations, ④ breakdown sells | a wave of market sell orders hits at once |
Most traders who short near a high reason, "If price clears the high, I'm wrong," and put their stop just above it. A short's stop-loss is a buy order. Breakout buyers who want to chase price once it clears the high park their orders at the same spot. Below a low it is exactly the reverse.
On my live streams, I don't say BSL and SSL; I call them "liquidity lines," "liquidation size" and "stop-loss size." The names differ, but they mean the same places.
3. Why Big Players Need Liquidity
When an individual buys or sells a few coins, price barely moves. A player holding large size is in a different position. To sell a lot, they need that many buyers at the same time; if they dump where no such buyers exist, their own selling pushes price down and they lose money.
"The big players can't unload the size they built up on the way up unless it's at a spot like this, where liquidation size gets triggered and buying is forced to kick in. If they just dump it on the market, price drops like this." — Trader Steve, live stream, Aug 21, 2026 (translated from Korean) · ▶ Watch the stream highlights (Korean audio)
So from a big player's point of view, BSL is a pile of buy orders to hand size off to, and SSL is a pile of sell orders to build size from.
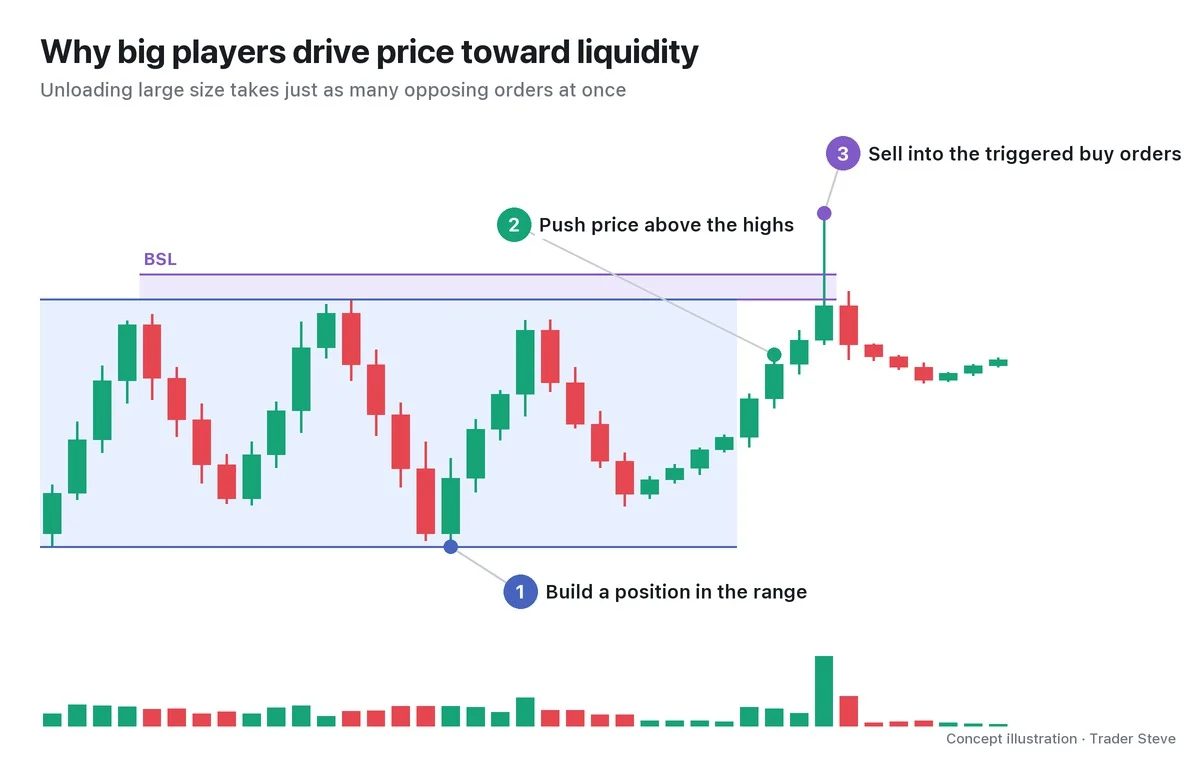
As the chart shows, the moment price reaches the BSL above a high, stops, liquidations and breakout buys fire together and volume explodes. That flood of buy orders is what big players can sell into. This is why price looks as if it is being "pulled" toward liquidity.
But this means a place price has a reason to go, not a place price is guaranteed to go. Whether price reverses after taking the liquidity or keeps going is covered separately in ICT Liquidity Sweeps (related lesson).
4. It Builds Up at Every Swing High and Low
Liquidity isn't found at just one or two special levels. Most people base their stops on the highs and lows they can see, so every single swing high and swing low becomes a small pool of liquidity. (The rules for defining swing highs and lows are covered in ICT Market Structure, ict/market-structure.)
"Every single one of these turning points down here is a liquidity pocket. All of these are spots where liquidity is clustered." — Trader Steve, live stream, Oct 12, 2026 (translated from Korean) · ▶ Watch the stream highlights (Korean audio)
Among them, more orders build up at these spots:
- Highs and lows that have held for a long time: the longer they stand, the more people base their stops on that price.
- Levels touched several times: when highs form at a similar level two or three times (a double top), the stops line up on one line. These are called equal highs and equal lows (EQH and EQL); Part 2 covers how to find them.
- Higher-timeframe highs and lows: daily and weekly highs are watched by more people, so they attract more orders.
5. Real BTC: One Candle Clears Liquidity Stacked Above Highs for 4 Weeks
Let's check it on a real Bitcoin (BTC) 4-hour chart. All times are Korea Standard Time (KST, UTC+9).
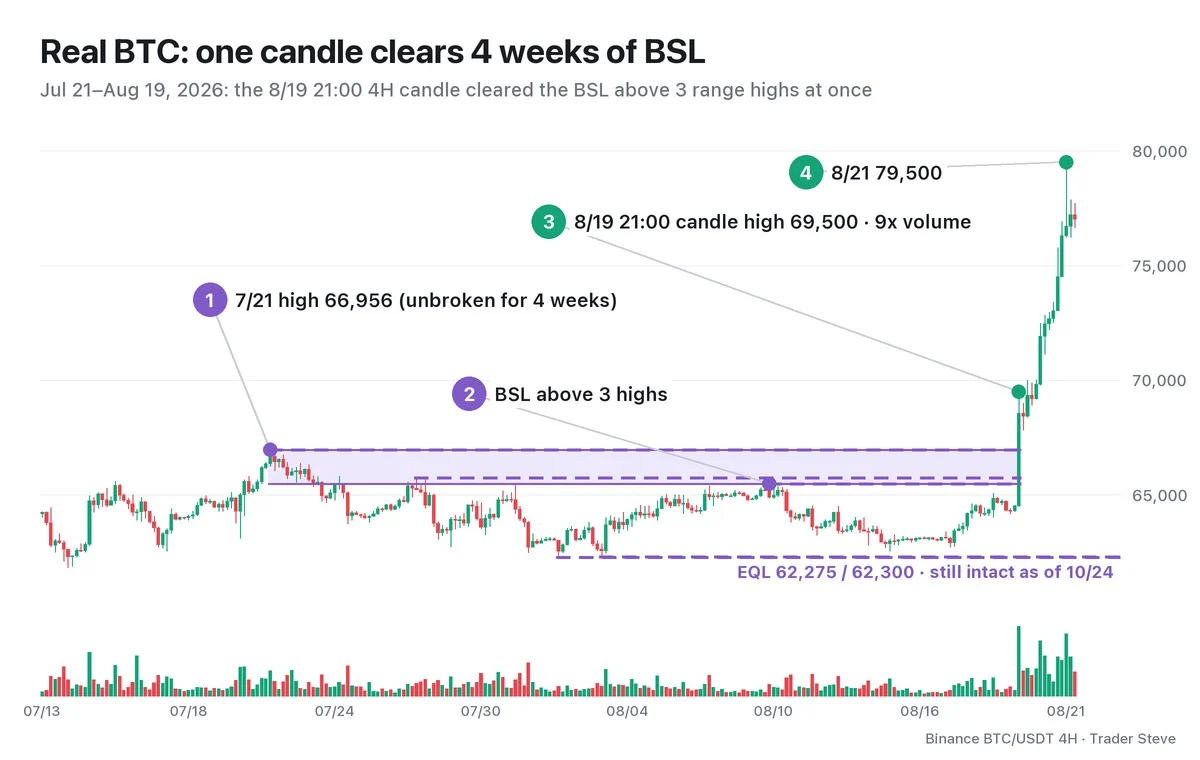
From mid-July to mid-August, Bitcoin traded sideways for about five weeks. In that time the 4-hour chart printed eight swing highs; five of them were already taken out inside the range, and three survived to the end.
- ① 66,956 at 21:00 on Jul 21: the range high. Even the highest candle over the next four weeks only reached 66,764 and never cleared it.
- ② 65,745 at 13:00 on Jul 27 and 65,474 at 05:00 on Aug 10: the two highs below it. Short stops and breakout buys were stacked layer upon layer above these three highs.
- ③ The 4-hour candle at 21:00 on Aug 19: it opened at 64,516 and ran to a high of 69,500, clearing all three highs in one move. Volume was 14,033 BTC, about 9x the average of the previous 30 candles.
- ④ The move then extended to a high of 79,500 on the 17:00 candle on Aug 21 (about 23.2% above the open of candle ③).
Volume exploding to 9x on one candle is the footprint of the orders stacked above the highs all being filled at that moment. Here is how I summed up the rally:
"The reason Bitcoin made a move like this is simply that a lot of short-liquidation liquidity had built up above. … If you think of it as the big players moving the crypto market to pick all the ripe fruit hanging up there, that's really all there is to it." — Trader Steve, live stream, Aug 22, 2026 (translated from Korean) · ▶ Watch the stream highlights (Korean audio)
Let's look at the other side too. At the bottom of the same range there are nearly equal lows (EQL): 62,275 at 01:00 on Aug 2 and 62,300 at 17:00 on Aug 3, only 0.04% apart. As of Oct 24, the SSL below these lows has never been broken and is still there. The liquidity above has been taken, and the liquidity below remains. Marking on the chart, like this, "where orders are still waiting" is the starting point of liquidity analysis.
Key Takeaways
- On a chart, liquidity is a price where stop-losses, forced liquidations and breakout orders are clustered.
- Above a swing high is BSL (buy-side liquidity); below a swing low is SSL (sell-side liquidity).
- Big players need opposing orders large enough to absorb their size, so price is often pulled toward liquidity.
- More of it builds up at highs and lows that have held for a long time, levels touched several times, and higher-timeframe highs and lows.
- Liquidity is only "a place price has a reason to go," not a confirmed signal.
In Part 2, we'll cover the criteria for finding equal highs and lows (EQH and EQL) and the steps for drawing liquidity pools on a chart.
This lesson adapts the text, figures and live-stream quotes of the Trader Steve TA series for the web, translated from the original Korean. Check the text and figure captions for the timing and interpretation of each real example, and read conceptual diagrams and real charts separately.
Corrections: support@omnisight.report


