What Is Market Structure? Reading Trend From Swing Highs and Lows
Historical examples for learning · not current prices or trade recommendations.
Contents
Whether you start with fair value gaps (FVGs) or order blocks, learning ICT concepts eventually brings you back to the same question: "So should I be looking up or down right now?" The yardstick that answers it is market structure (MS). This lesson uses charts to show how to tell whether the market is in an uptrend, a downtrend or a range from nothing but the order of its highs and lows.
1. Market Structure in One Line
Market structure is the sequence in which swing highs and swing lows follow one another. It is not a tool for predicting where price goes next. It is closer to a record of how the market has built its highs and lows so far.
The idea isn't new. It carries over the trend definition of Dow Theory, widely seen as the root of chart analysis.
"Dow Theory is the foundation of all chart analysis. Elliott Wave, ICT, Wyckoff — this is the foundation. A structure that keeps raising its highs and lows is a bullish structure. That's all it is." — Trader Steve, live stream, Oct 22, 2026 (translated from Korean) · ▶ Watch the stream highlights (Korean audio)
The Dow-style definition of trend itself is covered in detail in the Basics Swings and Trend topic (related lesson). This topic focuses on the framework ICT builds on top of it: what size of swing to mark, and how to separate the big structure from the small one.
2. Swing Highs and Lows: Found With Three Candles
To read structure, you first have to mark the turning points. ICT's basic definition uses three candles.
- Swing high: the middle candle's high is higher than the highs of the candles on either side
- Swing low: the middle candle's low is lower than the lows of the candles on either side

The definition is simple, but there's one catch. A swing high only becomes visible once the candle to its right has closed. The fact that the highest candle so far has just printed doesn't make that spot a high yet. ICT calls these small three-candle swings a short-term high (STH) and a short-term low (STL). How to pick out the more important swings among them, and when a swing is confirmed, are covered in Part 2.
3. Bullish Structure, Bearish Structure and Ranges
Once the swings are marked, compare each one with the previous swing of the same kind: highs with the previous high, lows with the previous low.
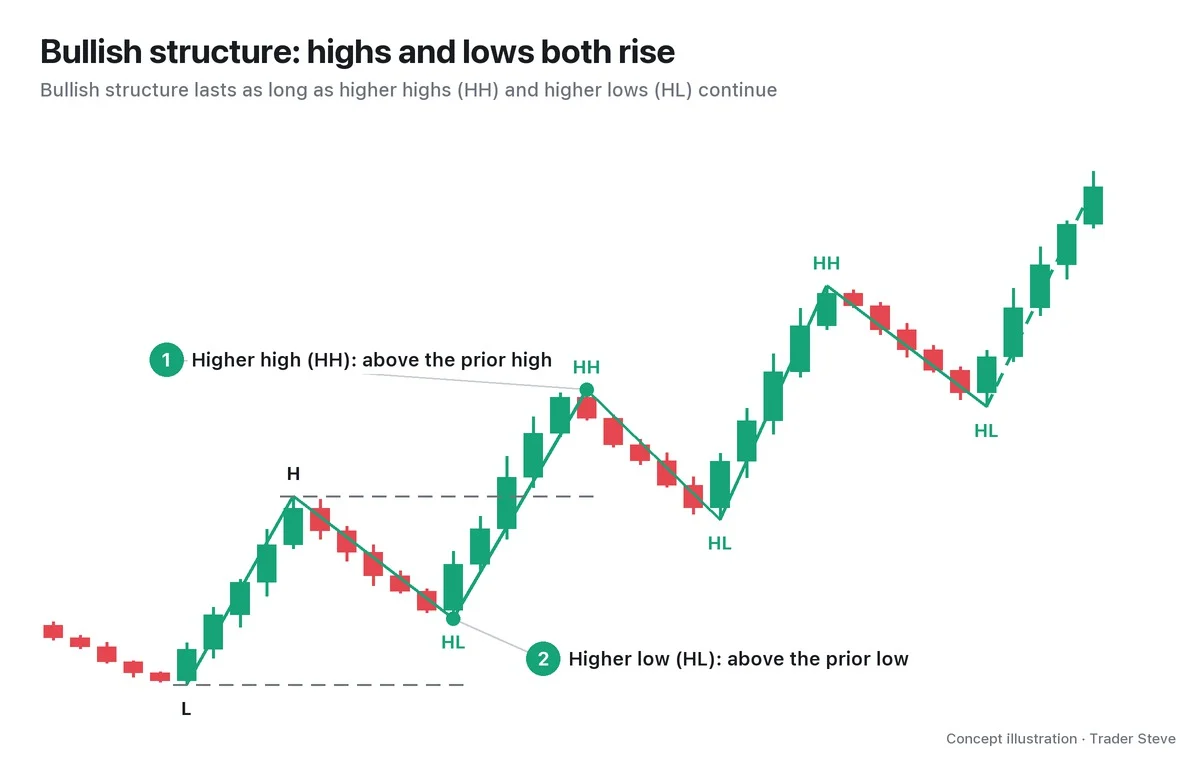
A bullish structure is one where higher highs (HH) and higher lows (HL) keep alternating. On the Aug 20 live stream, I asked, "What's the definition of a bull market?" and then pointed out that swing highs and swing lows getting progressively higher is what marks the start of one.
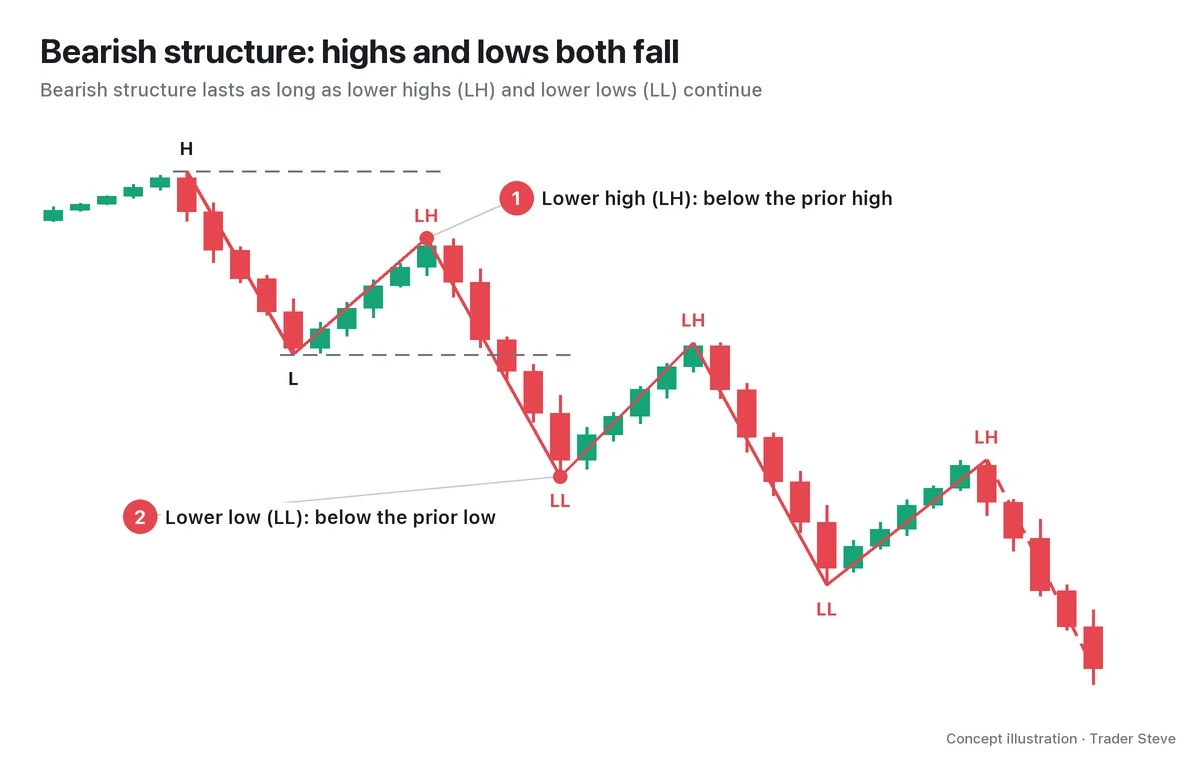
A bearish structure is one where lower highs (LH) and lower lows (LL) keep following each other. If a bounce comes but turns down without clearing the previous high, that bounce is just one more LH inside the bearish structure.
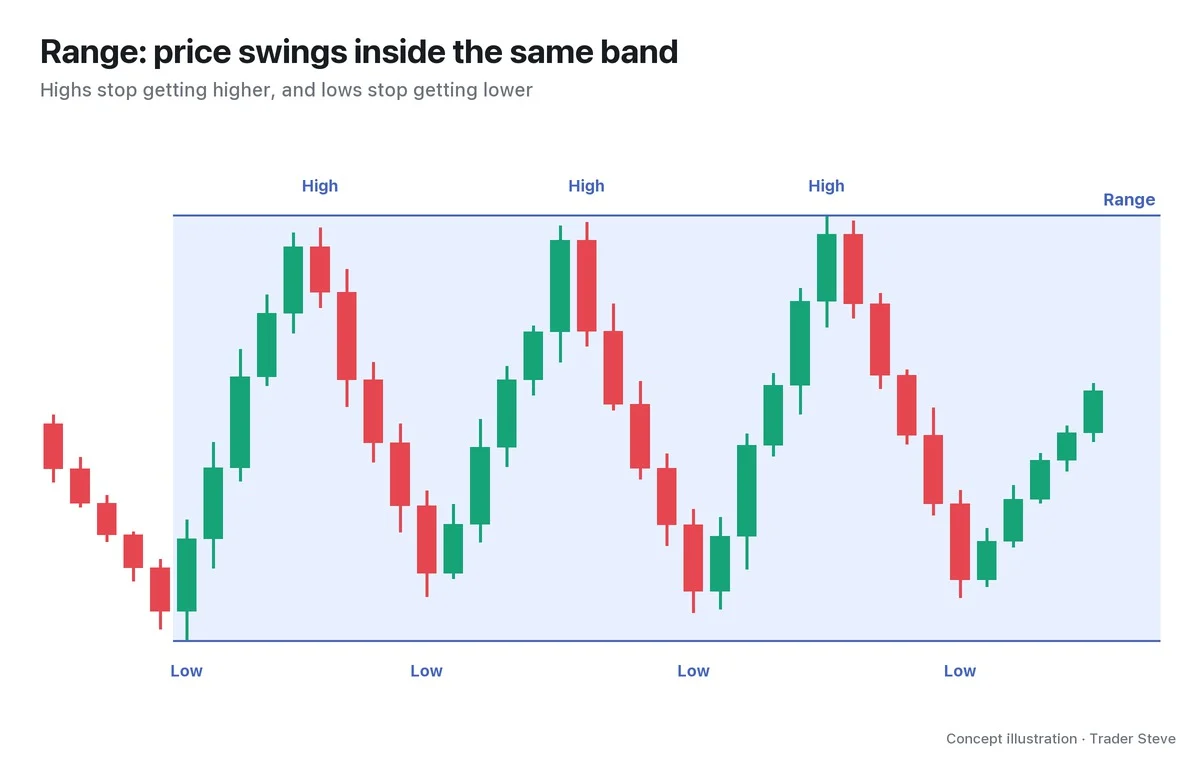
A range is a state where highs and lows repeat inside one band. You see several highs and lows at almost the same height. ICT calls these equal highs and equal lows (EQH/EQL) and pays separate attention to the orders stacked above and below them (the Liquidity topic, ict/liquidity).
4. Why ICT Looks at Structure First
ICT analysis usually runs in the order "structure → location → entry." There are three reasons to start with structure.
- It sets your directional bias. In a bullish structure, your default is a buy-side scenario; in a bearish structure, a sell-side scenario. A trade against the structure needs far more evidence.
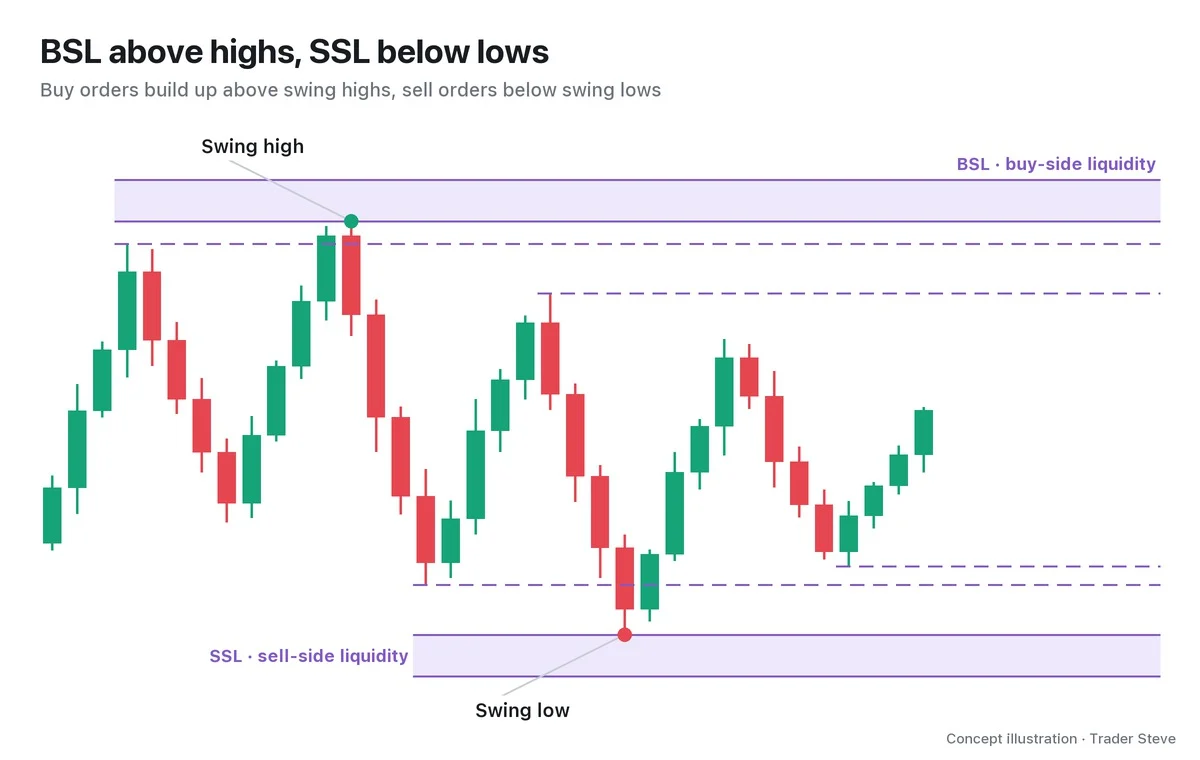
- It shows you where liquidity sits. Just above a swing high sit the stops of short positions and breakout buy orders; just below a swing low sit the stops of long positions. That's why price moves unusually violently near swings.
- It decides which way to use your other tools. The same FVG or order block (OB) is a zone to hold price up on a pullback in a bullish structure, and a zone to cap price on a bounce in a bearish structure.
Here's how I warn against the habit of flipping your bias off a single large bullish candle:
"If you're saying things like 'a large bullish candle printed, so this is the real bounce from here' without any thought for the buy and sell structure, the flow of liquidity, or where the structural shift — raising or lowering highs and lows — actually happens, there's a good chance you'll end up as the market's sacrifice, wearing the 'liquidity provider' title around your neck." — Trader Steve, live stream, Aug 20, 2026 (translated from Korean) · ▶ Watch the stream highlights (Korean audio)
The point is to look at whether the order of highs and lows has changed, not at a single candle. The names for the moment structure breaks — break of structure (BOS), change of character (CHoCH) and market structure shift (MSS) — are covered in the topic after this one, ICT BOS and CHoCH (related lesson).
5. A Real Bitcoin Example
On the Bitcoin 12-hour chart from late March to early June 2026, I marked swings using 3 candles on each side (7 candles in total) and labeled each one by comparing it with the previous swing of the same kind.
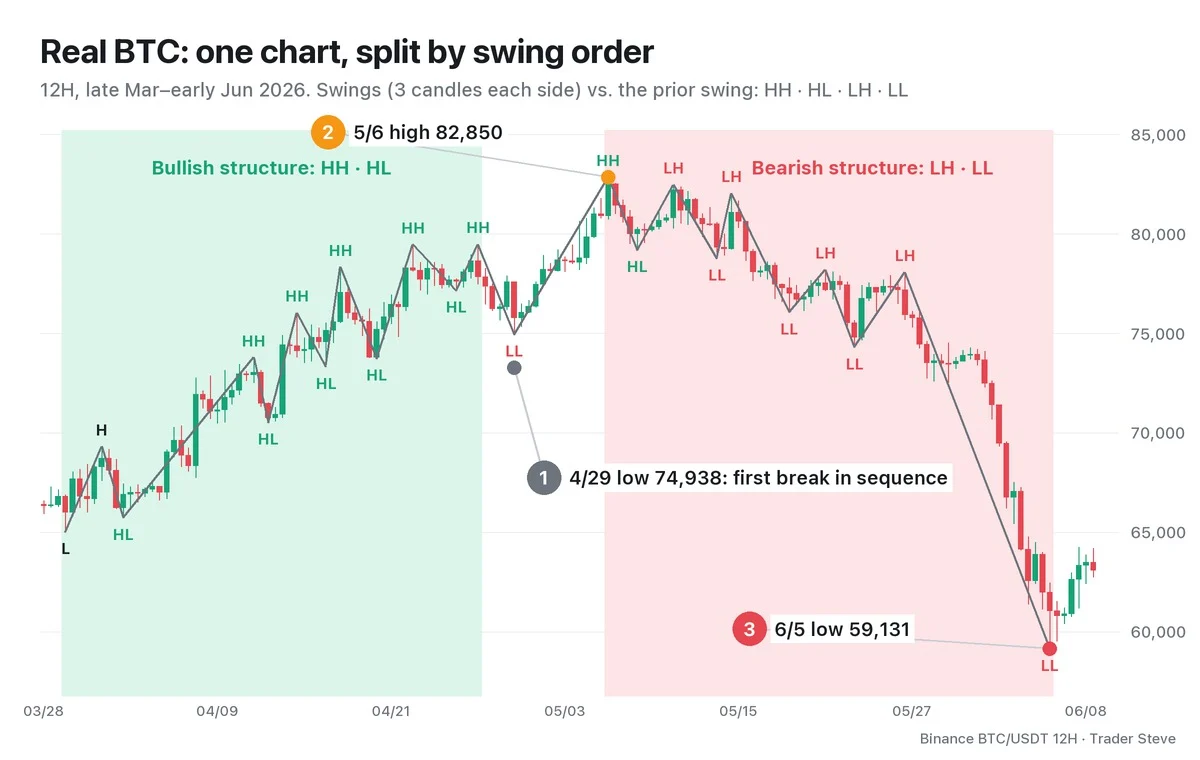
- Rising stretch (Mar 29–Apr 27): lows went 65,000 → 65,712 → 70,506 → 73,310 → 73,724 → 77,140, and highs went 69,310 → 73,790 → 76,038 → 78,333 → 79,473 → 79,486 — six times each, every one higher than the last. From the first low to the last high, price rose about 22.3%.
- Mixed stretch (①): the Apr 29 low of 74,938 was lower than the previous low of 77,140. This was the first spot where the sequence broke. But right after, price made a higher high again at 82,850 on May 6 (②). Where direction is changing, it's common for the sequence to get briefly mixed like this.
- Falling stretch (after May 6): with 82,850 as the peak, highs went 82,479 → 82,048 → 78,200 → 78,080, and lows went 79,181 → 78,755 → 76,051 → 74,290 → 59,131, lower every single time. From the high to the low of the 12-hour candle that opened at 21:00 KST on Jun 5 (③), that's a drop of about 28.6%.
Same chart, same candles — yet just following the order of highs and lows splits it cleanly into a bullish structure and a bearish structure. Conversely, if you had called a "bearish reversal" off the single Apr 29 low, the very next HH would have shaken you out. Which swings to weight more heavily, and how to separate the big structure (external) from the small structure (internal), is the subject of the next part.
Key Takeaways
- Market structure is the sequence in which swing highs and lows follow one another — a record of what has happened, not a tool for predicting what comes next.
- Swing highs and lows are found with three candles and only become visible once the candle to the right has closed.
- HHs and HLs in a row mean a bullish structure; LHs and LLs in a row mean a bearish structure; highs and lows repeating inside one band mean a range.
- ICT uses structure to set the direction first, then uses zones like FVGs and order blocks in that direction.
- One break in the sequence is not an immediate reversal. Which swing you treat as the reference matters.
In Part 2, we'll cover how to pick out the important swings using short-, intermediate- and long-term highs and lows, and the criteria for separating external structure from internal structure. If redrawing the structure by hand at every high and low feels tedious, the Omnisight Report, which lays out the structure for each market, is worth a look.
This lesson adapts the text, figures and live-stream quotes of the Trader Steve TA series for the web, translated from the original Korean. Check the text and figure captions for the timing and interpretation of each real example, and read conceptual diagrams and real charts separately.
Corrections: support@omnisight.report