
What Is a Mitigation Block? Meaning and How It Forms
Historical examples for learning · not current prices or trade recommendations.
Contents
You often see a trend try to make one more higher high, run out of strength and turn. In ICT, the candle left behind at the turning point is called a mitigation block (MB), and traders use it as a reference for an opposite-direction reaction when price comes back to it. This lesson uses charts to show what a mitigation block is, how it forms, and why price tends to react when it returns.
1. The One-Line Definition: An Order Block Broken After a Failure Swing
A mitigation block is the order block left at the swing point where structure turned, after a swing failed to make a new high (or low) and market structure shifted.
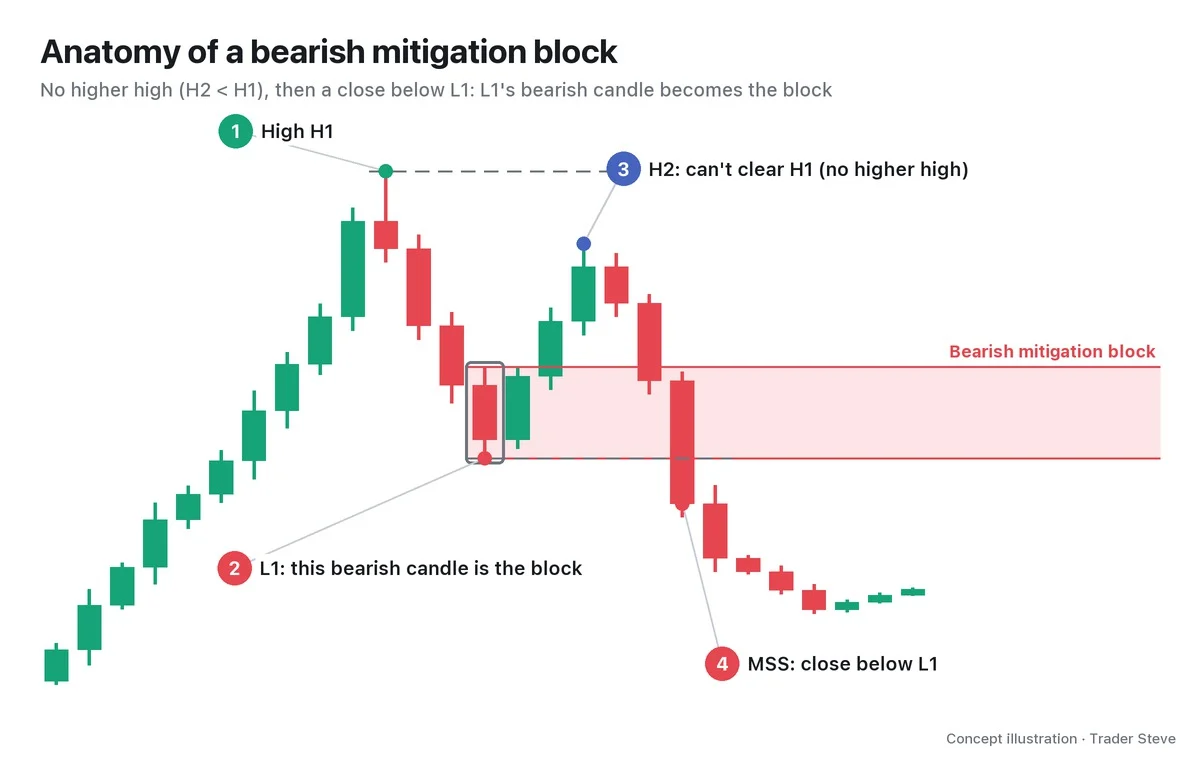
A bearish mitigation block forms in four steps.
- H1: an uptrend makes a high.
- L1: price pulls back and makes a low. The last bearish candle (a candle that closes down) at this low later becomes the block.
- H2 < H1: price rallies again but can't clear H1. This is called a failure swing.
- Market structure shift (MSS): price closes below L1. A wick that pokes below and comes back up doesn't count.
It only becomes a mitigation block once step ④ prints. If you call it a block after seeing only step ③, it is still just a candidate. In this series, the block is the high-to-low range of the first bearish candle you find counting back from the L1 candle, and the 50% price of that candle's body (open to close) is marked separately as the body midpoint (body-mid). The mean threshold (MT) from ICT Order Blocks (related lesson) is the midpoint between the block's high and low, so it is a different line from the body-mid (for the Apr 1 block below, MT is 68,444 and the body-mid is 68,499). Some sources group several candles or use the body only; this series uses a single candle, wicks included.
2. Bearish and Bullish Mitigation Blocks
Flip the direction and you get a bullish mitigation block.
| Type | Prior trend | Failure swing | MSS | Block |
|---|---|---|---|---|
| Bearish MB | Up | No higher high (H2 < H1) | Close < L1 | Last bearish candle at L1 |
| Bullish MB | Down | No lower low (L2 > L1) | Close > H1 | Last bullish candle at H1 |
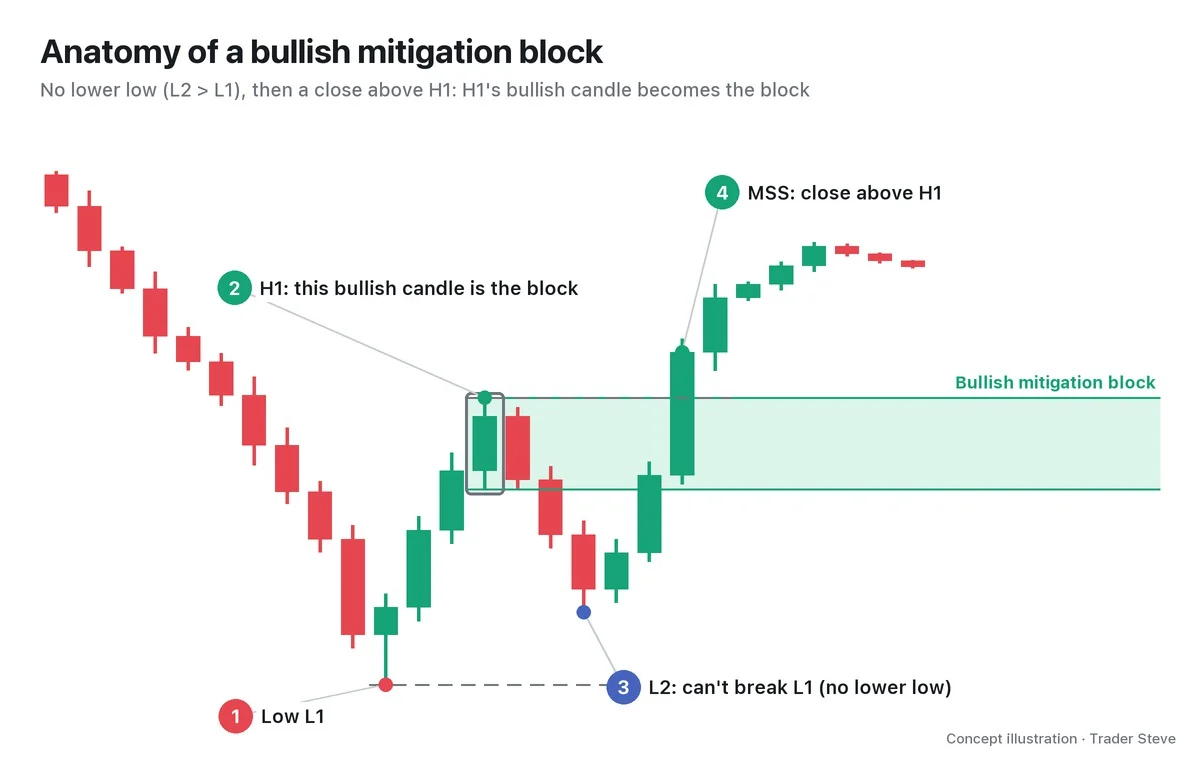
The key point is that the block's original role flips. L1's bearish candle used to be the spot that supported the uptrend. Once the MSS breaks through it, it becomes the spot that presses price down from above. It is the same logic as a support/resistance flip, where broken support becomes resistance. Order blocks themselves are covered in the ICT Order Blocks lessons, and the MSS in the break of structure (BOS) and change of character (CHoCH) lessons.
3. What the Name Means: "Mitigation" = Trapped Traders Getting Out at Breakeven
To mitigate means to reduce or soften a loss. That is where the block gets its name.
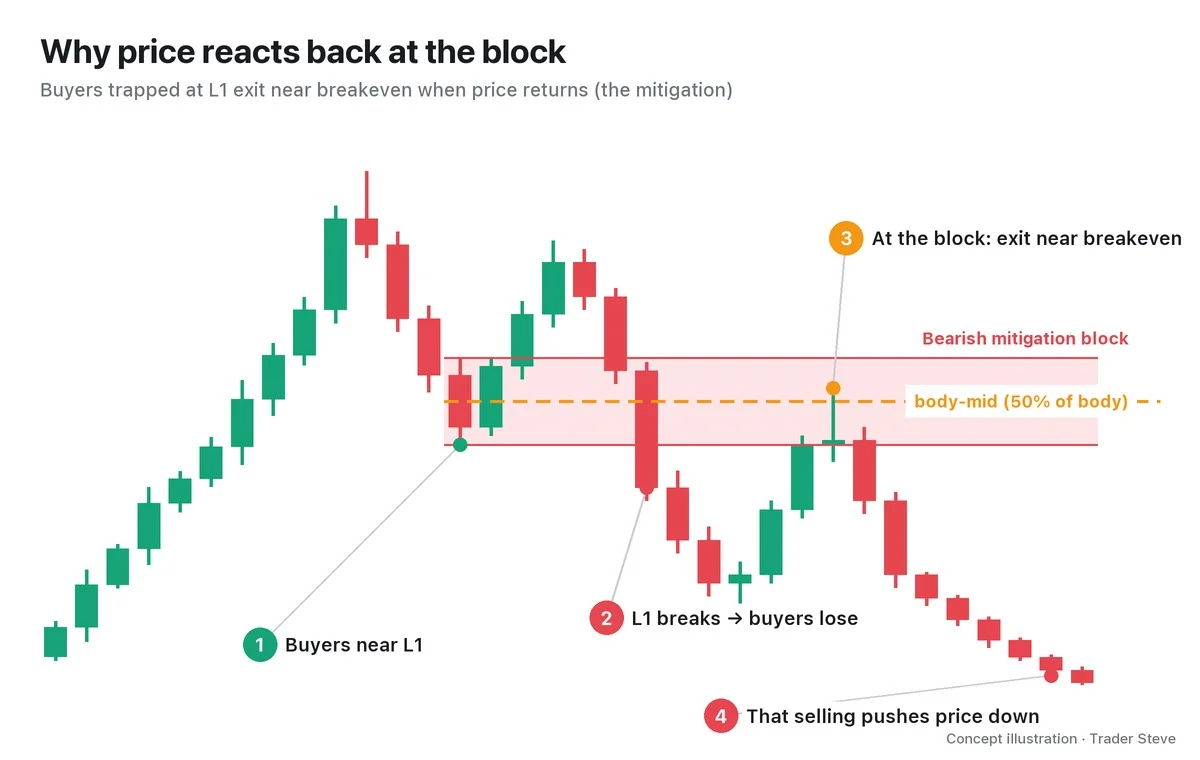
Let's walk through it with a bearish mitigation block.
- Some buyers bought near L1, thinking "this should hold."
- When price turns at H2 and closes below L1, those buyers are underwater.
- After price has fallen a good way and then retraces back up to the block, those buyers get a chance to cut the loss or get out close to breakeven.
- As that exit hits the market as selling, price often gets pushed down again near the block.
In other words, a mitigation block is where size trapped by the structure turn gets out. A bullish mitigation block is the reverse: traders who sold near H1 get trapped, and when price comes back down to the block they buy back near breakeven (closing shorts), which creates buying pressure.
4. Why Price Comes Back and Reacts: The Big Players' Average Entry
On the live stream, I explain this spot a little more broadly, as where the big players absorbed size. If price was pushed hard but stopped going further and came back, it means someone took in size around there.
"You could think of this as the spot where the big players pushed down hard on size they hadn't finished filling, couldn't push it any further, and started absorbing size from here. What do you call this? In ICT, it's called a mitigation block." — Trader Steve, live stream, Oct 14, 2026 (translated from Korean) · ▶ Watch the stream highlights (Korean audio)
If the average entry price of whoever absorbed that size sits there, they have a reason to defend it when price comes back near it. On the other hand, above their average entry they can dump size without taking a loss, so price doesn't move in a straight line; it shakes around on the way.
"Within this zone, the big players' average entry is right here. Once they've spent money pushing price up, anything they dump on the way back down to their average entry is still all profit, from their point of view. That's why price is bound to shake around as it goes." — Trader Steve, live stream, Oct 23, 2026 (translated from Korean) · ▶ Watch the stream highlights (Korean audio)
Trapped traders exiting at breakeven (the textbook explanation) and the absorbing side defending its average entry (the live-stream explanation) are the same spot seen from two directions. Both explanations only go as far as "there is a reason for a reaction if price returns." A block is a place to watch for a reaction, not a place where price is guaranteed to turn. A bearish MB is treated as invalid once price closes above the block high, and a bullish MB once price closes below the block low.
5. What It Looks Like on a Real Bitcoin Chart
Let's look at a bullish mitigation block that formed on the Bitcoin 12-hour chart. All times are Korea Standard Time (KST, UTC+9).
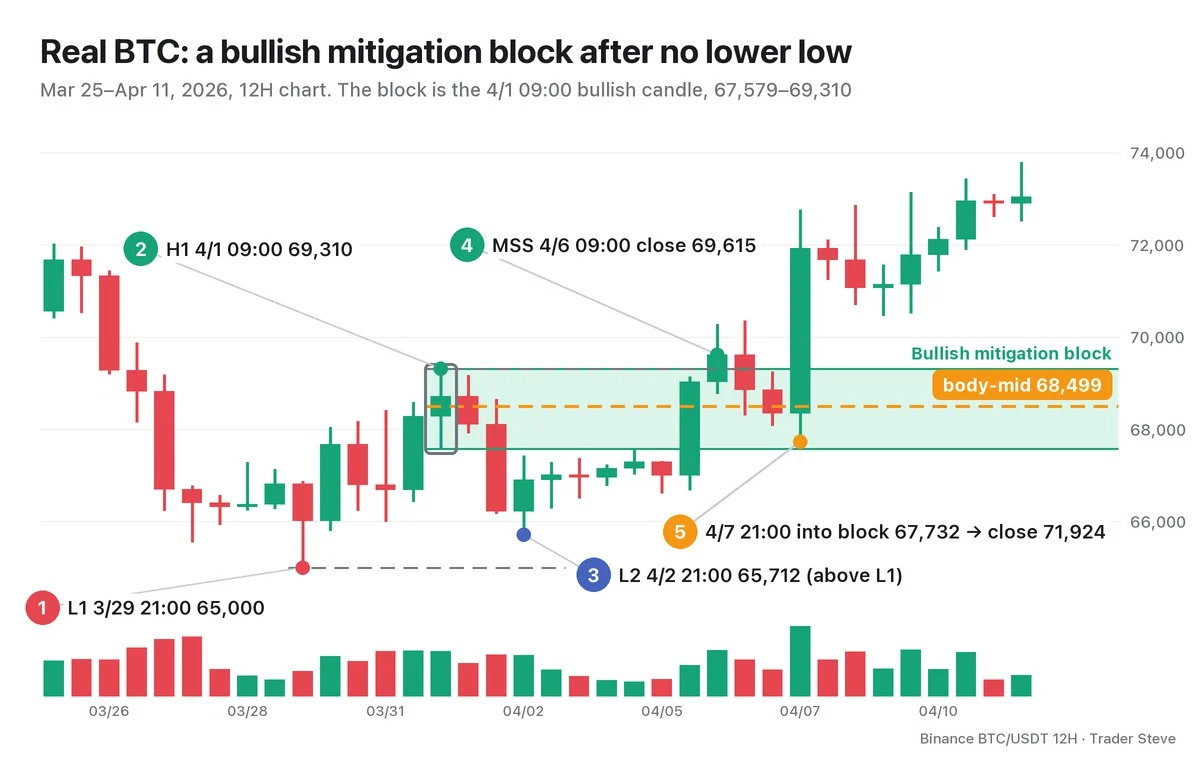
- L1: the 21:00 candle on Mar 29 dropped to 65,000 and made a low.
- H1: the 09:00 bullish candle on Apr 1 rose to 69,310. This candle becomes the block.
- L2: the 21:00 candle on Apr 2 was pushed down to 65,712 but stopped $712 above L1. That is a failure to make a lower low.
- MSS: the 09:00 candle on Apr 6 closed at 69,615, a close above H1.
- Retracement: the 21:00 candle on Apr 7 came down into the block to 67,732. It went past the body-mid (68,499) and stopped $153 above the block low of 67,579, and the same candle closed at 71,924.
Bitcoin then rallied to 82,850 on May 6, 22.3% above the in-block low of 67,732. The Apr 8 12-hour fair value gap (FVG) left by this bounce was covered in Case C of ICT FVG Part 4. Still, this is just one success story. A block that was invalidated by a close through it comes in Part 2, and a block price never came back to comes in Part 4.
Key Takeaways
- A mitigation block is an order block broken by a closing MSS after a swing failed to make a new high or low.
- Bearish MB: H2 < H1 → close < L1 → the last bearish candle at L1. Bullish MB: L2 > L1 → close > H1 → the last bullish candle at H1.
- The name means "loss mitigation." It is where traders trapped by the structure turn exit near breakeven, so reactions are common there.
- Before the MSS it is only a candidate, and a close beyond the far side of the block invalidates it. It is a place to watch for a reaction, not a confirmed signal.
In Part 2, we'll cover the four steps for finding a mitigation block on a chart and how to tell it apart from the similar-looking breaker block.
You can also check the Omnisight Report.
This lesson adapts the text, figures and live-stream quotes of the Trader Steve TA series for the web, translated from the original Korean. Check the text and figure captions for the timing and interpretation of each real example, and read conceptual diagrams and real charts separately.
Corrections: support@omnisight.report


