
What Is an Order Block? ICT Order Blocks Explained and How They Form
Historical examples for learning · not current prices or trade recommendations.
Contents
Right before price is shoved hard in one direction, there is very often a single candle pointing the other way. In ICT, that candle is called an order block (OB), and it marks a place to watch how price reacts when it comes back later. This lesson uses charts to show what an order block is, why it forms, and why price often returns to it.
1. The One-Line Definition: The Last Opposite Candle Before a Strong Move
An order block is the last opposite-direction candle just before a strong move that breaks structure. You treat that candle's full range, from its high to its low (wicks included), as one price zone and draw it as a box.
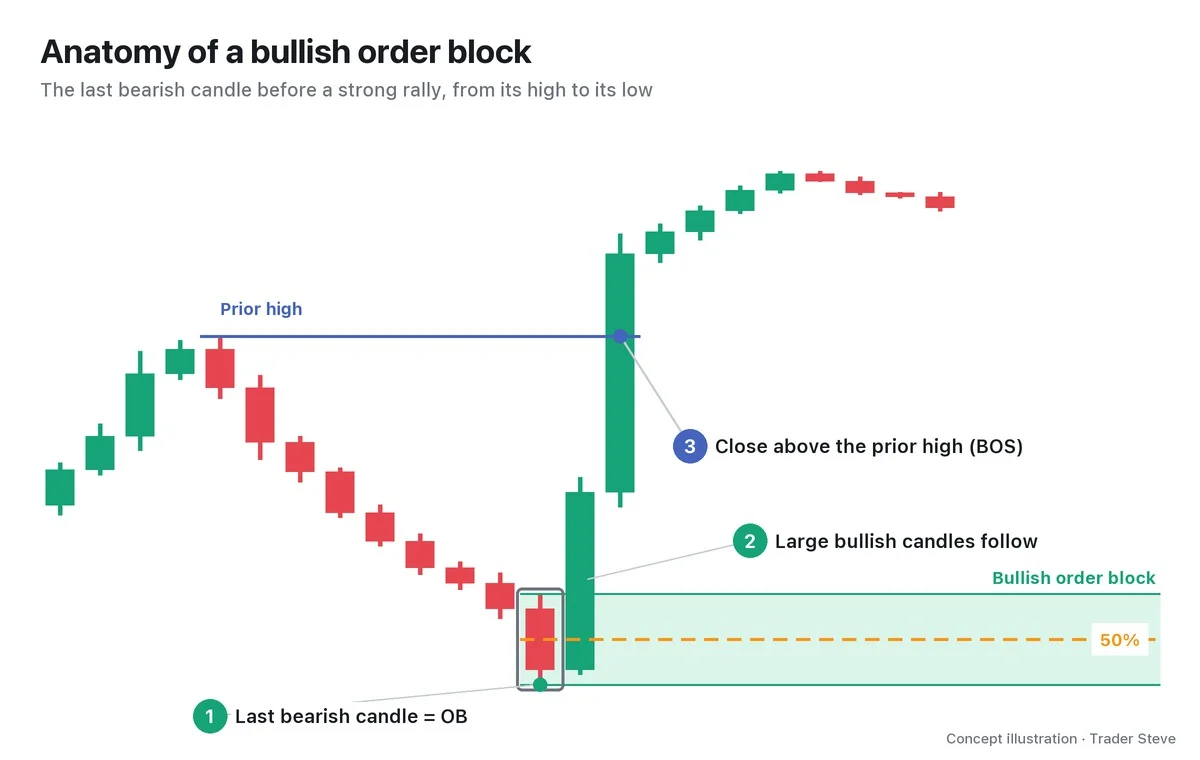
Read the chart in order:
- The last bearish candle: the bearish candle at the very end of the decline. This candle is the order block.
- Large bullish candles: right after it, big bullish candles follow one after another and drive price higher. ICT calls this kind of forceful move displacement.
- Break of structure (BOS): the rally moves above the prior high on a closing basis.
The order matters. You can't tell from one bearish candle whether it is an order block. Only when the strong move that follows breaks the prior high can you say "that starting point was an order block." Charts are full of bearish candles, but an order block refers only to the bearish candle that launched a big move.
The orange dashed line in the chart is the exact midpoint (50%) of the order block. ICT calls this 50% line the mean threshold (MT), and Part 2 covers it in detail.
2. Bullish and Bearish Order Blocks
Order blocks also come in two directions.
| Type | Which candle | Range | Expected role |
|---|---|---|---|
| Bullish OB (+OB) | the last bearish candle before a strong rally | that candle's high to low | support that holds price up when it comes back down |
| Bearish OB (-OB) | the last bullish candle before a strong drop | that candle's high to low | resistance that caps price when it comes back up |
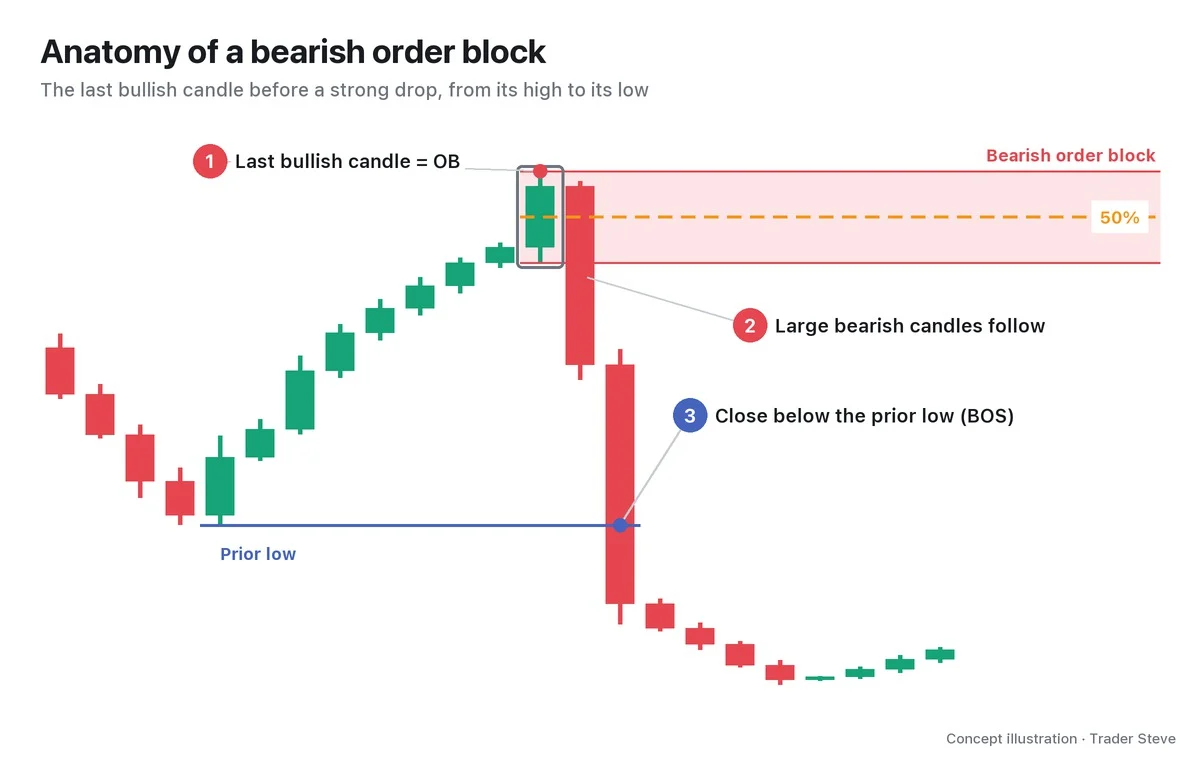
If the names get confusing, remember them as "the candle that launched the rally" and "the candle that launched the drop." It feels odd at first that a bullish OB is a bearish candle and a bearish OB is a bullish candle. That's because price tends to dip once in the opposite direction right before a big move takes off.
3. Why It Forms: Where Big Orders Piled In
The "order" in order block means exactly that: orders. When a player big enough to move the market wants to buy (or sell) a lot at one price, and there isn't enough size on the other side, price can't stay there for long — it gets pushed away in one direction. On the live stream, I explained this process while looking at the 4-hour chart of a US 3x leveraged semiconductor ETF (SOXL). That's a stock chart, but the principle is the same on crypto charts.
"For the big players, from here down is the order block. They wanted to buy a lot at this price. But there weren't many sellers. The sellers had already been shaken out. So when they swept upward like this, price got pushed all the way up." — Trader Steve, live stream, Aug 27, 2026 (translated from Korean) · ▶ Watch this moment (Short, Korean audio)
The bearish side works the same way. Where a rising price suddenly turns and drops, there's a trace of heavy selling and buying colliding.
"It was going up, and it got turned around and dumped. A huge amount of buying and selling must have happened here, and this is where what's called an order block formed. Put simply, it's the support/resistance line in ICT terms." — Trader Steve, live stream, Oct 16, 2026 (translated from Korean) · ▶ Watch the stream highlights (Korean audio)
So an order block is seen as a price zone where big orders went in, and where the side that pushed price holds its average entry price. In the end, "order block" is a name for "the starting point where someone placed a big bet" — put simply, ICT-style support and resistance.
4. Why Price Comes Back: A Preview of Mitigation
After price leaves an order block, it often comes back later to touch it. This is called mitigation.
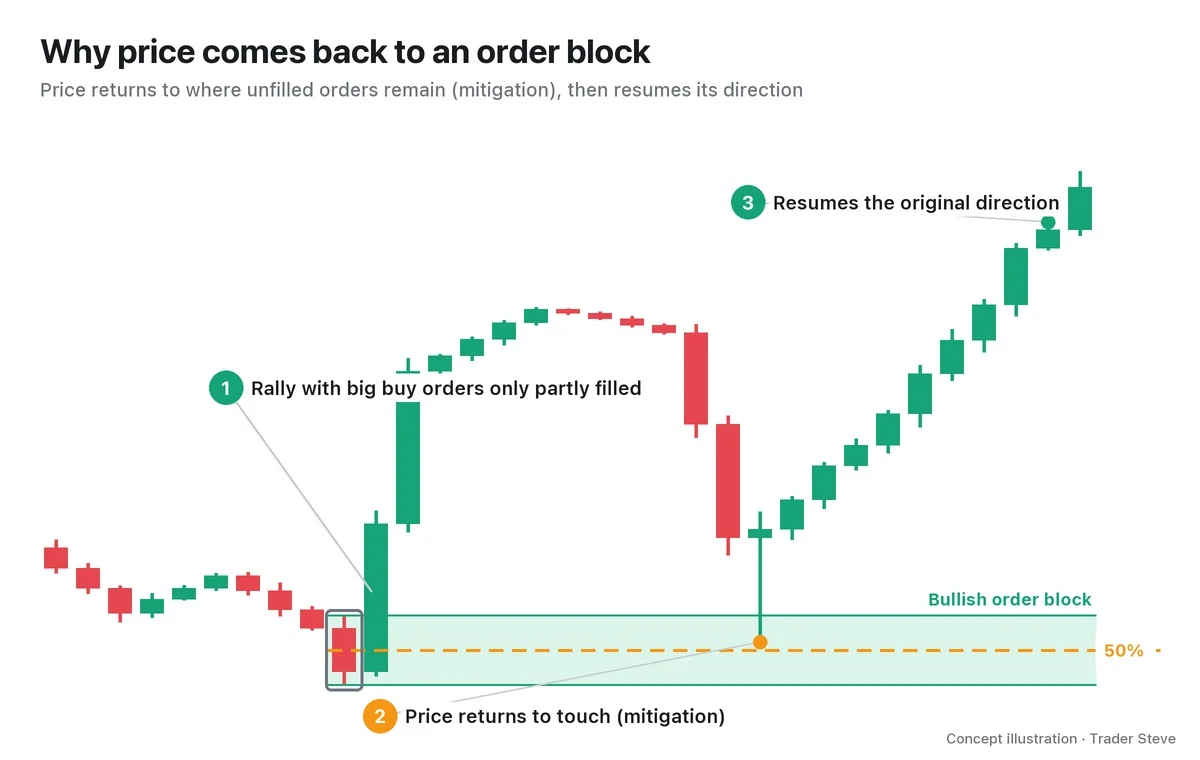
There are two explanations for why it returns.
- Leftover orders: price left so fast that not all of the orders meant for that zone got filled. When price comes back, the rest of those orders come in.
- Defending and unwinding the average entry: when price comes back near its average entry, the side that pushed first either adds to its position or, the other way around, uses the chance to close a position that went against it near breakeven.
Below is what I said a day earlier, on Aug 26, looking at the same 3x semiconductor ETF chart. I had said beforehand that if price rallied too fast, leaving gaps, it could come back down once to tag the order block — and that pullback actually came.
"I said that if it keeps going up like this, just leaving gaps, it could rally off this order block and then come back down once to tag it — and that drop came." — Trader Steve, live stream, Aug 26, 2026 (translated from Korean) · ▶ Watch the stream highlights (Korean audio)
One point is worth stressing. An order block is a place price may revisit, not a place guaranteed to hold price up. It is common for price to come back and slice straight through it, and in many cases price never returns at all. How to tell an order block that has already been touched from one that hasn't, and how far price can push before you treat it as invalid, is covered in Part 2.
5. Order Blocks Don't Form Alone: They Come With an FVG and a BOS
The strong move that creates an order block usually leaves other traces too. Let's check it on a real Bitcoin daily chart.
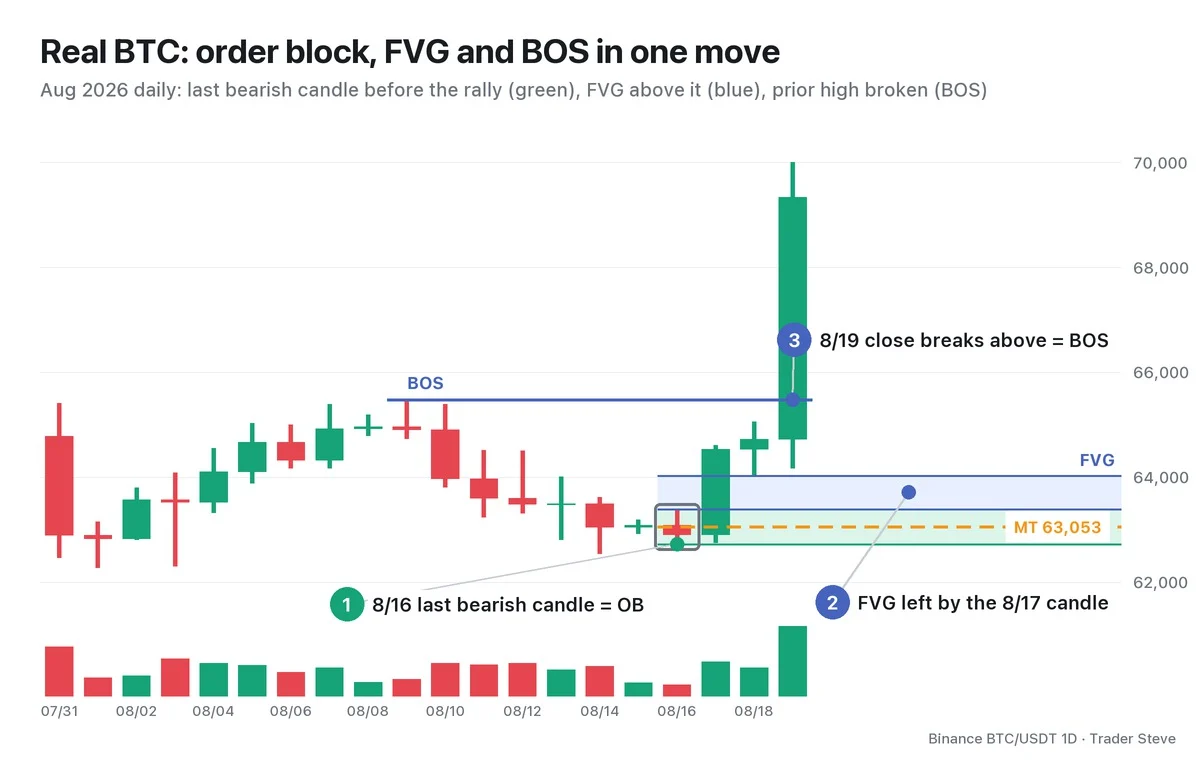
- ① Order block: the Aug 16 daily candle is the last bearish candle before the surge. Its range is 62,716–63,390, and its midpoint (MT) is 63,053.
- ② Fair value gap (FVG): the next day, Aug 17, a large bullish candle left an empty price range at 63,390–64,028. The bottom edge of the FVG is exactly the order block's high, 63,390. The FVG formed directly on top of the order block.
- ③ Break of structure (BOS): the Aug 19 close of 69,335 cleared the Aug 9 swing high of 65,474. From the order block's close to the breakout close, price gained about 10.2% in three days.
This rally left three more daily FVGs on Aug 19–21. In other words, the order block is where the move started, the FVG is the empty zone the move passed through, and the BOS is the confirmation that the move changed structure. All three are the same event seen from different angles. The gaps left by this surge are covered in ICT FVG (related lesson), and the break of structure in ICT BOS and CHoCH (related lesson).
What happened to this order block afterward? From Aug 20, the day after the breakout, through Oct 24, the daily low never once dropped below 68,902. That is about 8.7% above the top of the order block. It remains what's called a fresh order block — one that has not yet been mitigated even once. That is only the record so far; it does not mean price will come back to that zone.
Key Takeaways
- An order block is the last opposite-direction candle before a strong move that breaks structure, and its range runs from that candle's high to its low.
- A bullish OB is the last bearish candle before a surge; a bearish OB is the last bullish candle before a sharp drop.
- Because it is where big orders piled in and where the side that pushed price holds its average entry, price often comes back to touch it (mitigation).
- It is a place price may revisit, not a confirmed signal. Price often slices straight through it or never returns at all.
- An order block, an FVG and a BOS are traces left together by the same strong move.
In Part 2, we'll cover the exact conditions for identifying an order block on a chart, how to draw it, and the criteria for the mean threshold (MT) and mitigation.
Finding and drawing order blocks, FVGs and breaks of structure by hand for every market takes real time. If you want these key zones laid out for each market in one analysis, see the Omnisight Report below.
This lesson adapts the text, figures and live-stream quotes of the Trader Steve TA series for the web, translated from the original Korean. Check the text and figure captions for the timing and interpretation of each real example, and read conceptual diagrams and real charts separately.
Corrections: support@omnisight.report


