
What Are NWOG and NDOG? ICT Opening Gaps and the Midnight Open
Historical examples for learning · not current prices or trade recommendations.
Contents
The fair value gap (FVG) I covered earlier was an empty space between three candles. The gaps in this topic come from somewhere else. They are left not by candles but by the hours a market is closed. This lesson uses charts to explain what the new week opening gap (NWOG), the new day opening gap (NDOG) and the midnight open are, why they form, and how to read them in crypto, which trades 24 hours a day.
1. Three One-Line Definitions
ICT uses three "reference lines made by time."
| Name | Full name (abbreviation) | One-line definition |
|---|---|---|
| Weekly opening gap | New Week Opening Gap (NWOG) | The price range between Friday's 17:00 close and Sunday's 18:00 open (New York time) |
| Daily opening gap | New Day Opening Gap (NDOG) | The price range between a weekday's 17:00 close and the 18:00 open |
| Midnight open | New York Midnight Open | The open of the first candle at 00:00 New York time |
All of these times are New York time (ET) because the concepts come from the trading hours of US index futures. In Korea Standard Time (KST, UTC+9), during US daylight saving time (through Nov 1), Friday 17:00 ET is Saturday 06:00 KST, Sunday 18:00 ET is Monday 07:00 KST, and the midnight open is 13:00 KST. From November, every one of these moves one hour later (the midnight open becomes 14:00 KST). Part 2 has the full conversion table.
Just as with an FVG, the exact midpoint of the gap is called consequent encroachment (CE), the gap's 50% level, and gets its own line.
2. Why They Form: The Market Closes
Stocks and index futures have hours when they don't trade. US index futures close at 17:00 ET on Friday and reopen at 18:00 ET on Sunday. The world keeps moving in between. News breaks, other markets move, and people change their minds. But the exchange is closed, so price stays frozen until the moment it reopens, and then all of that changed opinion hits at once. That is why Sunday's first open starts somewhere other than Friday's close, leaving behind a price range where nobody could trade. That range is the NWOG.
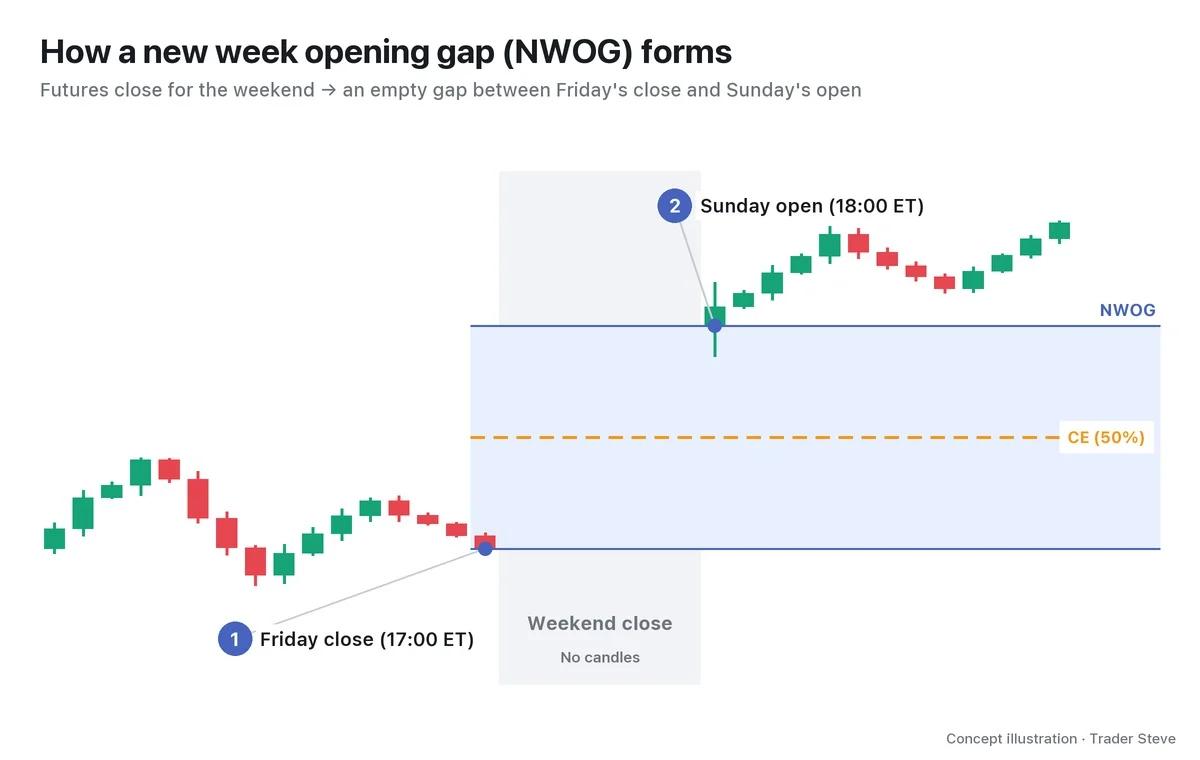
On the live stream, looking at a stock chart while the market was closed, I put it this way:
"Once the stock market hits its close for the day, no more candles print after that, right? So the stocks all show up frozen exactly where they stopped." — Trader Steve, live stream, Oct 18, 2026 (translated from Korean) · ▶ Watch the stream highlights (Korean audio)
When that "frozen time" is long, you get a weekly gap; when it is short, a daily gap. US index futures also take a one-hour break every weekday from 17:00 to 18:00 ET. The empty space that hour leaves behind is the NDOG.
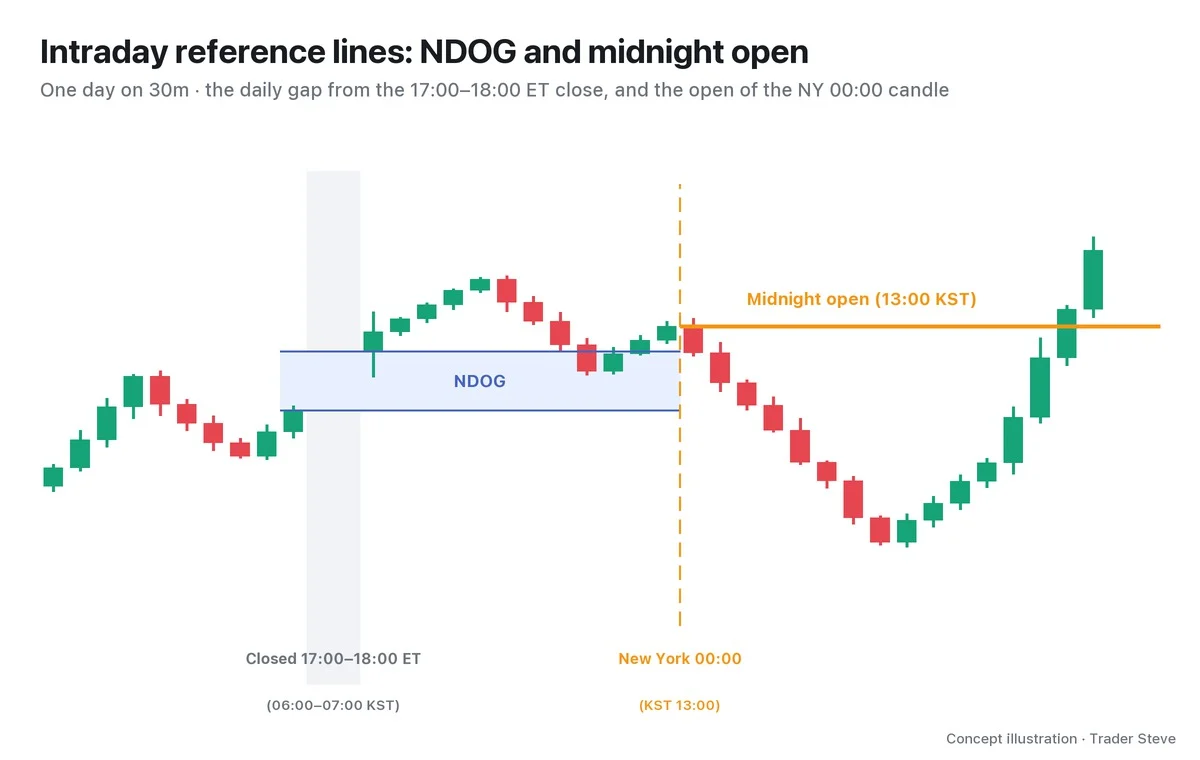
The midnight open is not a gap, but it belongs to the same family of reference lines. ICT treats 00:00 New York time as "the real start of the day" and draws a horizontal line at the open of that first candle. If price is above the line, it is on the expensive side for that day (premium); if it is below, it is on the cheap side (discount). Part 3 covers how to use it.
3. But Crypto Never Closes: Proxy Opening Gaps
That raises a question. Bitcoin (BTC) trades on weekends and in the middle of the night. Its candles never stop, so there is no true gap in crypto spot markets. On a Binance chart, there is no empty space between Friday's last candle and Sunday's first candle.
So in this series I apply the same clock ICT uses (New York time) to Binance spot. I take the price at 17:00 ET on Friday and the price at 18:00 ET on Sunday and draw a box between them. In other words, I treat how far crypto moved while traditional markets were closed as the gap. Just remember that this is a proxy, not a true empty space.
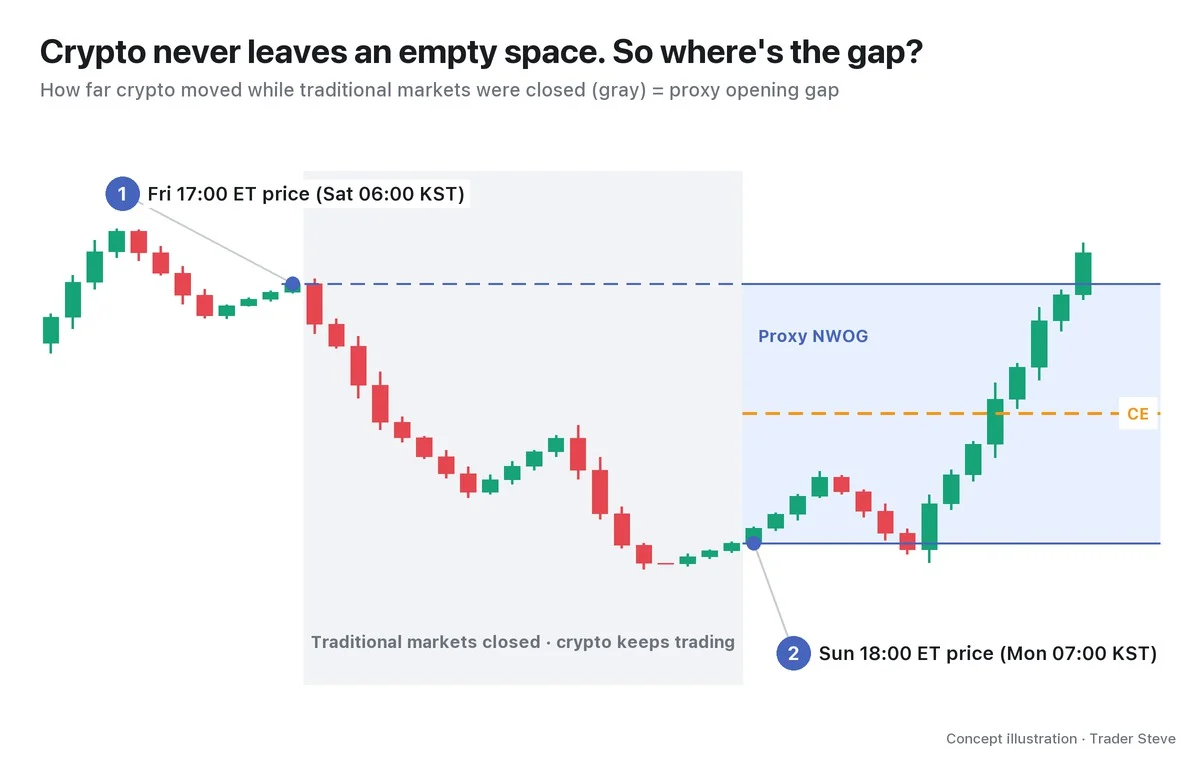
The familiar "CME gap" is the crypto version of this idea. CME Bitcoin futures traditionally closed for the weekend and for an hour each weekday, so their chart had true empty spaces. Here is how I described crypto moving on its own over a weekend:
"The dramatic moves really only happened in the RWA tokens, right? The stock market was closed and it only moved in the night market (…) the actual stock's chart is frozen, because the market hasn't opened." — Trader Steve, live stream, Oct 19, 2026 (translated from Korean) · ▶ Watch the stream highlights (Korean audio)
RWA (real-world asset tokenization) covers a wide range of real assets, not just stocks but also bonds, real estate and more. The RWA discussed on the stream refers specifically to token products that track stock prices, and the "night market" is overnight trading in US stocks. The point is that the original market was frozen while only the 24-hour market moved, and the opening-gap view asks how that difference gets resolved when the market reopens on Monday.
To be honest, NDOGs in crypto are so small they are almost meaningless. They measure one weekday hour of movement, so most are around 0.2%. In crypto, the NWOG and the midnight open are the main characters; for the NDOG, knowing the definition is enough.
4. Why They Matter: The Starting Point Stays on the Chart
Opening gaps and the midnight open are a record of "where price started that week or that day." Because the starting point stays on the chart, you can see whether price is now above or below it, and whether it comes back to it.
Measured on the Binance BTC 1-hour chart over 33 weekends from March to October 2026, price returned to Friday's close before 17:00 ET on the Friday of that same week in 30 of 33 weeks (31 weeks reached CE). That said, the median gap size was only 0.9%, so part of that is simply that small gaps are easy to fill, and the 3 weeks that never came back were all weeks that ran hard in the direction of the gap. Part 2 looks closely at how to read these statistics. An opening gap is a map, not a signal.
5. Real BTC: A Week With a 3.77% Bearish Gap
Let's look at the largest weekend gap of the period.
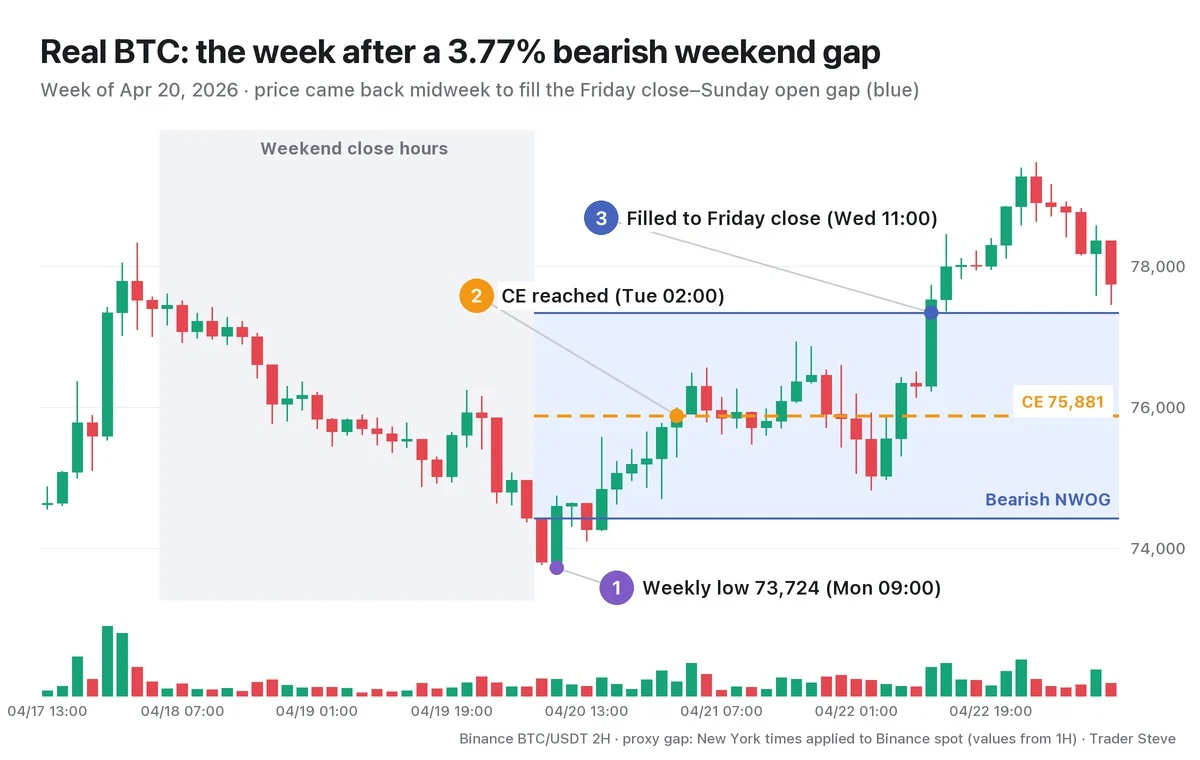
- Price at Friday 17:00 ET (Saturday, Apr 18, 06:00 KST): 77,338
- Price at Sunday 18:00 ET (Monday, Apr 20, 07:00 KST): 74,425
- Bearish NWOG 74,425–77,338 (3.77%), CE 75,881
The week opened 3.77% lower after the weekend, and the Monday 09:00 KST candle set ① the weekly low of 73,724, 0.94% below Sunday's open. Then ② the Tuesday 02:00 candle reached CE, and ③ the Wednesday 11:00 candle climbed all the way back to Friday's close, filling the gap completely. After that, price rose to the weekly high of 79,473 on the Thursday 01:00 candle.
The lesson here is not "the call was right" but where the reference lines were. The top, bottom and midpoint of the empty space left over the weekend served all week as places where price paused and broke through. There are also weeks when price simply runs off in the direction of the gap, and Part 5 shows real examples of those.
Key Takeaways
- An FVG is an empty space made by candles; an opening gap is an empty space made by the hours a market is closed.
- The NWOG is the price range left by the closure from Fri 17:00 to Sun 18:00 ET; the NDOG is the range left by the weekday 17:00–18:00 ET closure.
- The midnight open is the open of the first candle at New York 00:00 (13:00 KST; 14:00 KST from November) and marks the day's starting point.
- Crypto spot has no true gaps, so I use proxy gaps measured at the same clock times.
- Price often returns to the starting point, but that is not a confirmed signal. Use it as a map.
In Part 2, we'll cover a Korea Standard Time conversion table and how to draw the NWOG, NDOG and midnight open precisely on a chart. If measuring and drawing these reference lines by hand for every market is a chore, the Omnisight Report below does that work for you.
This lesson adapts the text, figures and live-stream quotes of the Trader Steve TA series for the web, translated from the original Korean. Check the text and figure captions for the timing and interpretation of each real example, and read conceptual diagrams and real charts separately.
Corrections: support@omnisight.report


