
What Is Optimal Trade Entry (OTE)? The ICT 62–79% Entry Zone Explained
Historical examples for learning · not current prices or trade recommendations.
Contents
When a chart has rallied hard, the question is always the same: how deep does the pullback need to go before it's worth buying? ICT answers that with a single zone and calls it the optimal trade entry (OTE). This lesson uses diagrams and a real Bitcoin daily chart to show what OTE is, why the zone is 62–79%, and why it earned the name "optimal."
1. The One-Line Definition: A 62–79% Retracement of a Strong Leg
OTE is the price zone where a strong move (a leg) has retraced 62–79% of its length.
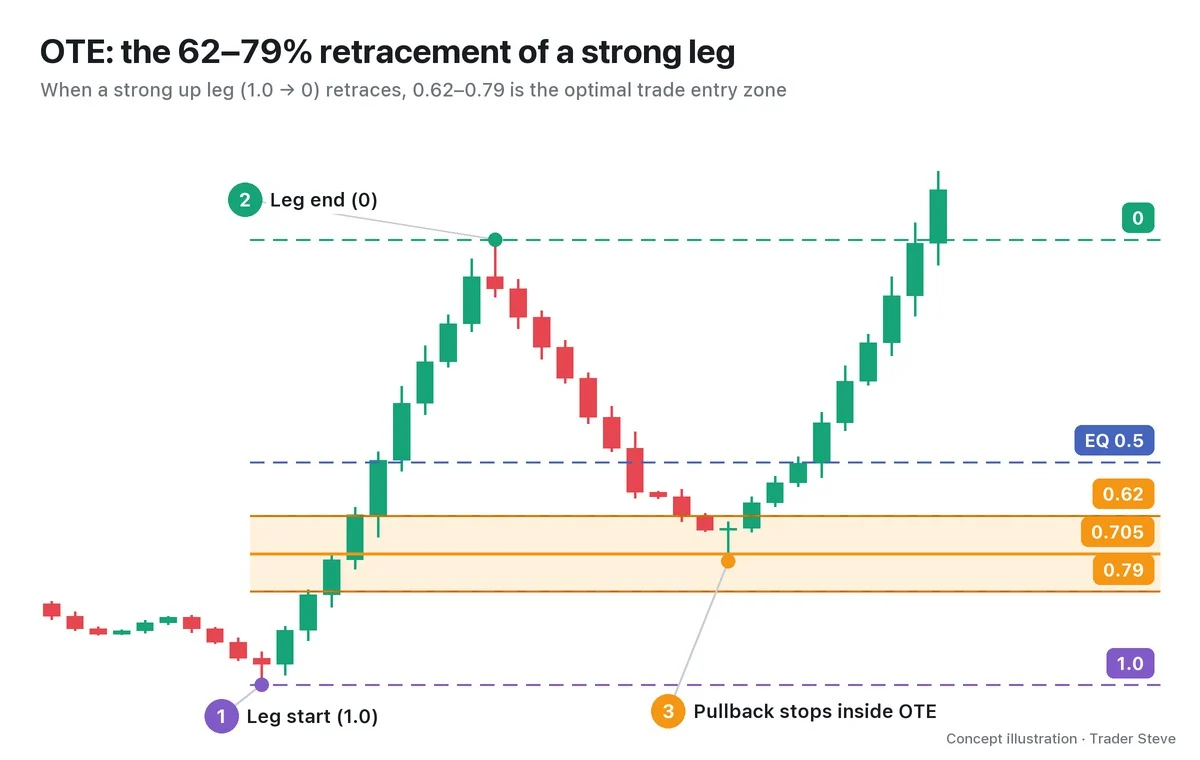
Drawing it is simple.
- ① Leg start (1.0): the wick tip of the low where the rally began
- ② Leg end (0): the wick tip of the high where that rally stopped
- ③ OTE: the zone 0.62–0.79 of the leg below the high
For an up leg, the level 62% of the leg's length below the high is the upper threshold of the zone, and the level 79% below the high is its floor. The picture OTE is looking for is the one in the diagram: the pullback stops inside this zone and price goes on to break above the high again.
2. Three Numbers: 0.62 · 0.705 · 0.79
OTE is built from just three numbers.
| Ratio | Name | Meaning |
|---|---|---|
| 0.62 | Threshold of the zone | From here, price counts as inside the OTE |
| 0.705 | Sweet spot | Exactly halfway between 0.62 and 0.79; the reference line ICT uses most |
| 0.79 | Floor of the zone | Any deeper and price is getting close to the leg start (1.0) |
If you've used Fibonacci retracements, 0.618 and 0.786 probably come to mind first. ICT rounds those two to 0.62 and 0.79. The difference is less than one percentage point, and because OTE is treated as a zone, not a single line, it makes almost no difference in practice. Where these ratios come from is covered in the Fibonacci retracement and extension lesson of the Basics series.
3. Why "Optimal": Cheap, Close to the Stop, and Where Orders Sit
There are three reasons the zone is called "optimal."
(1) It is the deep end of the discount. Split the leg in half at 50%, and that middle price is called equilibrium (EQ). Above EQ is the expensive side of the leg (premium); below it is the cheap side (discount). A bullish OTE sits at 62–79%, deeper than EQ inside the discount, so it is among the cheapest places to buy relative to that leg.
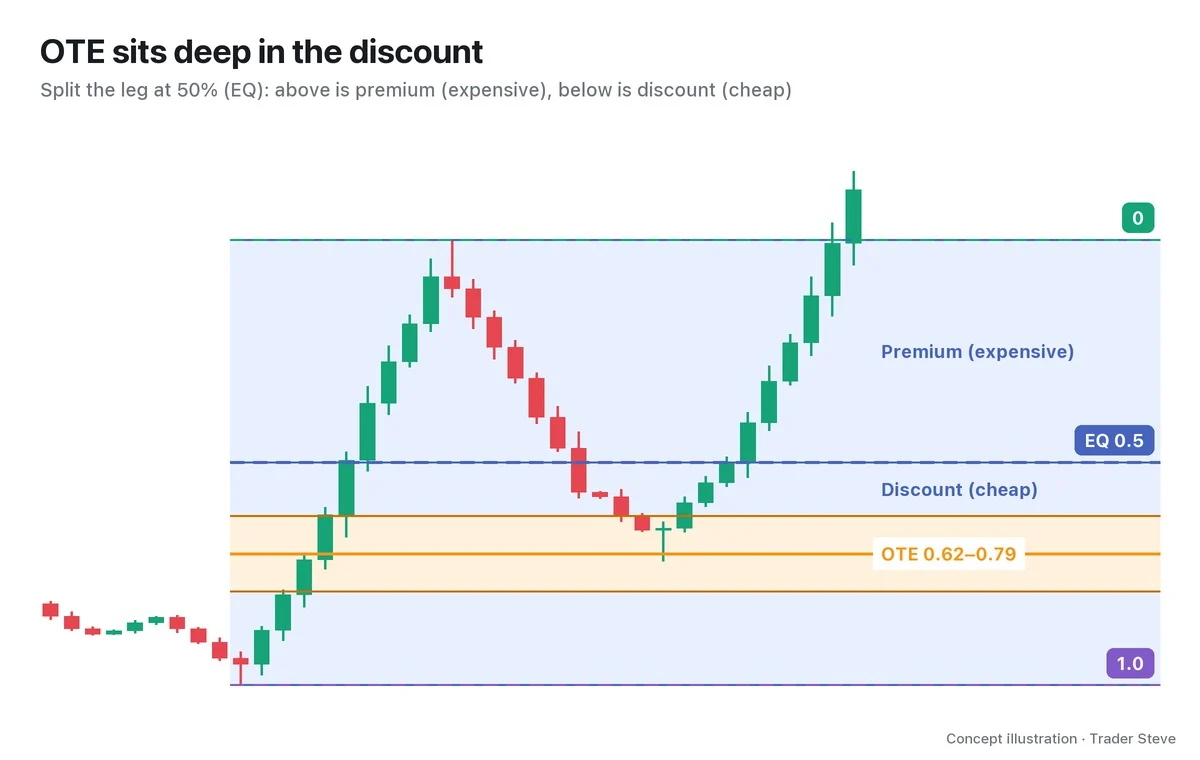
The 50% line itself and how to use premium and discount are covered separately in the Premium and Discount lesson of the ICT series.
(2) The stop reference is close, so the risk-to-reward ratio is large. If the leg start (1.0) breaks, any scenario built on that leg is wrong. Enter at 0.705 and you are 0.295 of the leg's length from 1.0 and 0.705 from the prior high (0). Even with the target only at the prior high, the trade pays 2.39R (1R is the distance from entry to the stop), and that ratio is the same on any leg you draw. Part 3 goes through how to split entries, stops and targets in detail.
(3) It is the depth where many traders give up, and where orders sit. By the time price has pulled back 62–79%, most people who chased near the high are underwater. For anyone who was waiting for this depth from the start, it is the best price available. Here is how I described this level while looking at the KOSPI chart (Korea's main stock index).
"It's the 0.705 line, measured on the retracement of the whole rally. Uncanny, right? The idea is that the most ideal entry point can land all the way down at a level like this." — Trader Steve, live stream, Oct 18, 2026 (translated from Korean) · ▶ Watch the stream highlights (Korean audio)
The ratio doesn't work magic. I think it matters because past trading has often built up at that depth.
"With things like Fibonacci lines, the point isn't that price will move exactly along them — it's that they're worth checking. … What kind of levels are those lines? They're all levels where a high-volume zone is sitting. This area that's inside the so-called OTE line — that's why ICT is so popular. Because it makes sense." — Trader Steve, live stream, Sep 13, 2026 (translated from Korean) · ▶ Watch the stream highlights (Korean audio)
4. Bullish and Bearish OTE: Flip It Like a Mirror
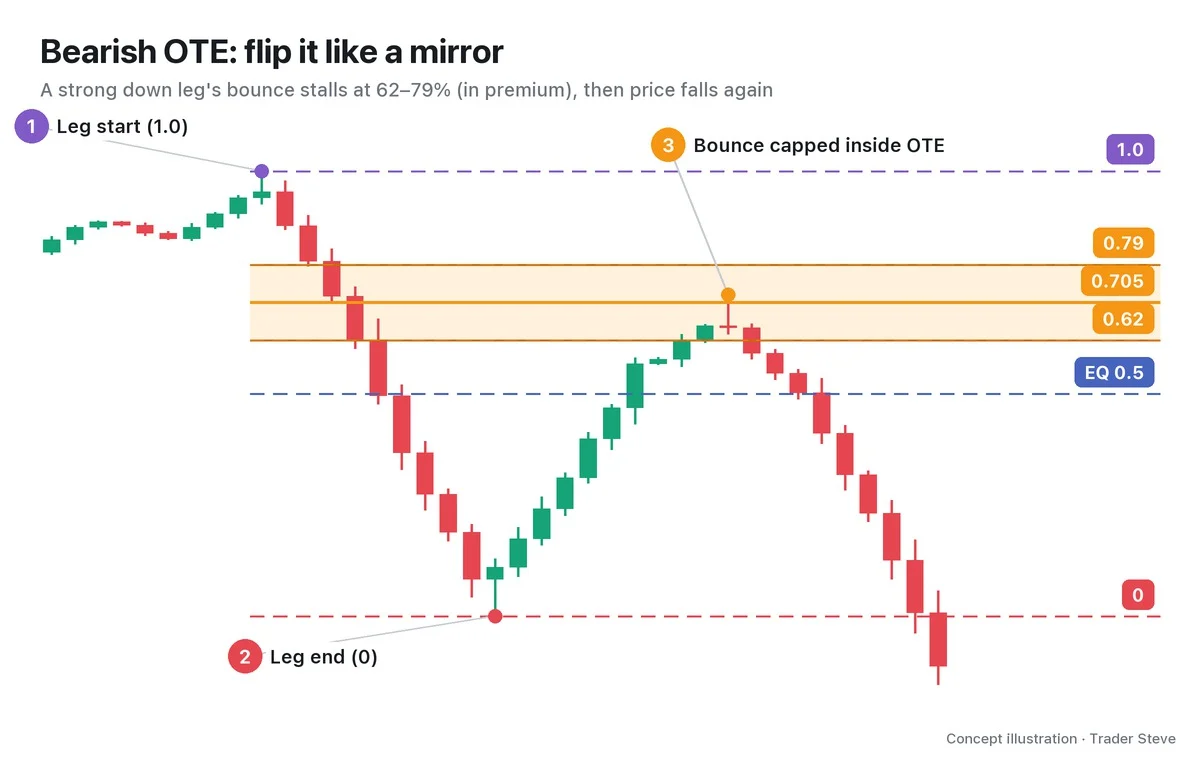
OTE works the same way for shorts. Just flip the picture upside down.
| Type | Leg start (1.0) | Leg end (0) | Where the OTE is |
|---|---|---|---|
| Bullish OTE | Low | High | 62–79% below the high, inside the discount |
| Bearish OTE | High | Low | 62–79% above the low, inside the premium |
In a bearish OTE, you watch for the bounce after a big drop to climb 62–79% of the leg. You are selling on the expensive side of the leg — and at its deep end. The stop reference goes above the high that started the leg (1.0).
5. A Real Bitcoin Daily Chart: The Pullback That Stopped at 0.731
Let's check it on a real chart. This leg runs from the Feb 24, 2026 daily low of 62,510 to the Mar 4 high of 74,050, a rise of about 18.5%. Because the leg broke above the prior high on its way up, it makes a good set of anchor points.
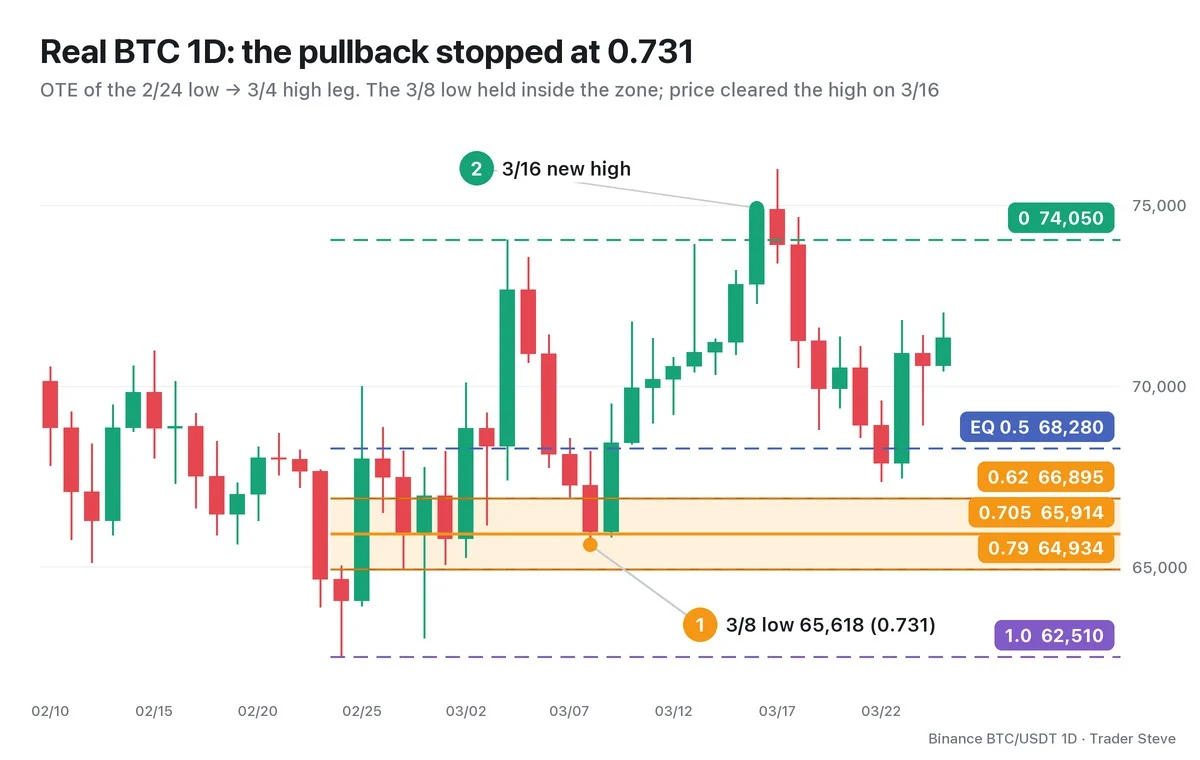
Applying the ratios to this leg puts EQ (0.5) at 68,280 and the OTE at 0.62 = 66,895, 0.705 = 65,914, 0.79 = 64,934.
- On Mar 6, the pullback dropped below EQ and entered the discount.
- ① Mar 8: price passed 0.62 and then 0.705 and printed a low of 65,618. As a ratio that is 0.731, slightly deeper than the middle of the OTE, and it did not reach 0.79.
- ② Mar 16: a high of 74,909 took out the leg end (74,050) again, and the next day price reached 76,000.
Measured from 0.705 on this leg, the distance to 1.0 is 3,404 and the distance to the prior high is 8,136, which gives exactly the 2.39R mentioned above. Once the zone is defined by ratios, the prices change but the math stays the same.
That said, this chart shows a result after it had already worked. On Mar 8 itself, nobody could know whether the pullback would stop at 0.731 or break 1.0 and keep falling. OTE only tells you where to wait; it doesn't promise a bounce.
"When it gets hit hard … the retracement comes in roughly between the 0.705 line and the 0.79 line. … You wait for this area. Because this is a candidate for a good long entry. It's not that it's going to hand you this level…" — Trader Steve, live stream, Aug 26, 2026 (translated from Korean) · ▶ Watch the stream highlights (Korean audio)
The key word is "candidate." That is why OTE isn't drawn on just any leg. In Part 2, we'll go step by step through the conditions that qualify a leg as a reference — a liquidity sweep, displacement and a market structure shift (MSS).
Key Takeaways
- OTE is the 62–79% retracement of a strong leg, and the 0.705 level in the middle is the sweet spot.
- ICT uses 0.62 and 0.79 instead of 0.618 and 0.786, and treats them as a zone, not a line.
- A bullish OTE sits at the deep end of the discount; a bearish OTE sits at the deep end of the premium.
- Enter at 0.705, use 1.0 as the stop reference and target the prior high, and the trade pays 2.39R on any leg.
- It is a place to wait, not a confirmed signal. If 1.0 breaks, the scenario for that leg is over.
In Part 2, we'll cover the sequence to confirm before drawing an OTE (sweep → displacement → market structure shift), how to choose the anchor points, and a checklist.
This lesson adapts the text, figures and live-stream quotes of the Trader Steve TA series for the web, translated from the original Korean. Check the text and figure captions for the timing and interpretation of each real example, and read conceptual diagrams and real charts separately.
Corrections: support@omnisight.report


