
What Is a PD Array? Meaning and the PD Array Matrix at a Glance
Historical examples for learning · not current prices or trade recommendations.
Contents
Some charts are crowded with reasons to trade: fair value gaps (FVGs), order blocks, old highs, breaker blocks. When everything looks important, you need a table that tells you what to look at first. That table is the premium/discount (PD) array matrix. This lesson covers what a PD array is, what the matrix looks like, and why price is thought to travel between the levels on that list.
1. The One-Line Definition: A List of Price Zones Split Into Premium and Discount
A premium & discount array (PD array) is a list of reference price zones where price is likely to react. Break the name apart and the meaning is clear.
- PD = premium and discount: the upper half and the lower half of a range (swing low to swing high).
- Array = a list. Places where price can react, such as order blocks, FVGs and old highs, lined up in order.
The exact middle of the range, (high + low) / 2, is called equilibrium (EQ). An array above EQ sits in the expensive half, so it counts as evidence for selling (a premium array). An array below EQ sits in the cheap half, so it counts as evidence for buying (a discount array). How to choose the range and EQ is covered separately in the ICT premium and discount topic.
2. My Take: Support and Resistance With a New Name
The name makes it sound like a brand-new technique, but here is what I once said on the live stream.
"ICT gets used a lot because the names sound cool, and I look at it too. … What ICT calls a PD array — that's just support and resistance, isn't it? Give support and resistance a cool name and it becomes a PD array." — Trader Steve, live stream, Aug 31, 2026 (translated from Korean) · ▶ Watch this moment (Short, Korean audio)
This isn't meant to put it down. In the same moment I added that the logic underneath is sound. The point is that a PD array is still support and resistance analysis: it asks where price will be held up and where it will be blocked. What it adds is that the support and resistance candidates are sorted by which half of the range they sit in, then made into a list and put in order. That list is the matrix.
3. The Matrix at a Glance: Seven Above EQ, Seven Below
The PD array matrix puts EQ in the middle, with seven premium arrays stacked above it and seven discount arrays stacked below it. This series uses the following order as its reference table.
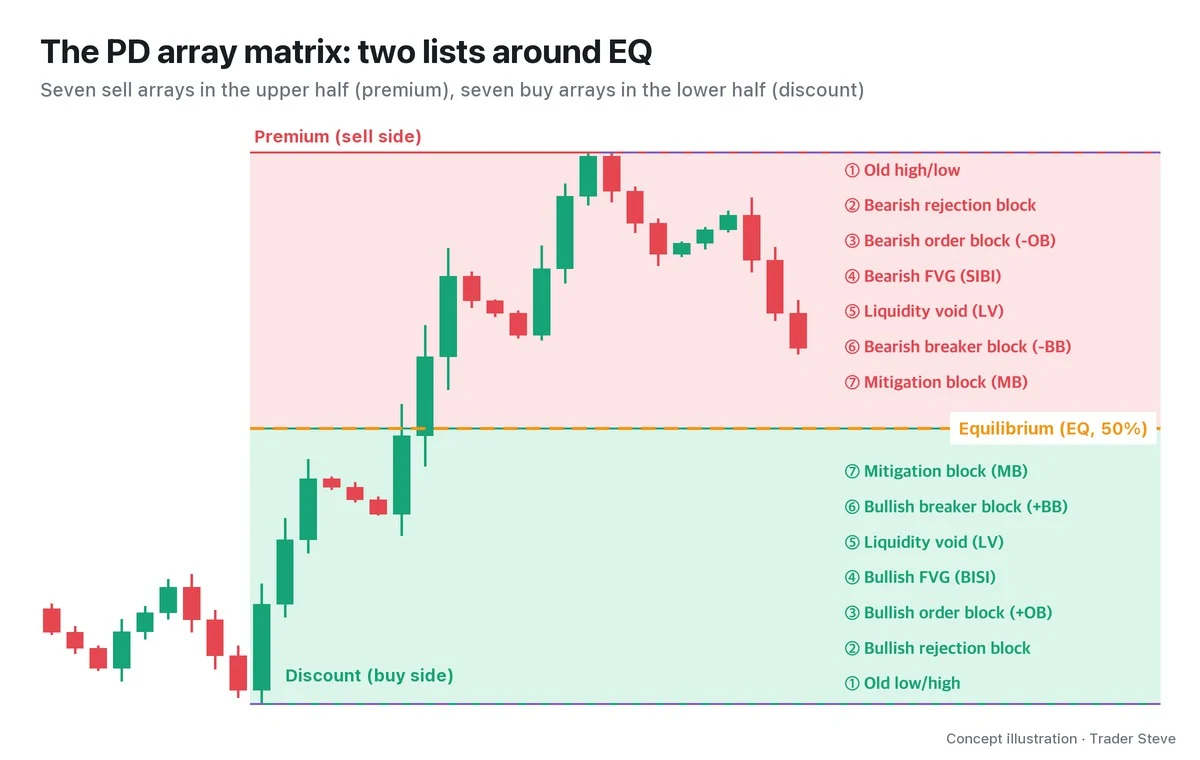
| No. | Premium (above EQ, sell side) | Discount (below EQ, buy side) |
|---|---|---|
| ① outermost | Old high/low | Old low/high |
| ② | Bearish rejection block (RB) | Bullish rejection block |
| ③ | Bearish order block (-OB) | Bullish order block (+OB) |
| ④ | Bearish FVG (SIBI: sell-side imbalance, buy-side inefficiency) | Bullish FVG (BISI: buy-side imbalance, sell-side inefficiency) |
| ⑤ | Liquidity void (LV) | Liquidity void |
| ⑥ | Bearish breaker block (-BB) | Bullish breaker block |
| ⑦ innermost | Mitigation block (MB) | Mitigation block |
Part 2 explains what each cell means and how to draw it. For now, take away just two things.
- Buys come only from the lower-half list, sells only from the upper-half list. A bullish order block in the upper half is "evidence for buying somewhere that isn't cheap."
- The ① to ⑦ order is not a strength ranking. It is closer to the order in which a pullback meets the arrays on its way down (or up). Inner arrays are reached first; outer arrays offer a better risk-to-reward ratio but price may never get there.
4. Why They Line Up in This Order: What One Leg Leaves Behind
One bullish leg is enough to see why the order looks the way it does.
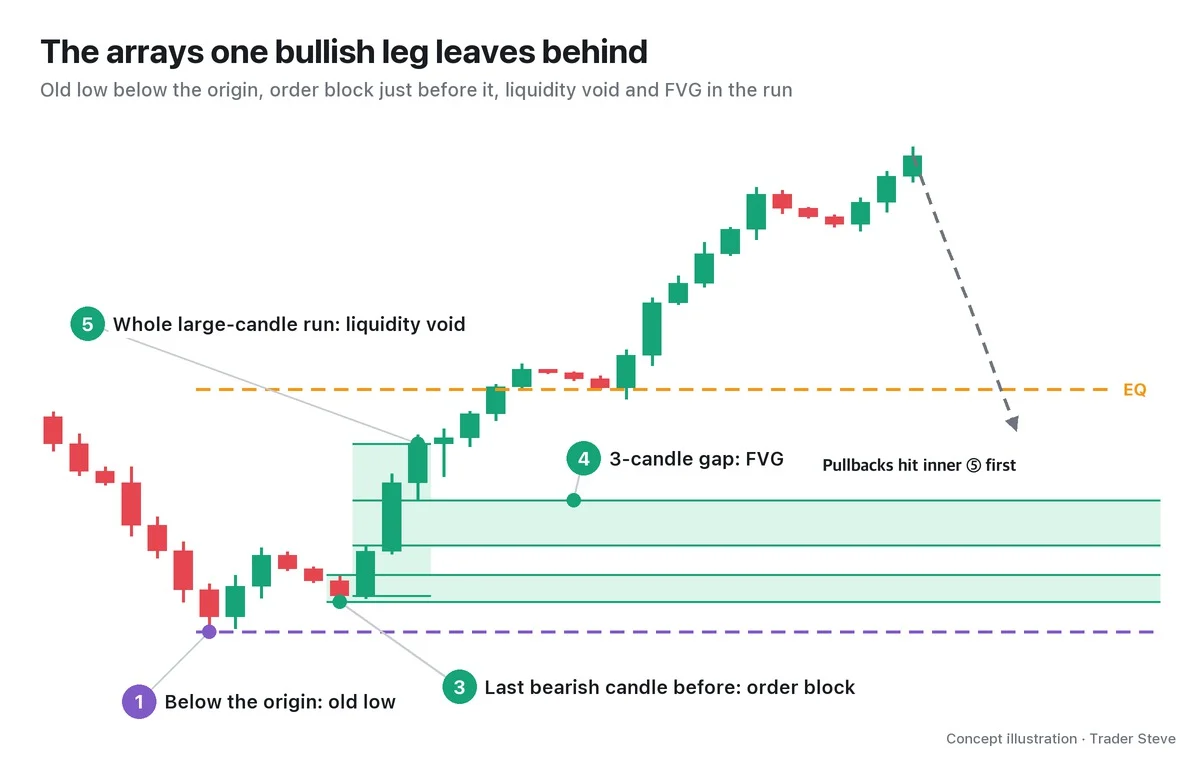
When price rallies hard off a low, several zones form at once. Below the origin sits the old low (①), where stop orders pile up, and the last bearish candle before the move becomes the order block (③). The whole stretch covered by back-to-back large bullish candles is a liquidity void (⑤), and any place inside it where three candles leave a gap is an FVG (④).
The higher these zones sit, the closer they are to EQ. So a pullback usually meets the inner ones (liquidity void, FVG) first, and has to drop further to reach the order block and the old low. That is why the numbers run from outer to inner. It is the same idea behind my comment that I look at FVGs before order blocks (FVG Part 5).
5. Price Moves From Array to Array
ICT uses the term Interbank Price Delivery Algorithm (IPDA) to describe price being "delivered" back and forth between the levels on this list. The core idea is that price that reacts at one array heads for the next array on the opposite side.
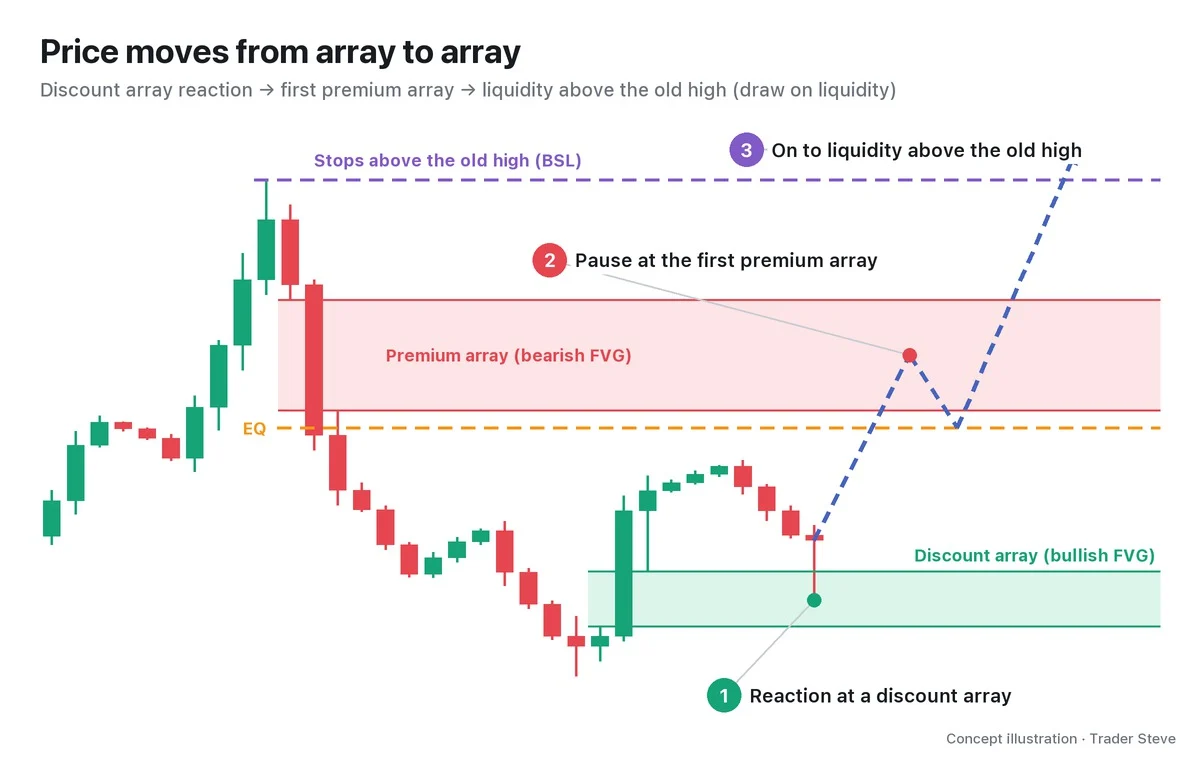
Zones inside the range, such as FVGs, are called internal range liquidity (IRL). The stop orders beyond the highs and lows at the edges of the range are external range liquidity (ERL). The liquidity price is heading toward is the draw on liquidity (DOL). The backbone of this explanation is that price travels back and forth between IRL and ERL.
The path in the illustration is only an assumption; price can just as easily turn at the first premium array. The matrix does not tell you "where price will go." It is a table that writes down in advance "what price will meet along the way."
6. A First Look at Real BTC: The First Premium Array the Bounce Met
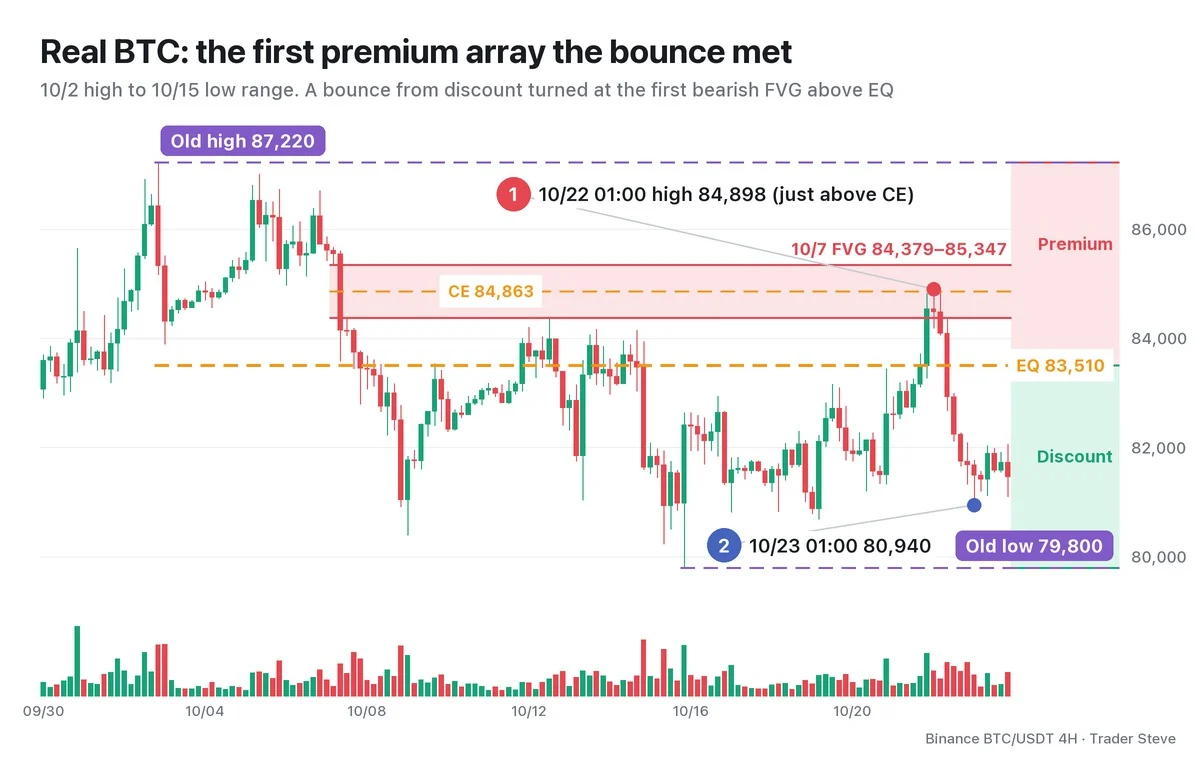
All dates and times are Korea Standard Time (KST, UTC+9). The range from the Oct 2 21:00 high of 87,220 to the Oct 15 21:00 low of 79,800 has an EQ of 83,510. As of the morning of Oct 21, the closest untouched array above EQ was the bearish FVG left by the Oct 7 09:00 candle, 84,379–85,347, with its exact midpoint, the consequent encroachment (CE), at 84,863.
The bounce that started in discount reached this FVG on the Oct 21 21:00 candle and stopped at the Oct 22 01:00 candle's high of 84,898: $35 past the CE, at 68.7% of the range. Price then fell about 4.7%, to 80,939.54 on the Oct 23 01:00 candle. Neither the top of the FVG (85,347) nor the old high above it was touched during this period.
Just as in the illustration above, the bounce met the innermost premium array first. Part 4 covers that day's full matrix and the outcome. This is a reading of a past chart; it does not mean the same reaction will happen again.
Key Takeaways
- PD arrays are a list of price zones measured against the range's EQ: above it (premium) is evidence for selling, below it (discount) is evidence for buying.
- The matrix stacks seven arrays above and seven below, from outer (①) to inner (⑦).
- The order is not a strength ranking; it is closer to the order in which a pullback meets them. Inner arrays are reached first; outer arrays offer a better risk-to-reward ratio but price may never get there.
- Price is seen as moving from array to array, between the inside of the range (IRL) and beyond its edges (ERL).
- In the end it is support and resistance. It is not a confirmed signal but a tool for deciding what to look at first.
In Part 2, we'll go through all 14 cells of the matrix one by one and lay out five steps for building the matrix on your own chart.
Lining up this list by hand across several timeframes every time takes a while. The Omnisight Report below does that work for each market.
This lesson adapts the text, figures and live-stream quotes of the Trader Steve TA series for the web, translated from the original Korean. Check the text and figure captions for the timing and interpretation of each real example, and read conceptual diagrams and real charts separately.
Corrections: support@omnisight.report


