
What Is Power of 3 (PO3)? Accumulation, Manipulation, Distribution
Historical examples for learning · not current prices or trade recommendations.
Contents
A daily candle comes down to four numbers — open, high, low and close — but unfold it into 1-hour candles and you can see the order in which price moved. ICT describes that order with a framework called Power of 3 (PO3), often called AMD (accumulation–manipulation–distribution). This lesson uses charts to explain what PO3 means — that a single candle is built in the order accumulation → manipulation → distribution — and why a "false move" tends to come first.
The PO3 in this series is an educational variant anchored to the UTC daily open (09:00 Korea Standard Time, KST, UTC+9). It is distinct from models that use the New York midnight open (13:00 KST under US Eastern Daylight Time (EDT), 14:00 KST under Eastern Standard Time (EST)).
1. The One-Line Definition: Three Phases Inside One Candle
PO3 is a framework that sees one candle (especially a daily candle) as being built in three phases: accumulation → manipulation → distribution.
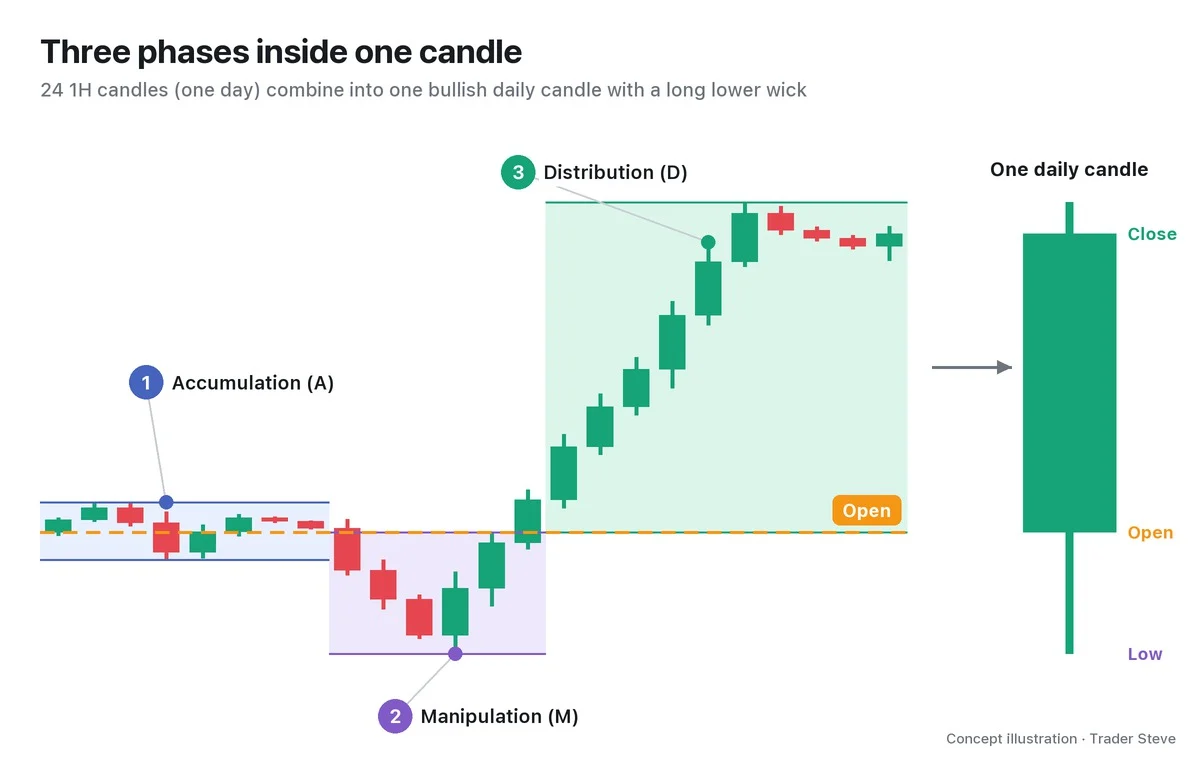
- Price trades back and forth in a narrow range near the open (accumulation).
- Price drops below the open once and sets the day's low (manipulation).
- Price returns above the open, extends sharply, and closes near the high (distribution).
That is why a bullish daily candle is drawn in the order open → low → high → close. This series calculates everything from the Binance daily open (09:00 KST). Part 2 compares it with the New York midnight open that the original ICT material uses.
2. Accumulation, Manipulation and Distribution: What Each Means
| Phase | Letter | What it looks like on the chart | Interpretation |
|---|---|---|---|
| Accumulation | A | A narrow range near the reference open | Big players build size while hiding their direction |
| Manipulation | M | A probe past the open in the direction opposite to the day's real move | A false move that uses the stop and breakout orders on the far side of the open as counterparties |
| Distribution | D | A large extension in the real direction, then the close | Size is handed off near the target as the day wraps up |
Manipulation also often goes by the name Judas swing: a false move early in a session, especially during London hours. Distribution is also called expansion. Note that it is a different concept from distribution in Wyckoff theory (the phase where size is handed off near a top). In this series, "distribution" in a PO3 context always means the ICT phase, and the Wyckoff phase is always labeled "Wyckoff distribution."
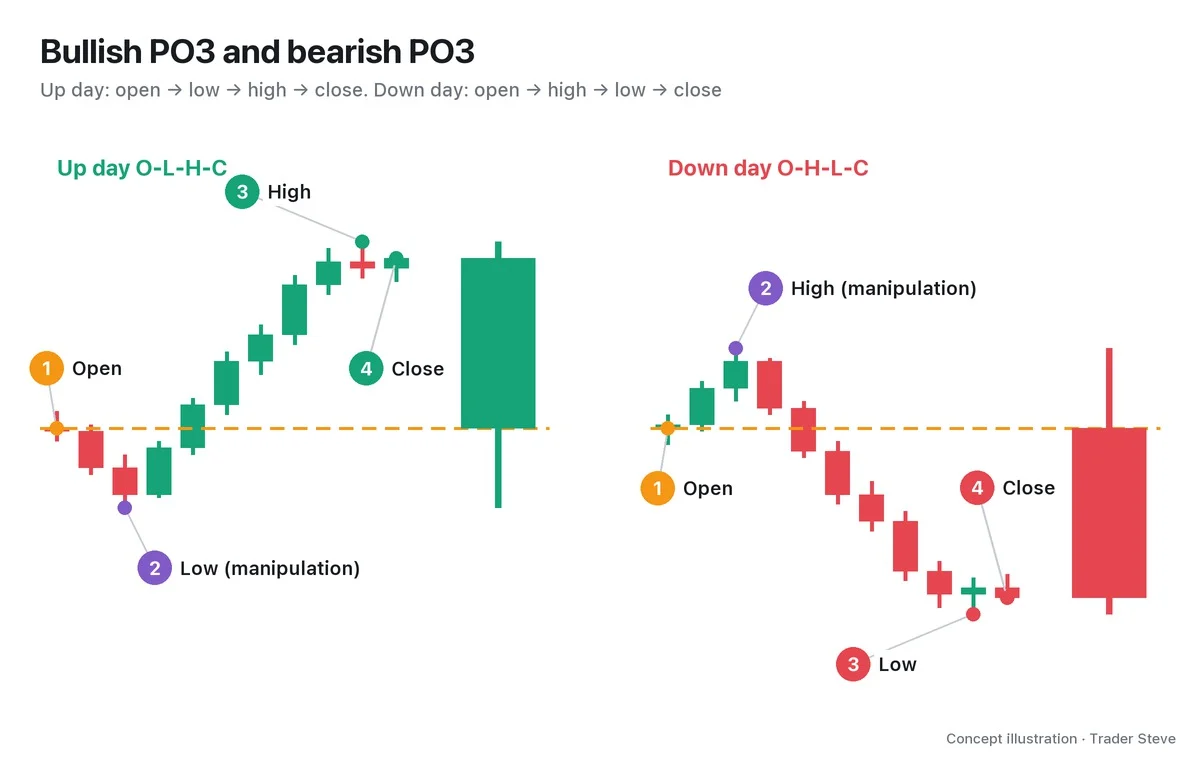
A down day is the mirror image. Price first probes above the open and sets the day's high, then extends lower and closes near the low. That makes the lower wick of an up day and the upper wick of a down day the footprints manipulation leaves behind.
One point matters here. PO3 is not a signal that tells you whether the day will go up or down. It is a framework you use after first deciding whether to expect an up day or a down day — your daily bias — to answer "then where should I get in?"
3. Why Manipulation Comes First
A large buy order only fills if there are enough sellers on the other side. Inside a quiet range there isn't much selling, so a big order would push price up before it filled.
Below a spot where several similar lows have formed, though, stop-loss orders from long positions and breakdown sell orders ("sell if the low breaks") pile up. Clusters of orders like these are liquidity. When price probes below that spot once, the sell orders pour in all at once, and the big buyer fills against exactly that supply.
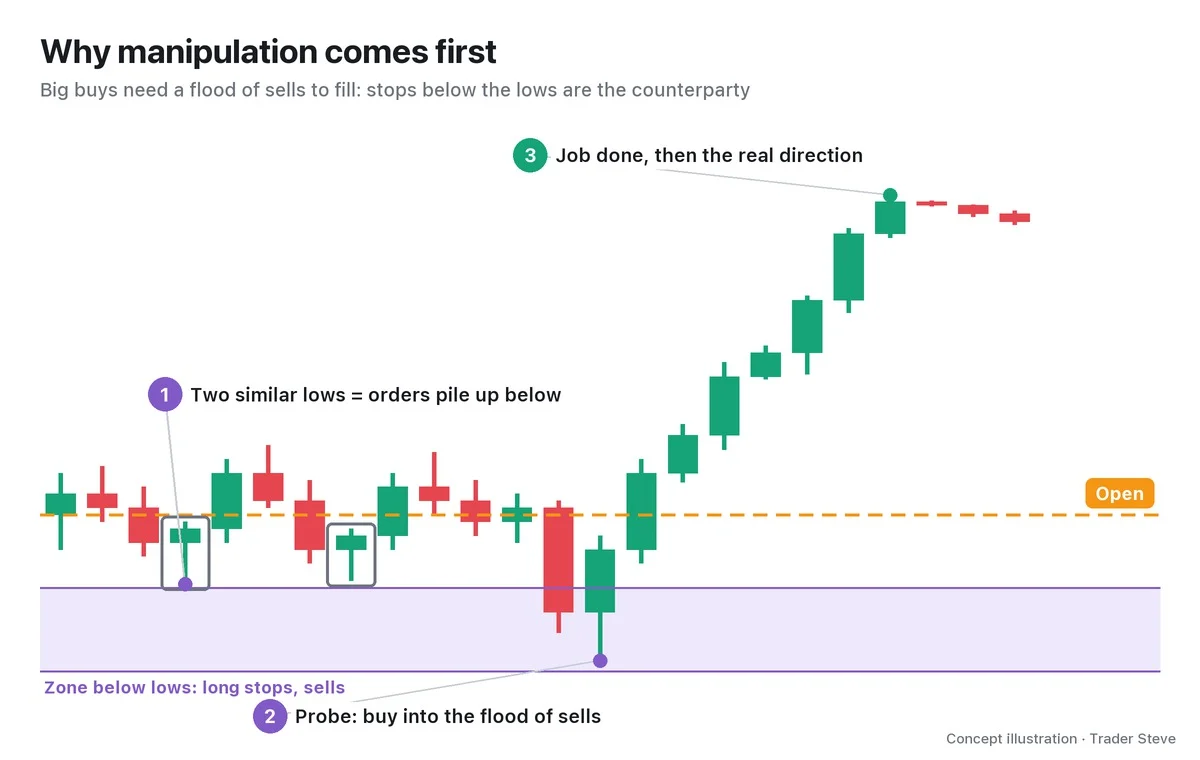
So it is more accurate to think of manipulation as a move that goes out to find counterparties than as "a move designed to fool people." I once explained this logic on a live stream while looking at the Ethereum (ETH) chart:
"They finished accumulating and lifted it, right? Lifted it by breaking the line. So why bother coming back down? The reason it bothered to come back, I think, is that they built this structure to pick up the rest — the orders they couldn't fill here — and take a bit more size with them." — Trader Steve, live stream, Oct 22, 2026 (translated from Korean) · ▶ Watch this moment (Short, Korean audio)
The reading is that price, once lifted, "bothers" to come back down in order to absorb the size left below. PO3 manipulation is read with the same logic. Why orders pile up below lows is covered in the liquidity topic (see ICT Liquidity, ict/liquidity), and the original explanation of reading a chart from the big players' point of view is covered in Wyckoff's Composite Man (see Wyckoff Composite Man, wyckoff/composite-man).
4. Spotting AMD on a Chart: Range, Probe, Expansion
When you look for AMD on a chart, you only need three things: the range near the open, the probe past one side of the range, and the expansion in the other direction.
"When you just draw the boxes like this and look at it, I get that feeling really strongly. It's AMD, AMD, right? Accumulation here, then manipulation, then distribution, and it came down — and now it's accumulating here again." — Trader Steve, live stream, Oct 20, 2026 (translated from Korean) · ▶ Watch the stream highlights (Korean audio)
A note on terms: on my live streams, "manipulation" usually means a leg where price is pushed up hard. In the quote above, too, it means "gather (accumulation) → push up (manipulation) → dump and come down (distribution)," a usage closer to Wyckoff's markup. In ICT PO3, by contrast, manipulation is a short false move that probes past the open in the direction opposite to the real move. In this series, "manipulation" always carries the ICT meaning, and the comparison table in Part 5 sums up the difference between the two uses once more.
5. A Real ETH 1-Hour Chart
Let's unfold the Ethereum (ETH) daily candle for Sep 3, 2026 into 1-hour candles.
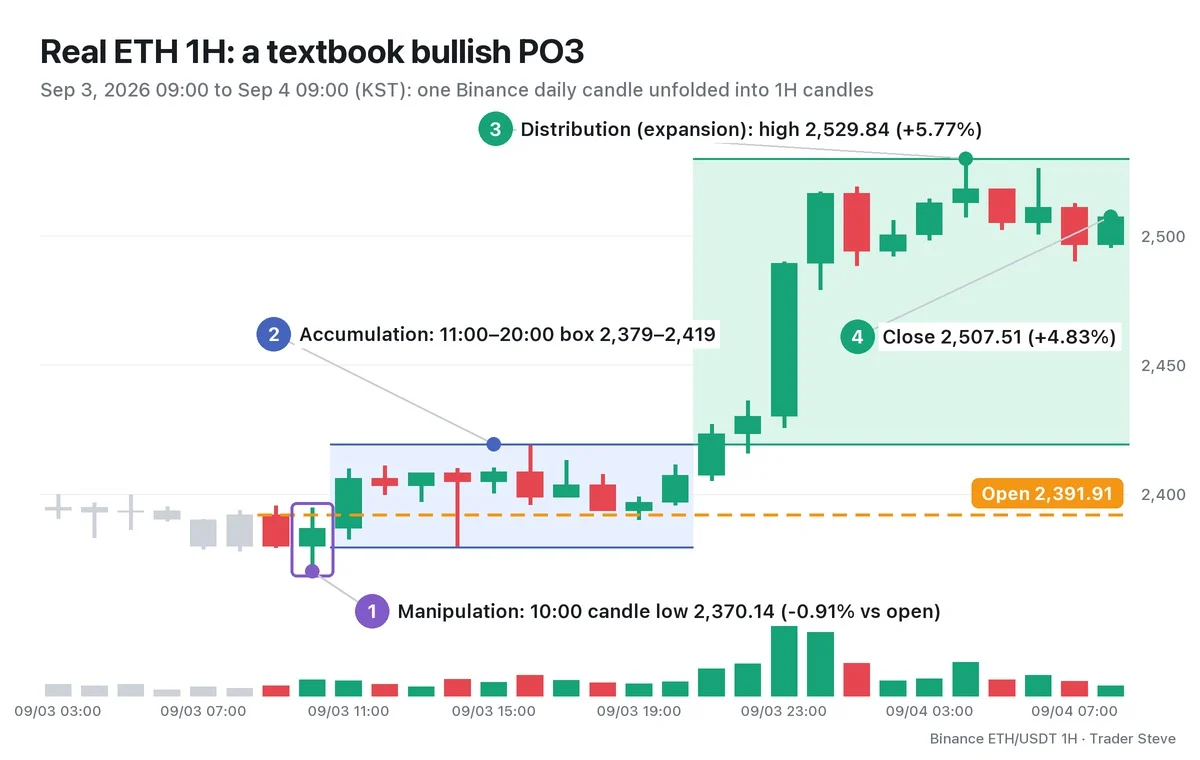
- Open: 2,391.91 at 09:00
- ① Manipulation: the 10:00 candle dropped to 2,370.14 and set the day's low, 0.91% below the open.
- ② Accumulation: for the 10 hours from 11:00 to 20:00, price stayed inside a 2,379–2,419 range. It never touched the manipulation low again.
- ③ Distribution (expansion): from the 21:00 candle (08:00 in New York), price began extending above the range, and the 23:00 candle alone carried it to a close of 2,489.46. The high came at 04:00 the next morning: 2,529.84 (+5.77% from the open).
- ④ Close: 2,507.51 (+4.83%), inside the top 14% of the day's high-to-low range — in other words, near the high.
On the daily chart it is a large bullish candle with a short lower wick, but inside it the open → low → high → close order is fully intact. Unlike the textbook order (accumulation → manipulation → distribution), however, on this day manipulation came first, right after the open, and the accumulation range followed. On real charts, many days swap or overlap the phases like this. The core is the skeleton "probe the far side of the open → return above the open → expand in the real direction," and Part 2 covers these variations.
Keep this in mind: in hindsight, almost every bullish candle looks like PO3. If a day closes up, it is natural for the low to come early. Part 2 covers the conditions under which a move counts as manipulation, and Part 5 uses a full year of data to check whether those conditions alone gave a real edge.
Key Takeaways
- PO3 (AMD) is the ICT framework that sees one candle as built in the order accumulation → manipulation → distribution.
- An up day runs open → low → high → close; a down day runs open → high → low → close. The wick is manipulation's footprint.
- Manipulation comes first because a big order needs the opposite side's orders (liquidity) as counterparties.
- The "manipulation" I talk about on stream (a hard push up) and ICT PO3 "manipulation" (a probe in the opposite direction) are different legs.
- PO3 is not a signal that tells you direction. It is a framework for choosing where to get in once you've decided the direction.
In Part 2, we'll cover which open to measure from, which hours to watch, and which conditions make a move count as manipulation, with a checklist and the common variations.
Checking the open, liquidity and structure by hand for every market, every day takes real time. If you want this kind of zone compiled per market in one place, see the Omnisight Report below.
This lesson adapts the text, figures and live-stream quotes of the Trader Steve TA series for the web, translated from the original Korean. Check the text and figure captions for the timing and interpretation of each real example, and read conceptual diagrams and real charts separately.
Corrections: support@omnisight.report


