
What Are Premium and Discount in ICT? The 50% Equilibrium Explained
Historical examples for learning · not current prices or trade recommendations.
Contents
Even in the same uptrend, your risk-to-reward ratio depends on where you bought. ICT splits the range price is trading in down the middle into the expensive upper half (premium) and the cheap lower half (discount), and uses the boundary between them, equilibrium (50%), to pick entry locations. This lesson uses charts to explain what the three terms mean, why the line sits at exactly 50%, and how you use it differently depending on direction.
1. The One-Line Definition: Split the Range in Half
Let's start with four terms.
- Dealing range (DR): the meaningful swing low and swing high pair that price is currently trading between. You usually take the start and end of the leg that broke structure and moved hard.
- Equilibrium (EQ): the exact middle of the range, (high + low) ÷ 2. It is also simply called the 50% level.
- Premium: the half above EQ — the "expensive" zone relative to the range.
- Discount: the half below EQ — the "cheap" zone relative to the range.
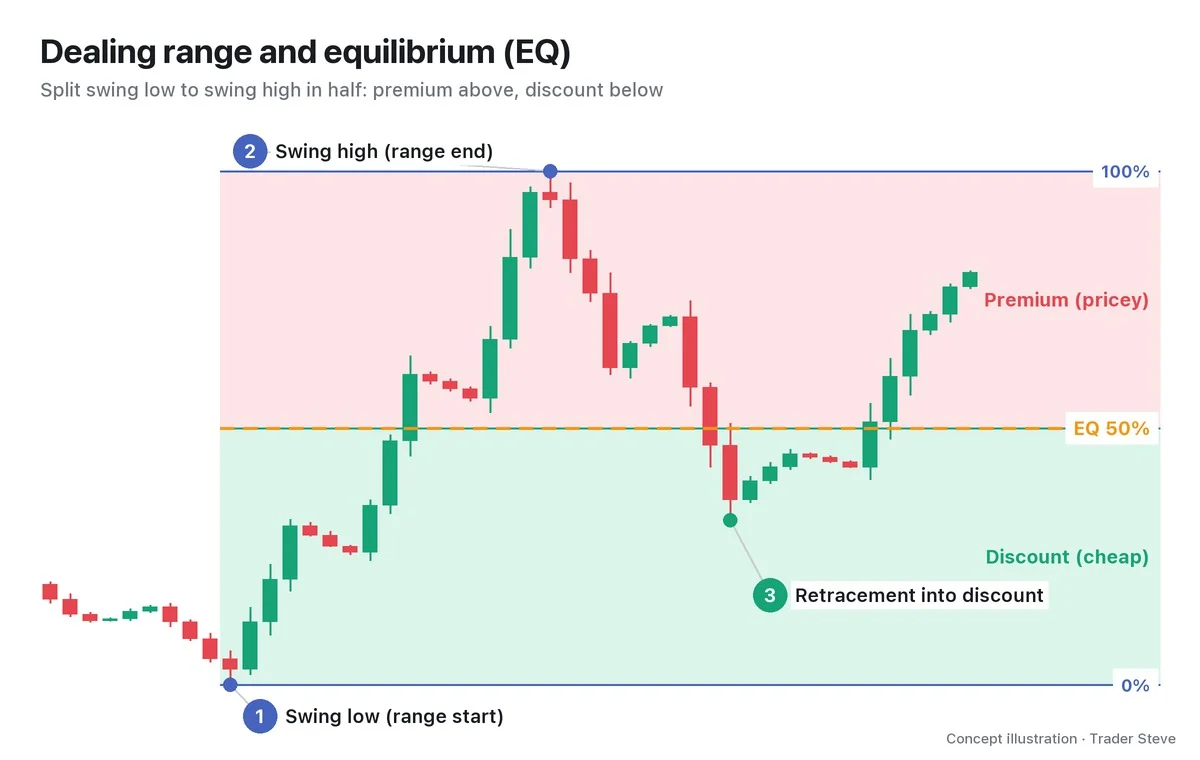
Whenever this series gives a location as a number, it is the percentage measured up from the bottom (the low) of the range. The low is 0%, the high is 100%, and EQ is 50%. Above 50% is premium; below it is discount.
2. Why Exactly 50%?
Inside any range, some traders bought near the low and others bought near the high. ICT treats the midpoint, 50%, as the "fair price" for that range. If you bought below EQ, you paid less than the middle of what traded in the range; if you bought above EQ, you paid more.
The idea isn't new. It is the same thinking as the consequent encroachment (CE), the exact midpoint of a fair value gap (FVG), extended to the whole range (see the ICT FVG series). It is also the same price as the 0.5 level of a Fibonacci retracement: draw the Fibonacci tool from the low to the high, and the 0.5 line is EQ (see the Basics Fibonacci series).
That said, 50% is not "a line where price must stop." It is the dividing line between cheap and expensive. Price sometimes runs straight through EQ and sometimes turns just short of it.
3. Buy in Discount When Bullish, Sell in Premium When Bearish
The most important rule for using premium and discount fits in one line.
Decide direction first. If you are bullish, buy only in discount; if you are bearish, sell only in premium.
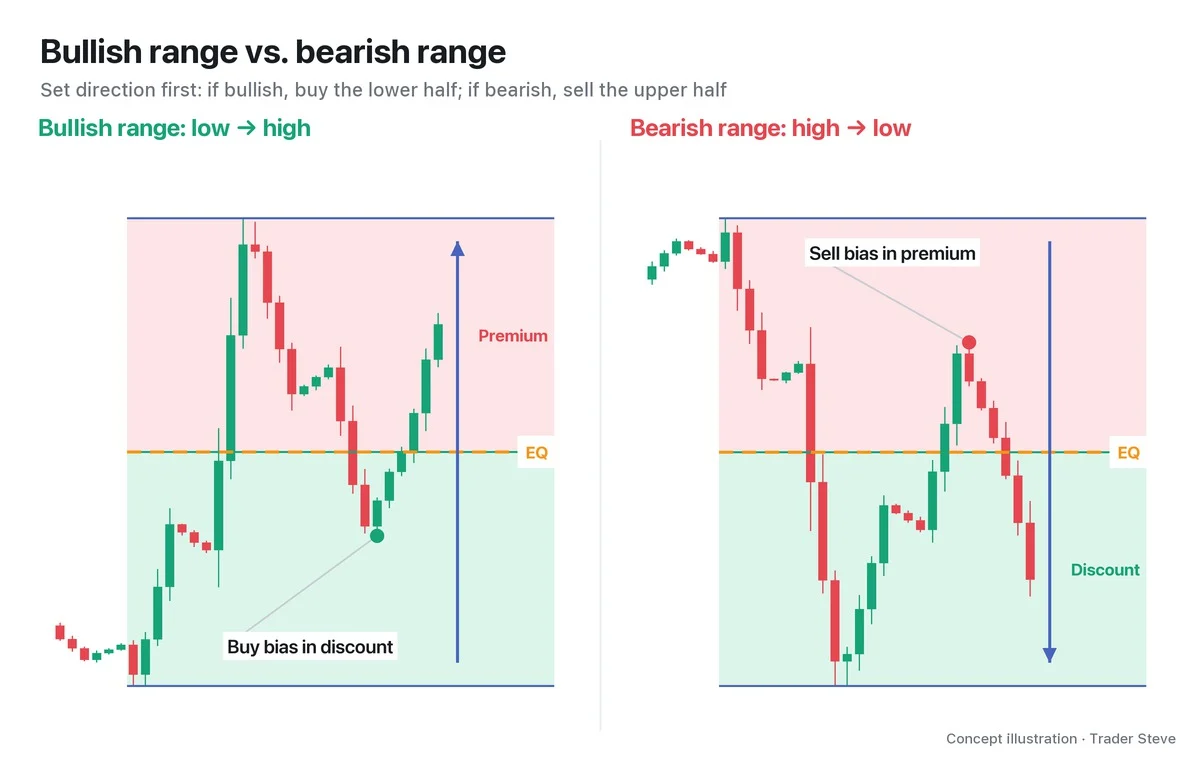
| Bullish bias (buy) | Bearish bias (sell) | |
|---|---|---|
| Direction you draw the range | swing low → swing high | swing high → swing low |
| Where you look for entries | discount (below EQ) | premium (above EQ) |
| What you avoid | chasing longs in premium | chasing shorts in discount |
| Where the range is invalidated | break below the swing low | break above the swing high |
Here is the point that's easy to miss. A location in the range only tells you whether price is "cheap or expensive right now" — it is not a direction signal. Buying in a downtrend just because price sits in discount is close to buying because it "looks cheap." From a bearish point of view, discount is actually "a cheap place to be selling." So you set direction from the higher-timeframe structure first, and only then look for entries in the half that matches that direction. Direction is judged by whether swing highs and lows are rising or falling (see the Basics Swings and Trend series).
4. Why Price Moves Back and Forth
This view also explains why a trend doesn't travel in a straight line but steps up and down like a staircase. The side that bought cheap and sold expensive wants to buy again, even cheaper, once it has sold.
"This game right now is a game of buying cheap and selling expensive. So what happens? They bought cheap and sold it off — sold everything right here. Now it has to come back down, because they need to buy cheaper. Push it up and sell again, it comes back down again. Why? Because they have to buy again somewhere cheaper. … It's this, over and over." — Trader Steve, live stream, Sep 21, 2026 (translated from Korean) · ▶ Watch the stream highlights (Korean audio)
Put that in range terms and you get the chart below.
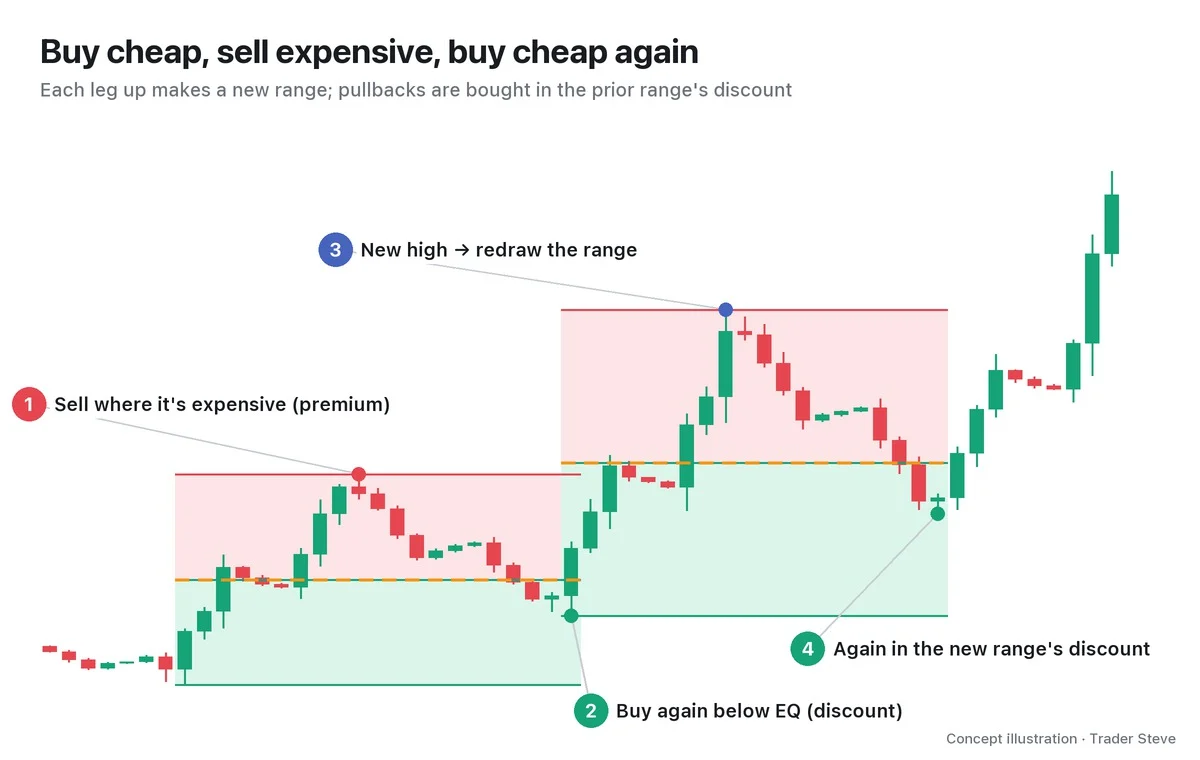
When a pullback inside an uptrend drops into the prior range's discount, that isn't strange — it can be read as buyers coming back to buy at a lower price. Conversely, if you chase price to the top of premium just because you are bullish, that exact spot is "a place to sell expensive" for someone else. Part 2 covers how to redraw the range after a new high.
5. A First Look at a Real BTC Chart
It isn't as clean as the concept illustrations, but you can see the reaction around EQ on a real chart too.
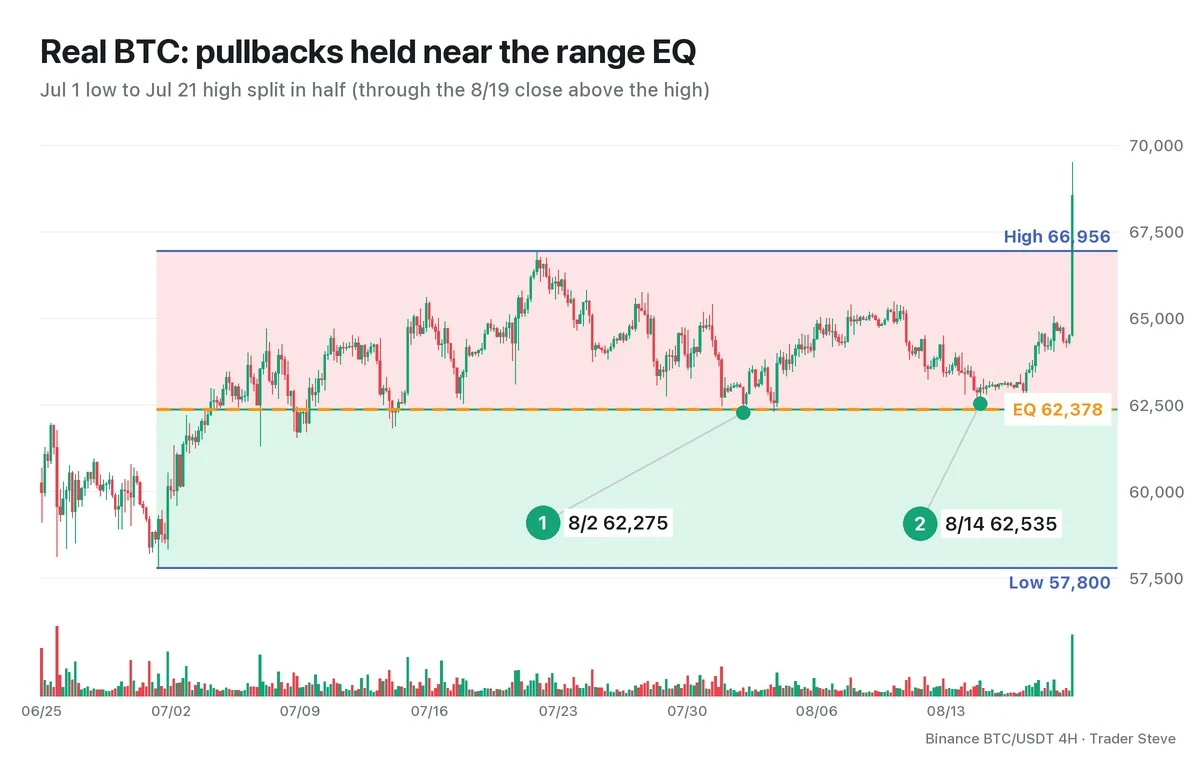
If you take the range from the Jul 1, 2026 low of 57,800 to the Jul 21 high of 66,956, EQ is 62,378. The pullbacks that followed stopped at 62,275 on Aug 2 (48.9% up from the bottom of the range, just below EQ) and 62,535 on Aug 14 (51.7%, just above EQ). Both times the distance from EQ was less than 0.3%, and on Aug 19 a 4-hour candle closed above the range high.
There are two things to take from this. First, price did not touch EQ "exactly." Once it was slightly below, once slightly above. That is why you treat EQ as a zone around the level, not a single point. Second, this is a hindsight reading of a past chart. There is no guarantee the same spot will hold next time. Part 4 covers this case and what happened afterward in detail.
Key Takeaways
- The dealing range (DR) runs from a meaningful swing low to a swing high, and its exact middle is equilibrium (EQ, 50%).
- Above EQ is premium (the expensive half); below is discount (the cheap half). EQ is the same idea as an FVG's CE and the Fibonacci 0.5.
- If you are bullish, buy only in discount; if you are bearish, sell only in premium. Location is not a direction signal.
- Treat EQ as a zone rather than an exact line, and use it together with other evidence.
If drawing ranges and equilibrium levels by hand for several markets takes too much time, the Omnisight Report, which lays out where each market sits, is worth a look.
In Part 2, we'll cover where to draw a dealing range from and to, the conditions for choosing anchors, and a checklist.
This lesson adapts the text, figures and live-stream quotes of the Trader Steve TA series for the web, translated from the original Korean. Check the text and figure captions for the timing and interpretation of each real example, and read conceptual diagrams and real charts separately.
Corrections: support@omnisight.report


