
What Are Rejection, Propulsion and Vacuum Blocks? Meaning and Logic
Historical examples for learning · not current prices or trade recommendations.
Contents
A long wick that pushed too far and got rejected. A launchpad candle that sprang back up off an order block. An empty price range that price jumped across the instant economic data hit. ICT calls these three the rejection block, the propulsion block and the vacuum block. This lesson uses charts to show what each block is and why price tends to react at that spot again.
1. The Three Blocks at a Glance
All three blocks are "a zone left behind by a price-rejection wick or a sharp move." What differs is where they form and which range you mark.
| Block | Where it forms | Range | Why you watch it again |
|---|---|---|---|
| Rejection block (RB) | The long wick at a swing high or swing low | body end to wick end | It's where price was rejected |
| Propulsion block (PB) | An opposite-color candle that pulled back into an order block (OB) | that candle's high to low | It's where price was supported once more on top of the OB |
| Vacuum block (VB) | A volatility event such as an economic data release | the gap price jumped across | Price often comes back later to fill it |
2. Rejection Block: The Wick That Got Rejected
A rejection block is the body end to wick end range of a candle with a long wick at a swing high or swing low. It is the trace left when price pushed beyond a level, was rejected and came back.
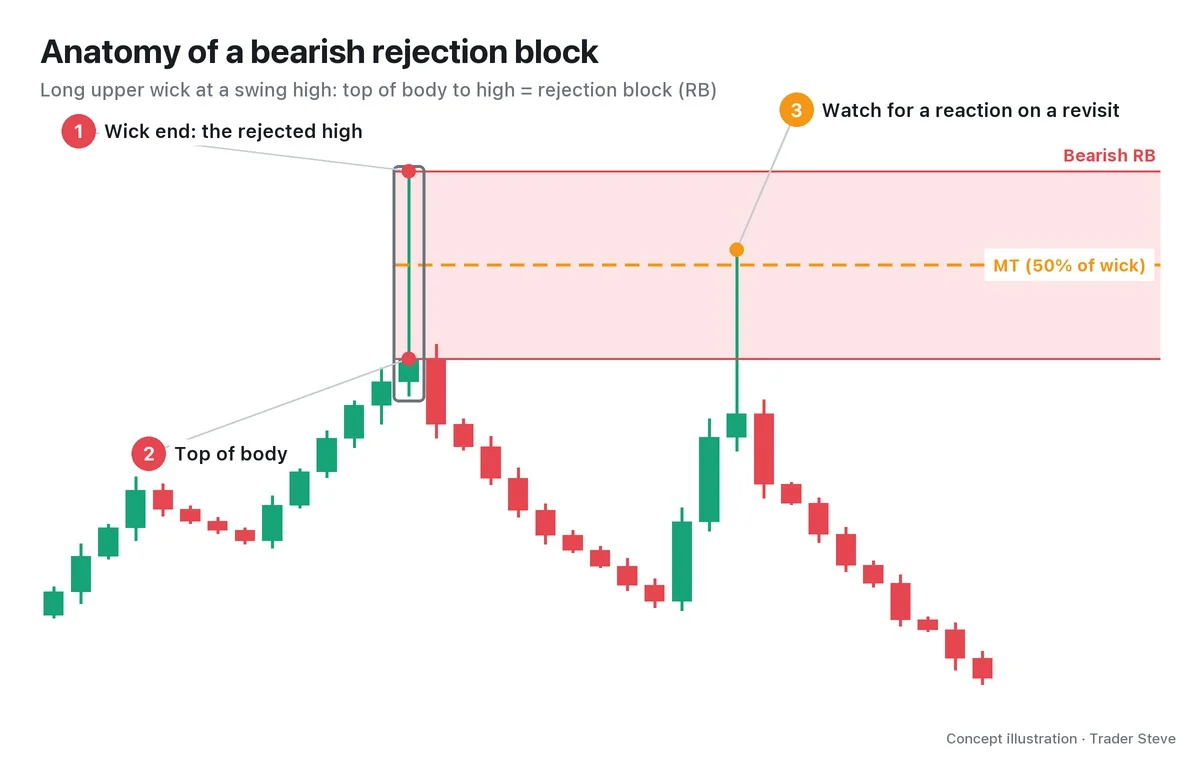
- Bearish RB: the upper wick at a swing high. The range runs from the top of the body (the higher of the open and close) to the high.
- Bullish RB: the lower wick at a swing low. The range runs from the low to the bottom of the body (the lower of the open and close).
- Mean threshold (MT): 50% of the wick range. It's the reference line for judging how a pullback reacts.
A bullish RB has a "stab down, then roll back up" shape. It's the shape I described in the Sep 21 live stream as the weekly candle that needed to come next.
"Close the weekly candle by stabbing deep below and then pushing back up… run a long lower wick and roll it all the way back up, so the close itself gets pushed back to a level not much different from the baseline where it started." — Trader Steve, live stream, Sep 21, 2026 (translated from Korean) · ▶ Watch the stream highlights (Korean audio)
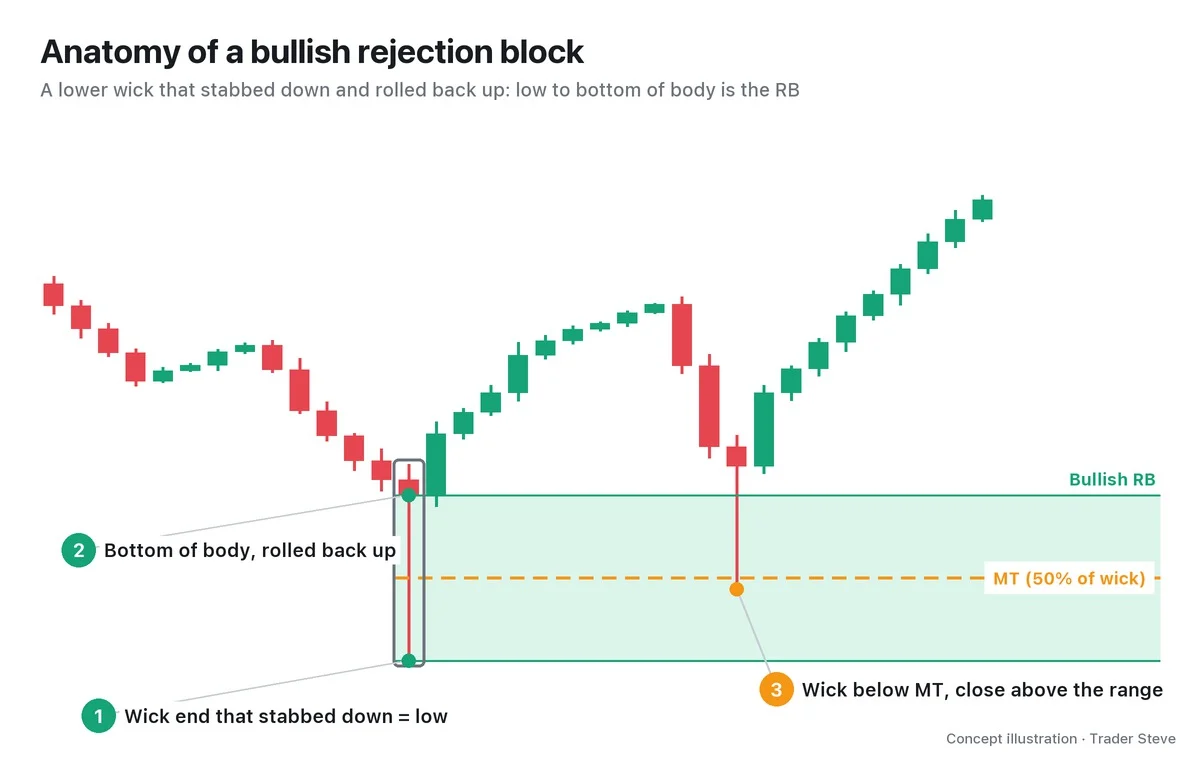
Invalidation is based on the close, not the wick. It's common for a wick to cross the MT. The block is considered finished only when a body closes beyond the wick end.
Why Price Reacts in the Wick Zone Again
A long wick is the trace of rejection at that price level. Whether selling was absorbed there, heavy trading took place or someone is holding an average entry price there are hypotheses you check together with volume and trade data. The wick alone cannot confirm them.
"All these spots hanging off the tips of the wicks along the lows are liquidity pockets. It means a lot of positions changed hands here, and that this is where the downtrend coming in was taken on by buyers and lifted back up, right? So the big players' average entry price, or a lot of buy orders, may be sitting here, which means even if price pushes down this far, it may turn and go back up." — Trader Steve, live stream, Aug 27, 2026 (translated from Korean) · ▶ Watch this moment (Short, Korean audio)
If the absorption or average-entry hypothesis is confirmed with separate data, related orders may appear again when price returns, which makes the wick zone "a place to watch for a reaction." It is only a possibility, though: once that size is fully absorbed, price can cut straight through.
3. Propulsion Block: The Candle That Relaunched From an Order Block
A propulsion block forms on top of an order block (OB). A bullish OB is the last bearish candle before a big rally.
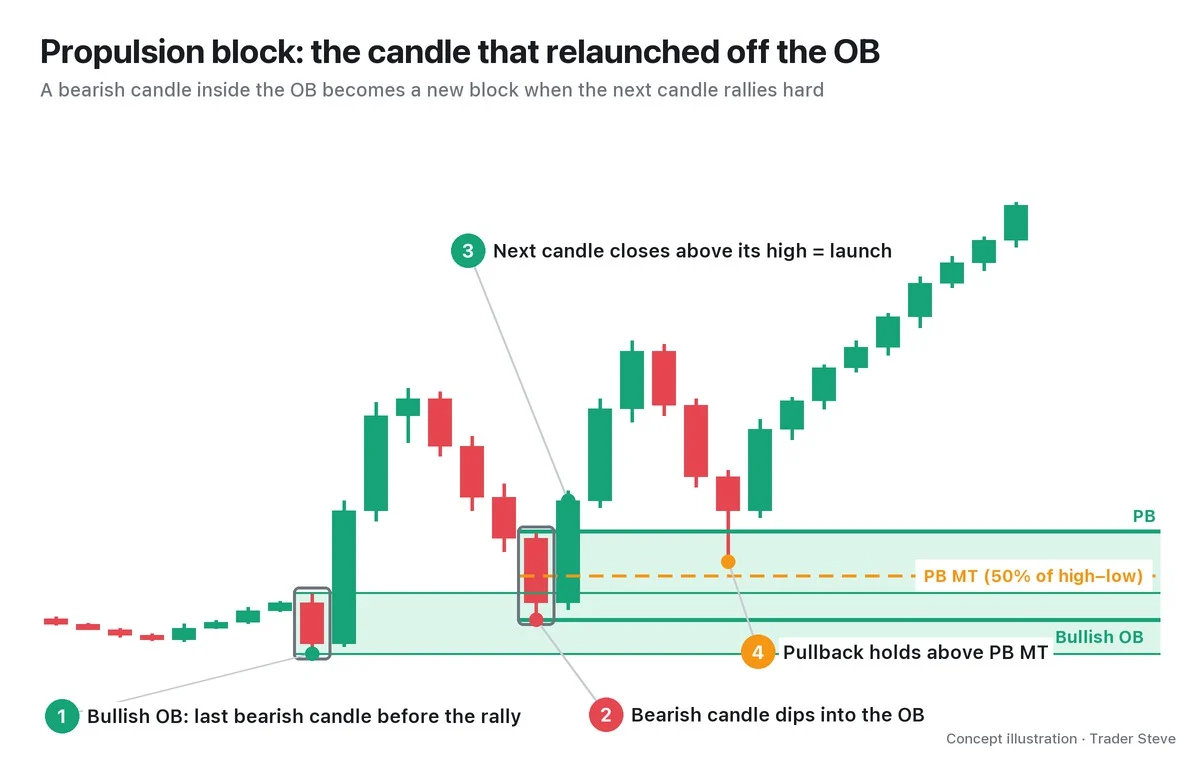
When price rallies and then pulls back to the OB, a bearish candle that reaches into the OB can form. If the following candles (within 3 candles in this series) close above that bearish candle's high, the bearish candle becomes a new launchpad: a bullish propulsion block.
- The range is that candle's high to low, and the MT is its 50%.
- When a pullback comes later, the block stays valid only as long as no body closes below the MT.
The reason to draw a PB separately is distance. It's where buying came in again above an OB that had already held, so the next pullback may react at the PB before it ever reaches the OB. The trade-off is sensitivity: a single close below the MT quickly invalidates it.
4. Vacuum Block: Where No One Was There to Take the Other Side
A vacuum block is the gap left when a volatility event, such as an economic data release, makes price jump in an instant. US economic data usually comes out at 21:30 KST (Korea Standard Time; 08:30 in New York, during US daylight saving time). When orders pile up on one side, the prices in between get skipped with no trading.
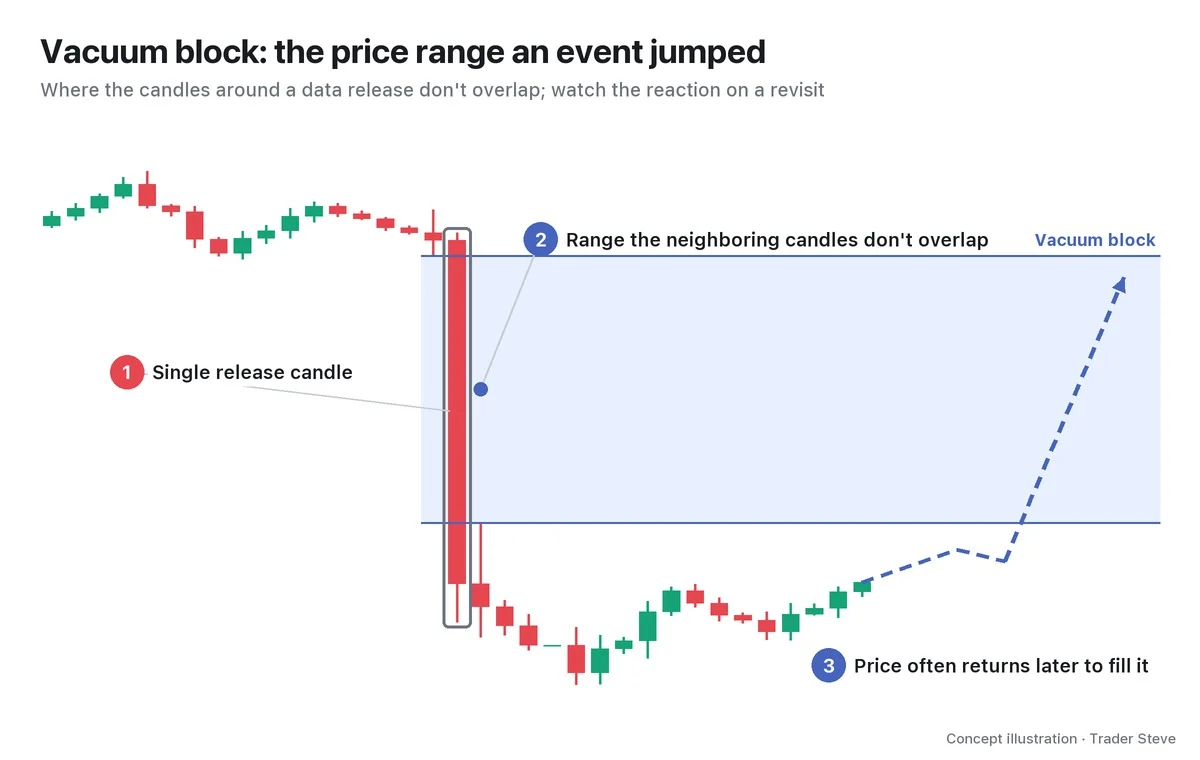
I call price ranges like this "a vacuum" or "a Hi-Pass zone" (after Korea's electronic toll lane, where cars go through without stopping). The point is that nobody is there to take the other side, so price slides through fast.
"There's almost no high-volume zone here — it's practically a vacuum gaping wide open below, so once price starts pushing through this and falling, slamming it straight down isn't that hard. It means there isn't much size to absorb it. You need a lot of people who got trapped buying and selling in this zone, because that's what gives you people trading alongside and absorbing the move." — Trader Steve, live stream, Oct 22, 2026 (translated from Korean) · ▶ Watch the stream highlights (Korean audio)
The calculation is the same as a three-candle fair value gap (FVG); the difference is that the cause is an event. Crypto spot trades 24 hours a day, so there are almost no session-open gaps. Instead, you look at the gap left by a short candle (15-minute and so on) at the release time. Part 2 covers how it differs from an FVG.
5. A Real BTC Example: The Upper Wick at the May 6 High
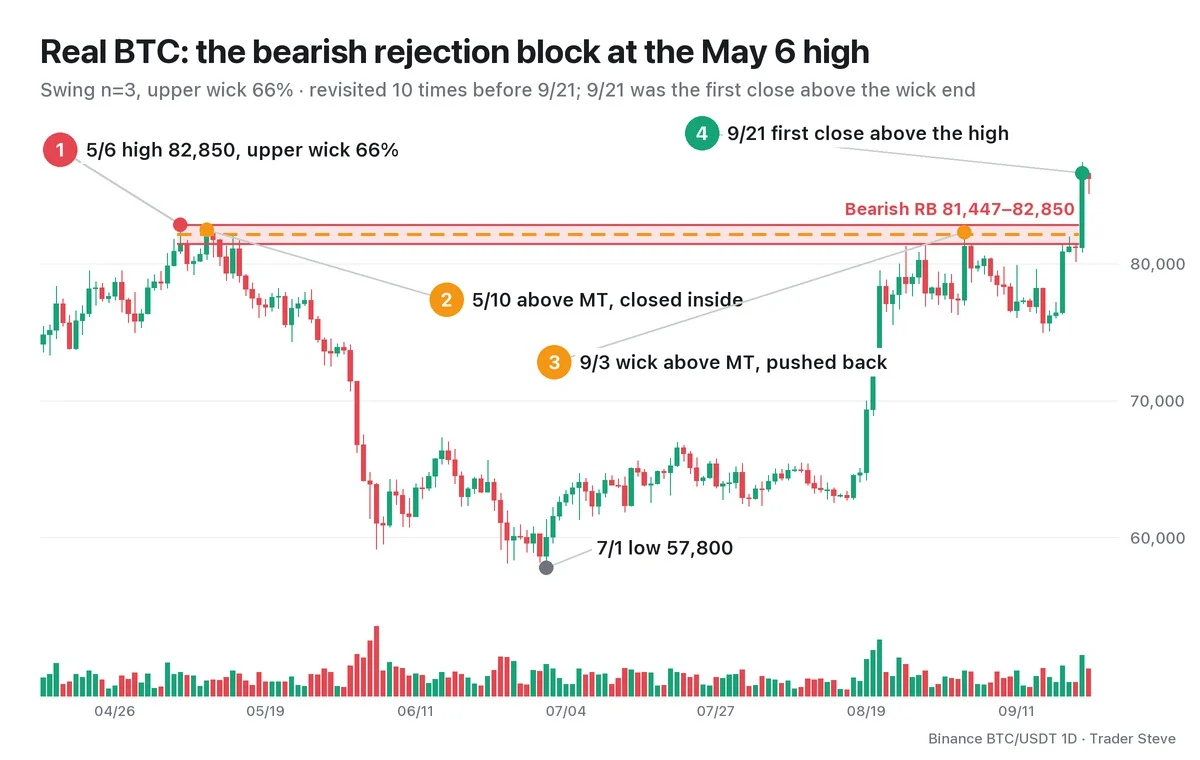
On the Bitcoin (BTC) daily chart, the May 6 candle opened at 80,906, hit a high of 82,850 and a low of 80,731, and closed at 81,447. The upper wick was 1,403, or 66% of the day's range, and the candle was a swing high, higher than the 3 candles on each side (7 candles in total). (This series' rules: swing n=3, wick ≥ 50% of the range.) So the bearish RB is 81,447–82,850, and the MT is about 82,149.
- After that, through Sep 20, the high reached the top of the body at 81,447 or above on 10 days (6 in May, plus Aug 28 and Sep 3, 19 and 20).
- May 10 (high 82,479), May 11 (82,380) and Sep 3 (82,300) wicked above the MT, and May 10 (close 82,210) and May 11 (81,746) closed inside the range.
- Even so, no candle closed above the wick end at 82,850. In the meantime, price dropped as low as 57,800 on Jul 1 and came back.
- The Sep 21 close of 86,620 was the first close above the wick end, and by this rule the RB was invalidated there.
Wicks crossed the MT several times, yet on a closing basis the level held for more than four months. The structural meaning of this high is covered in ICT Market Structure Part 4 (related lesson).
Key Takeaways
- A rejection block is the long wick at a swing high or low: the range from body end to wick end. The MT is 50% of the wick.
- A wick is a trace of price rejection; size and average entry prices are hypotheses to confirm with separate data. Invalidation is a close beyond the wick end.
- A propulsion block is an opposite-color candle that dipped into an OB and became a launchpad when the following candles closed strongly. A close below its MT ends it.
- A vacuum block is the gap an event jumped across. Price often comes back to fill it, but it is not a confirmed signal.
In Part 2, we'll cover the exact conditions for finding each block on a chart, the order for drawing them, and a checklist.
Related reading: ICT Order Blocks (related lesson), the foundation of the PB, and ICT FVG (related lesson), which are calculated the same way as vacuum blocks.
Measuring the wick ratio and MT by hand for every swing takes time. The Omnisight Report lays out zones like these for each market.
This lesson adapts the text, figures and live-stream quotes of the Trader Steve TA series for the web, translated from the original Korean. Check the text and figure captions for the timing and interpretation of each real example, and read conceptual diagrams and real charts separately.
Corrections: support@omnisight.report


