
What Is a Swing Failure Pattern (SFP)? Meaning and Why It Forms
Historical examples for learning · not current prices or trade recommendations.
Contents
You will often see price poke just above a prior high, only for the candle to close back below that high. A candle like this is called a swing failure pattern (SFP). This lesson uses charts to show what an SFP is and why these wicks form so often just beyond highs and lows.
1. The One-Line Definition: A Candle That Crosses a Swing and Closes Back Inside
An SFP is a candle whose wick crosses a confirmed swing high (or swing low) while the same candle closes back inside. It is a swing that tried to make a new high (or low) and failed — hence the name.
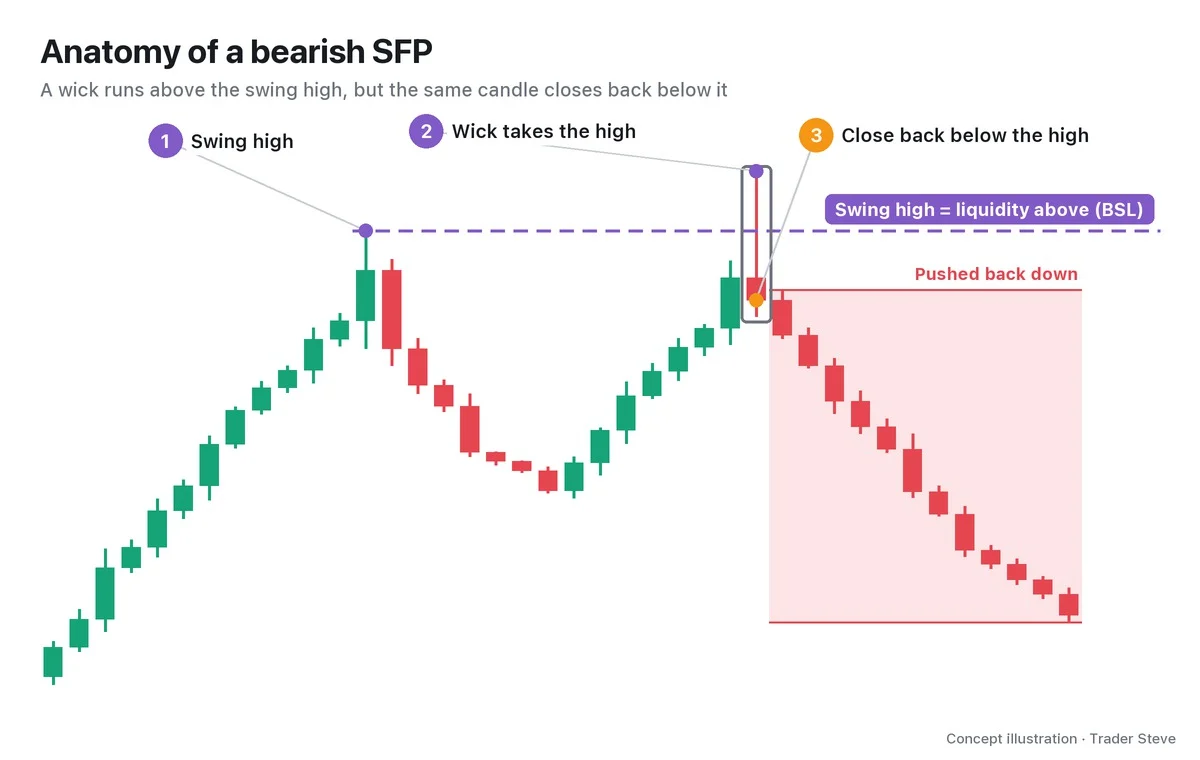
A viewer asked me, "If price even wicks into that high, is the bearish view over?" Here is how I answered.
"If price stabs up to 82.8K with a wick and comes back down, that's what ICT calls the so-called swing failure pattern. If price punched through and kept going, that would be a swing higher — and this is the pattern where that fails. But honestly, it's just price hitting resistance at a support/resistance line." — Trader Steve, live stream, Sep 4, 2026 (translated from Korean) · ▶ Watch this moment (Short, Korean audio)
The key is not "it crossed" but "it crossed and then closed back inside." The close has to be back inside for it to be an SFP; if the candle also closes outside, it is a breakout. A swing high or swing low is a peak or trough that is higher or lower than a few candles on each side (see Basics Swings and Trend, basics/swing-trend).
2. Bearish SFPs and Bullish SFPs
There are two kinds of SFP, depending on which swing is crossed.
| Type | What gets crossed | Liquidity taken | Close condition |
|---|---|---|---|
| Bearish SFP | a wick above the swing high | buy-side liquidity (BSL) above the high | close below the high |
| Bullish SFP | a wick below the swing low | sell-side liquidity (SSL) below the low | close above the low |
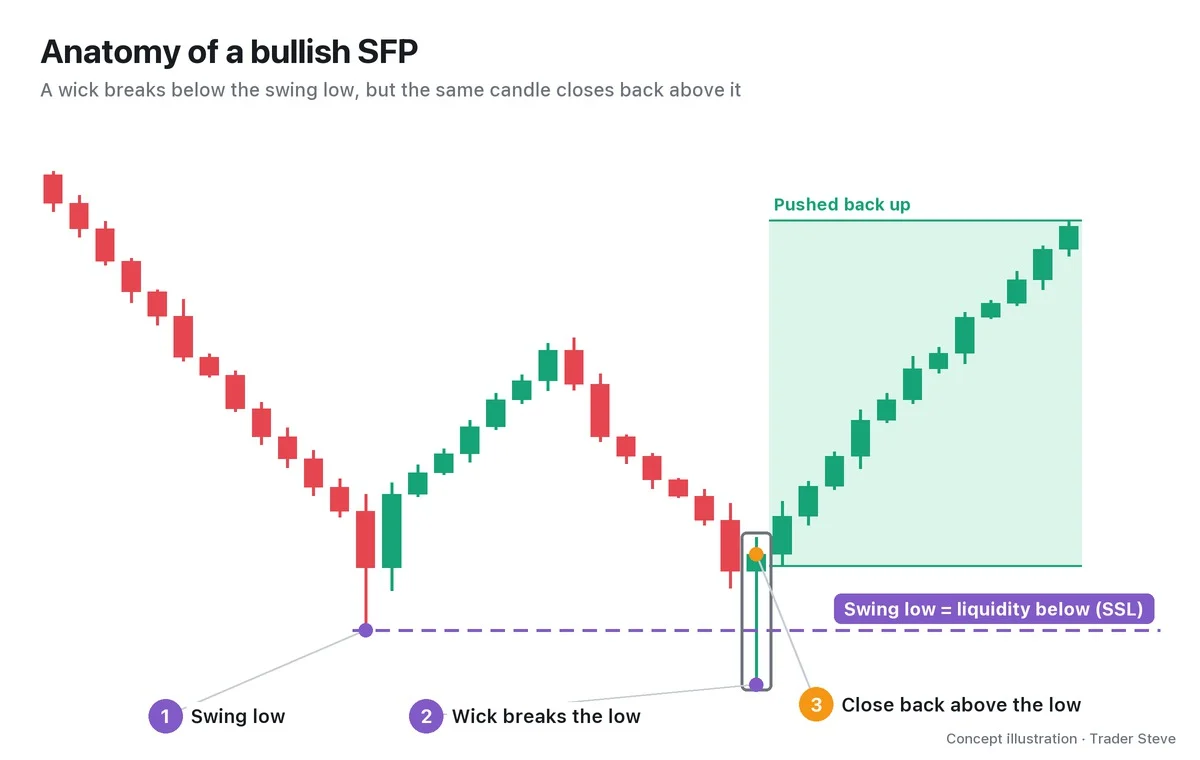
The dotted purple line is the reference swing price and also the liquidity level, where orders are stacked beyond it (the BSL and SSL from ICT Liquidity, ict/liquidity). The tip of the SFP candle's wick becomes the invalidation level. If a later candle closes back beyond that wick tip, the SFP has failed.
3. Why It Forms: Orders Stacked Beyond the Swing
Wicks form so often just beyond highs and lows because orders cluster there. Take the area below a low: two kinds of sell orders pile up there.
- Stop-losses on long positions: stops placed below the low go out as market sell orders the moment price touches them. This assumes stop-market orders; a stop-limit order may go unfilled.
- Shorts chasing the breakdown: new selling from traders who think, "The low broke, so it's going lower."
"The moment price takes this out and drops, what do you see? Once this goes, the next thing you're looking at is down here. … Because people think, 'Isn't it about to puke straight down?', plenty of people short here, and plenty of people who were long here get stopped out. Add the longs getting stopped out to the new shorts, and the selling pressure to the downside goes up two, three times, right? … The big players are watching all of it, and … when people start dumping? They just soak it all up." — Trader Steve, live stream, Oct 16, 2026 (translated from Korean) · ▶ Watch the stream highlights (Korean audio)
For someone trying to buy in size, this moment — when sell orders pour in all at once — is the best chance to get filled. Above a high it works the other way: short stops (buy orders) and breakout buying pile up there and become the counterparty for someone trying to sell in size.
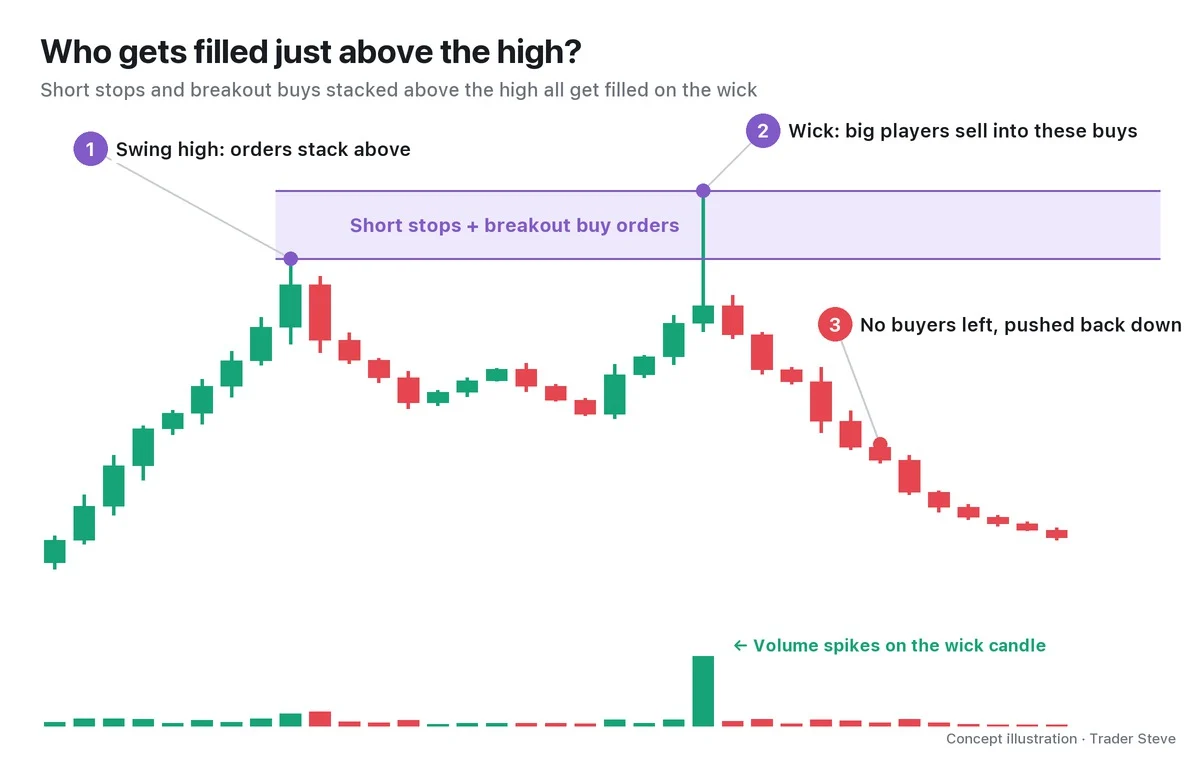
That's why SFP wick candles often carry heavy volume. It is the trace of resting orders all getting filled at once.
Why Price Comes Back: The Failed Side's Force Turns Around
The moment price crosses the swing, most of the stops and chase orders beyond it get filled. Once they have been absorbed, there are no new orders left to keep pushing, so by the time the candle closes, price is back inside the original range.
And when the side that tried to push through fails, its positions become fuel in the opposite direction. Shorts that came in on the break of the low have to stop out (buy) once price comes back up.
"If it puts in a double bottom around here, then tries to shove price lower with a swing failure like this but fails and bounces back up, that structure completely eats up the downside momentum — it's where a trend reversal comes." — Trader Steve, live stream, Aug 28, 2026 (translated from Korean) · ▶ Watch this moment (Short, Korean audio)
Still, an SFP is only a place where a failure has been confirmed, not a signal that guarantees direction. Part 2 lays out, with numbers, the conditions that filter real SFPs from the rest.
4. Real BTC Weekly Chart: Wicks Left Above the All-Time High
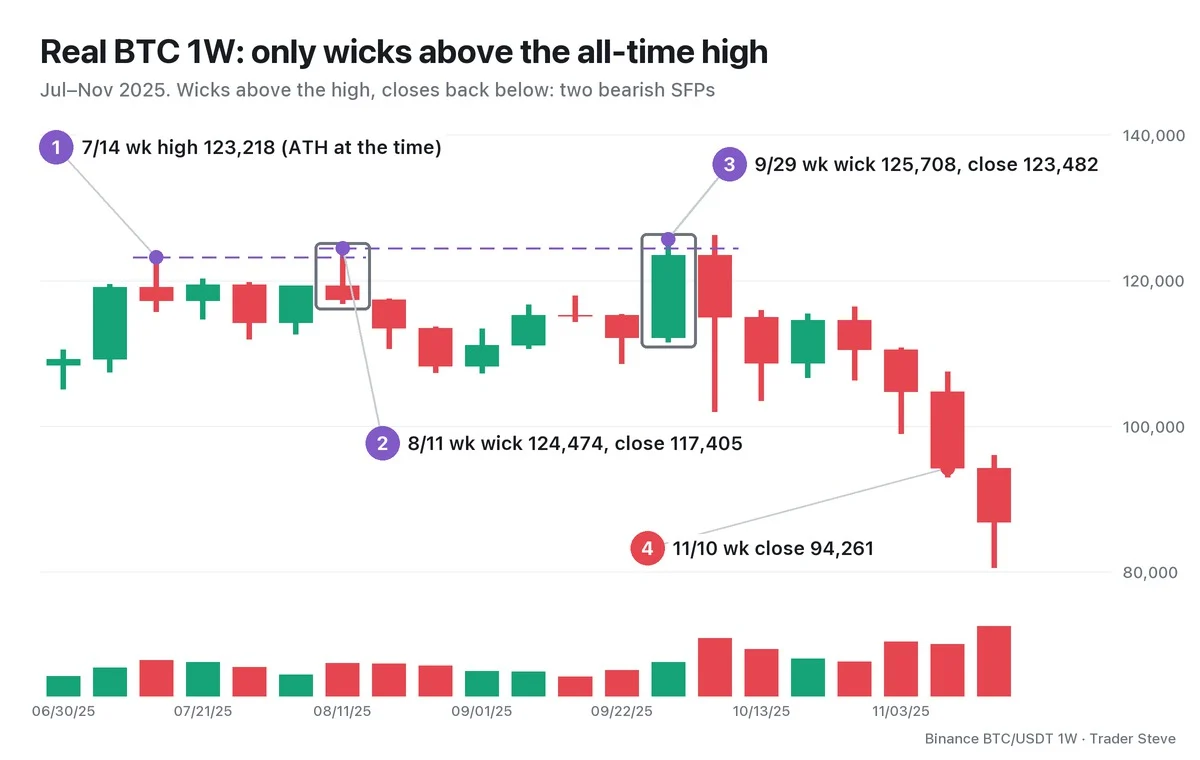
- ① Week of Jul 14, 2025, high 123,218: the all-time high (ATH) at the time.
- ② Week of Aug 11: the high of 124,474 went 1.02% above that level, but the close of 117,405 was back below it. A weekly bearish SFP.
- ③ Week of Sep 29: this time the high of 125,708 went 0.99% above the wick tip of the Aug 11 week, but the close of 123,482 was again below it. A second bearish SFP.
- The following week, Oct 6, poked once more to a high of 126,199.6 but ended as a large bearish candle closing at 114,958.8. No week after that has closed above the wick tip of the Sep 29 week.
- ④ The week of Nov 10 closed at 94,261, 25.3% below the Oct 6 week's high.
Here is how I looked back on that period on a live stream.
"Look at Bitcoin too — when it went over $120,000 here, it punched through like this. It goes over, and then from here it gets pushed back down like this. You could say this rally that takes out the high is the chance to unload the most size on retail traders at the highest prices." — Trader Steve, live stream, Aug 24, 2026 (translated from Korean) · ▶ Watch the stream highlights (Korean audio)
Over the same period, three weekly bullish SFPs also formed at the lows (the weeks of Aug 18, Oct 6 and Nov 3), but all three were invalidated within a few weeks when a close came in below the wick tip. That is why you shouldn't decide direction from one SFP alone (invalidation in Part 2, stand-alone results in Part 5).
5. SFP and Related Terms
| Term | Meaning | Relationship to the SFP |
|---|---|---|
| Liquidity sweep | Any move that fills the orders beyond a swing | It's a sweep only if the same candle closes back inside the reference line. An SFP requires the same close back inside; a close outside is a liquidity run (see ICT Liquidity Sweeps, ict/liquidity-sweep) |
| Stop hunt | The same move, named from the side that got stopped out | Same mechanics, different point of view |
| False breakout (fakeout, deviation) | The same phenomenon, measured against a range or a support/resistance level | If the reference line is a swing, it's an SFP (see Basics Support and Resistance, basics/support-resistance) |
| Turtle Soup | The original trading method that turned failed breaks of 20-day highs and lows into rules | The rule-based trading version of the same phenomenon; the next topic (see ICT Turtle Soup, ict/turtle-soup) |
Key Takeaways
- An SFP is a candle whose wick crosses a confirmed swing while that candle closes back inside.
- Crossing above a high makes a bearish SFP; crossing below a low makes a bullish SFP.
- Wicks form often because the stops and chase orders beyond a swing become the counterparty for large orders.
- Once those orders are absorbed, nothing is left to push price further, and the failed side's positions become fuel in the opposite direction.
- The wick tip is the invalidation level. An SFP is not a signal but "a place where a failure has been confirmed."
In Part 2, we'll cover a five-step checklist for judging an SFP on a chart with numbers, and how to filter out things that look like SFPs but aren't (near misses and breakouts).
Making this call by hand for every market and timeframe takes a lot of time. A report that reads several theories at once is linked below.
This lesson adapts the text, figures and live-stream quotes of the Trader Steve TA series for the web, translated from the original Korean. Check the text and figure captions for the timing and interpretation of each real example, and read conceptual diagrams and real charts separately.
Corrections: support@omnisight.report


