
What Is the ICT Silver Bullet? The One-Hour Trading Window Explained
Historical examples for learning · not current prices or trade recommendations.
Contents
Study ICT long enough and you'll hear that "the Silver Bullet only looks at one hour, three times a day." It's a setup where the time is fixed before the price, which feels unusual at first. This lesson explains what the Silver Bullet is, why it uses that particular hour, and what time it falls in Korea on a crypto chart, with real Bitcoin (BTC) statistics.
All times in this lesson are Korea Standard Time (KST, UTC+9) unless marked as New York time.
1. The One-Line Definition: Time First, Price Second
The Silver Bullet (SB) is a time-based setup introduced by ICT. In one line:
A short trade where, inside a fixed one-hour window, ① price sweeps a nearby high or low, ② a strong move leaves a fair value gap (FVG), ③ you enter when price returns to that FVG, and ④ you target the liquidity on the opposite side.
A fair value gap (FVG) is the empty price range a large candle leaves behind when it jumps across prices. If FVGs are new to you, start with ICT FVG Part 1.
The order is the whole point. The Silver Bullet starts from "if it's not this hour, don't look at all." An FVG that forms outside the window doesn't count as a Silver Bullet, however clean it looks. Time filters first; the price conditions come after.
2. The Three Windows: New York Time and Korea Time
Silver Bullet windows are defined in New York local time.
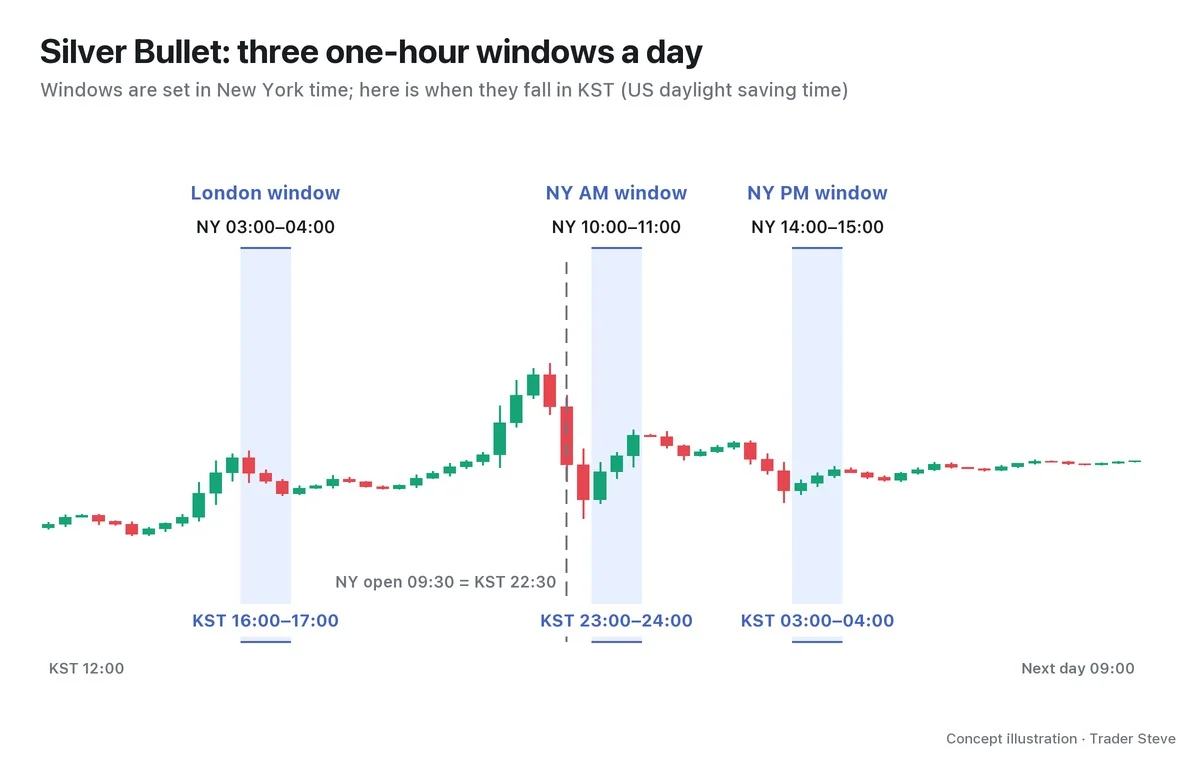
| Window | New York time | KST (daylight saving, through Oct 31) | KST (standard time, from Nov 1) |
|---|---|---|---|
| London Silver Bullet | 03:00–04:00 | 16:00–17:00 | 17:00–18:00 |
| New York AM Silver Bullet | 10:00–11:00 | 23:00–24:00 | 00:00–01:00 |
| New York PM Silver Bullet | 14:00–15:00 | 03:00–04:00 next day | 04:00–05:00 next day |
The most widely used is the New York AM window. The US stock market opens at 09:30 (22:30 KST), and this window starts 30 minutes later, once the first burst of activity right after the open has passed.
In 2026, the US ends daylight saving time (EDT) and switches to standard time (EST) on Nov 1. From that day, every KST time shifts one hour later. All examples in this series are from Jul–Oct, so they use daylight saving times.
3. Why That Hour: When Orders Pile In
The reason is simple: orders pile in around the US market open, and price moves the most. Let's check with real data whether crypto is any different.
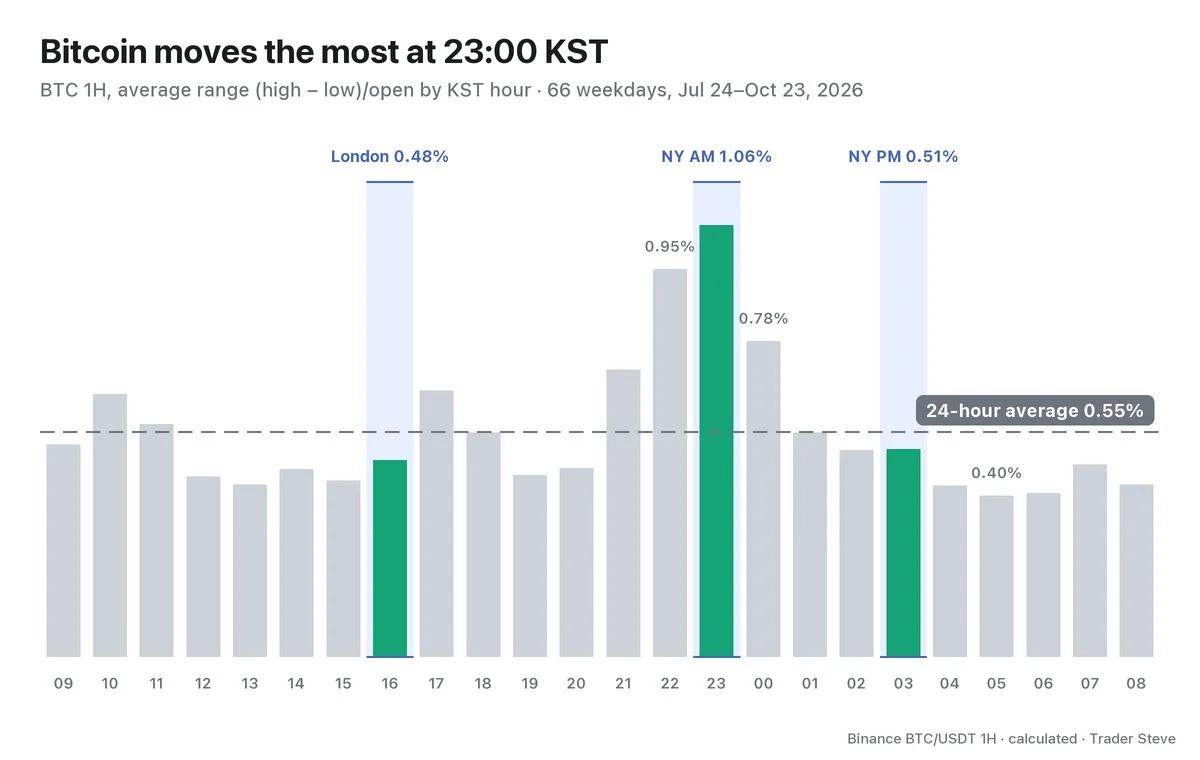
For every 1-hour candle, I measured the range as (high − low)/open and averaged it by KST hour (weekends excluded).
- 23:00 (10:00–11:00 New York, the AM window) is the largest at 1.06%. That is about twice the daily average of 0.55%.
- The hours on either side come next: 22:00 (the open) at 0.95% and 00:00 at 0.78%.
- The quietest hour is 05:00, at 0.40%.
- Volume at 23:00 was also 2.11x the weekday hourly average.
Ethereum had the same shape (largest at 23:00, 1.32%). Redefining weekdays by New York date instead still left 23:00 as the largest.
The London window (16:00, 0.48%) and the New York PM window (03:00, 0.51%), however, came in below the daily average. In crypto, the three windows don't carry equal weight. A time window is only a filter for "hours when a move is more likely"; the window itself doesn't tell you the direction.
On my live streams I often talk about how price behaves differently at different times of day. I've never put the name "Silver Bullet" on it, but here's how I once described the difference between Asian and US hours:
"These days, if you look, the Asian session is dull — flatlined — and then during US market hours price is flopping up and down, shooting up, dropping, just dancing all over the place." — Trader Steve, live stream, Sep 2, 2026 (translated from Korean) · ▶ Watch the stream highlights (Korean audio)
4. Anatomy of a Single Silver Bullet
What happens inside the window breaks down into four steps.
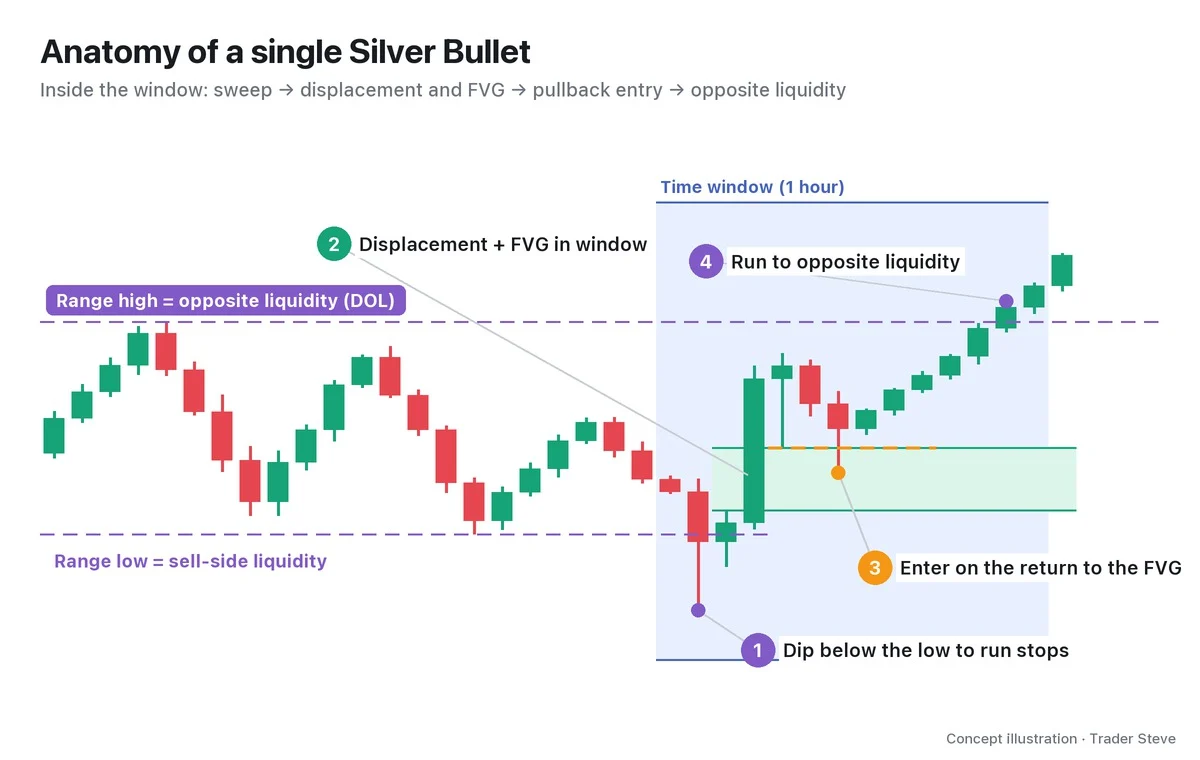
- Sweep (liquidity sweep): just before or inside the window, price dips slightly below a nearby low (or above a nearby high) and triggers the stop orders resting below (above) it.
- Displacement and an FVG: after the sweep, a large candle in the opposite direction breaks a short-term high (low) and leaves an FVG. All three candles of this FVG must form inside the window.
- Pullback entry: you enter when price comes back to that FVG. You don't chase.
- The target is the opposite liquidity: the next place price is drawn to, the draw on liquidity (DOL). For a bullish setup it sits above the range high; for a bearish setup, below the range low.
Here's how it looks in practice. In the early hours of Sep 16, the New York PM window produced the bearish version, the same steps with the direction flipped.
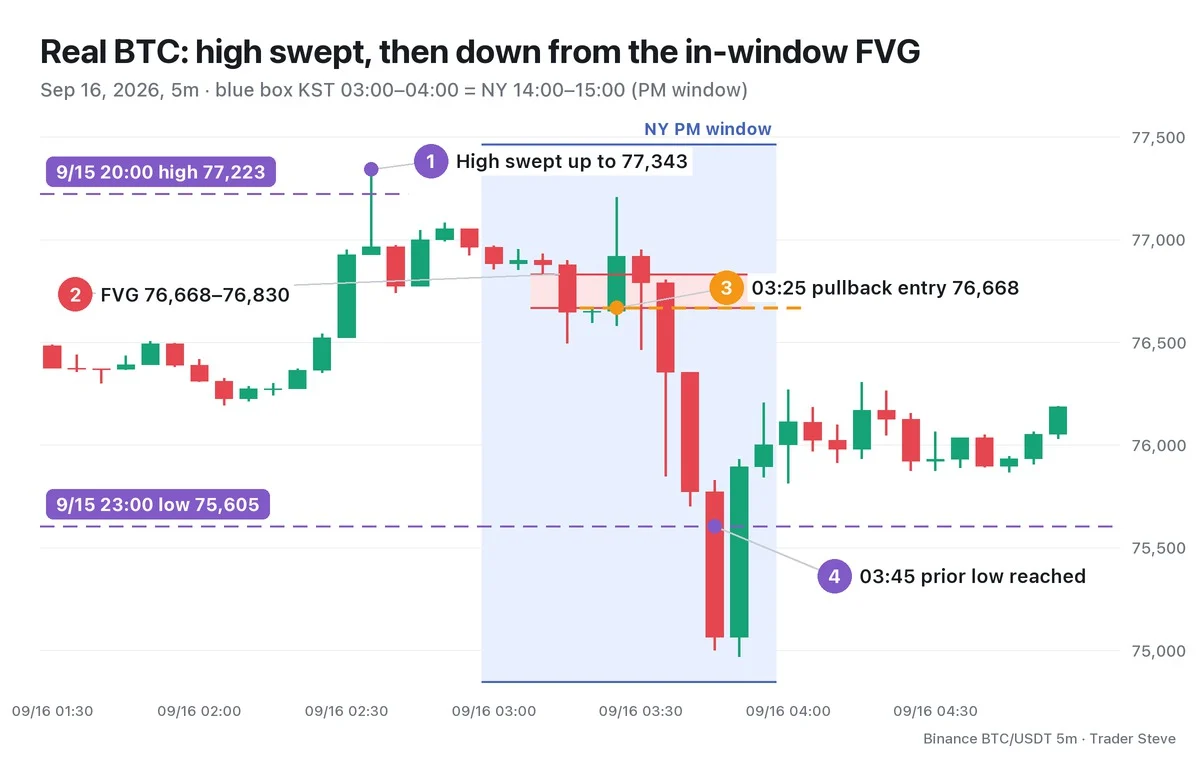
- ① The high of the 20:00 1-hour candle on Sep 15 was 77,223.32. Just before the window, at 02:35 (13:35 New York), price rose to 77,343.44 and swept that high.
- ② After the window opened, the 03:10, 03:15 and 03:20 candles formed a bearish FVG (76,668.45–76,830.00).
- ③ At 03:25, price came back to the lower edge of the FVG (76,668.45). That candle spiked to 77,205.39, just under the swept high, before coming back down. Even when the entry spot is right, the swings can be large.
- ④ At 03:45, price broke the Sep 15 23:00 low of 75,605, and at 03:50 it fell to 74,967.97.
With the stop above the swept high (77,343.44), the risk per trade (1R, the distance from entry to stop) is 674.99 (0.88%). The opposite liquidity was 1.58R away, and 2R (75,318.47) was reached on the same 03:45 candle. Part 3 covers how to choose the entry, stop and target in detail.
5. What to Watch When Applying It to Crypto
The Silver Bullet was originally built for index futures such as the Nasdaq and S&P. Keep a few things in mind when you carry it over to crypto.
- A 24-hour market: crypto has no open or close. The time windows still matter because, as the statistics above show, moves cluster around the US open.
- Skip weekends: there is no New York session on Saturday or Sunday. Look for the Silver Bullet on weekdays only.
- Daylight saving time: from Nov 1, every KST time moves one hour later. Update your alarms too.
- The hours that move the most are the hours that sweep the most: a high-volatility window is both an opportunity and a trap.
That last point is what I said on a live stream ahead of a Monday night:
"Since it's Monday, things have built up over the weekend, and even if we get some movement in the Asian session this morning, tonight when the Nasdaq opens there's a very high chance of a real … move. … Don't force a position. I'm telling you, don't go averaging down recklessly just because it looks like it's bouncing." — Trader Steve, live stream, Oct 19, 2026 (translated from Korean) · ▶ Watch the stream highlights (Korean audio)
You don't enter just because the window is open. You only build a plan when the sweep, displacement and FVG appear inside the window, in that order. The full picture of sessions and kill zones is covered separately in ICT Sessions and Kill Zones (related lesson). The hourly statistics in section 3 use a sample of 66 weekdays (66 one-hour candles per hour), so they are a separate calculation over a different period from the 148-weekday statistics in Part 1 of that topic. That's why the figures differ slightly.
Key Takeaways
- The Silver Bullet is a time-based setup built from a fixed one-hour window + a sweep + an FVG inside the window + the opposite liquidity.
- The windows are 03:00–04:00, 10:00–11:00 and 14:00–15:00 New York time. In Korea that is 16:00, 23:00 and 03:00 (each one hour later from Nov 1).
- In real weekday BTC statistics, the hour that moved the most was 23:00 KST (the New York AM window).
- A time window is a filter, not a direction signal. The hours that move the most are also the ones most likely to sweep you out.
In Part 2, we'll cover the step-by-step order for finding a Silver Bullet on a chart, plus a checklist for which cases count as "invalid."
Checking this by hand in every window takes time. The Omnisight Report, which lays out entry zones, stops and targets for each market, can save you some of that time.
This lesson adapts the text, figures and live-stream quotes of the Trader Steve TA series for the web, translated from the original Korean. Check the text and figure captions for the timing and interpretation of each real example, and read conceptual diagrams and real charts separately.
Corrections: support@omnisight.report


