
What Is SMT Divergence? When Bitcoin and Ethereum Disagree at a Swing
Historical examples for learning · not current prices or trade recommendations.
Contents
Bitcoin (BTC) prints a new low, while Ethereum (ETH) stops above its previous low. If you've ever put the two charts side by side, you've probably seen this at least once. In ICT, this disagreement is called SMT divergence (Smart Money Technique divergence, SMT). This lesson uses charts to explain what SMT is and why a split between two assets that normally move together is read as a signal.
1. The One-Line Definition: Two Assets That Move Together, Only One Breaks the Level
SMT is when two highly correlated assets behave differently at swing highs or lows made at the same time. One breaks past its previous high (or low); the other fails to.
Three conditions matter here.
- A pair: the two assets must normally move in the same direction. In crypto, the classic pair is Bitcoin (BTC) and Ethereum (ETH); in stocks, Nasdaq-100 futures (NQ) and S&P 500 futures (ES). Index futures are also what ICT mostly used when he first explained SMT.
- The same time: you compare highs and lows that formed in the same time window on both assets. Comparing highs three days apart is not SMT.
- Only one: if both break the level, or neither does, they simply moved together. It's SMT only when they split.
The name contains "divergence," but it is not the same as Relative Strength Index (RSI) divergence. RSI divergence compares price with an indicator within one asset; SMT compares the price of one asset with the price of another. The difference between the two is covered separately in Divergence vs. SMT (related lesson).
2. Bullish SMT and Bearish SMT
SMT comes in two types, depending on which extreme the split happens at.
| Type | Where | Asset A | Asset B | How to read it |
|---|---|---|---|---|
| Bullish SMT | at the lows | drops below the previous low, making a lower low (LL) | stops above the previous low (HL) | the decline may be losing strength |
| Bearish SMT | at the highs | rises above the previous high, making a higher high (HH) | stops below the previous high (LH) | the rally may be losing strength |
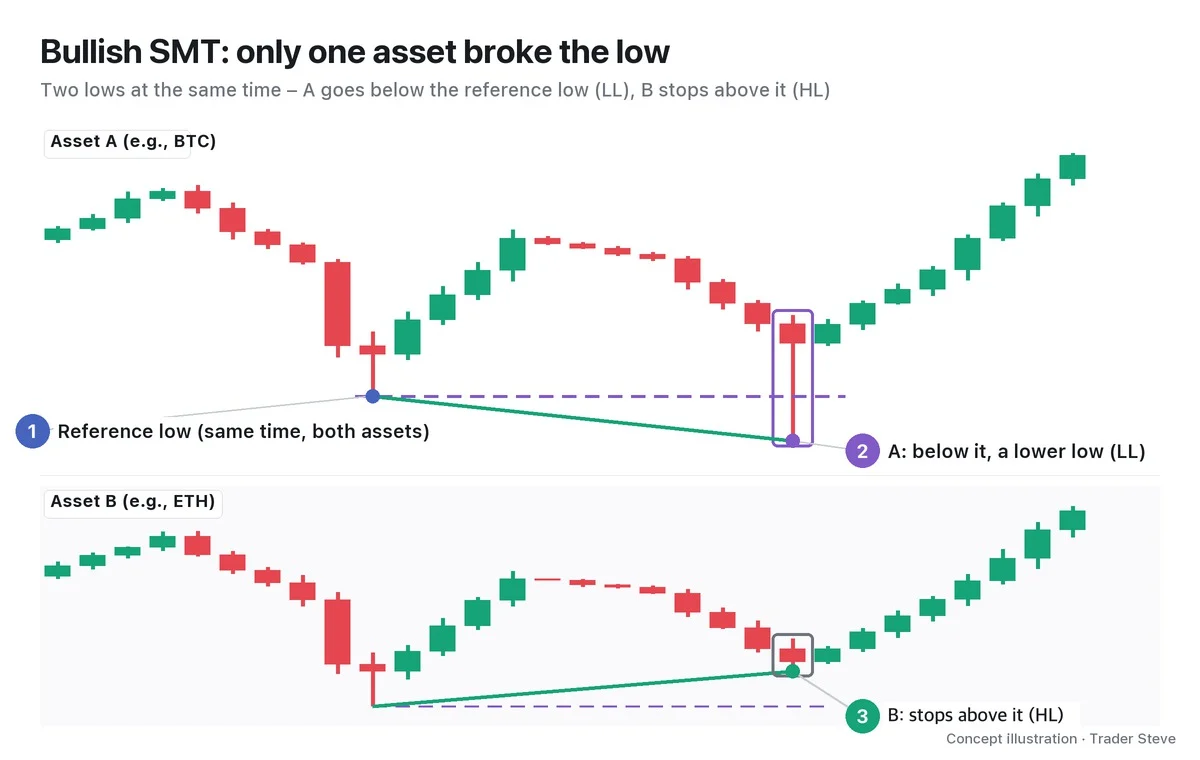
The top panel is asset A, and the bottom panel is asset B. The two move in the same shape and split only at the second low. A broke below its first low (the purple dotted line), while B turned around without even reaching its first low. The green lines slope in opposite directions: down for A, up for B. That is a bullish SMT.
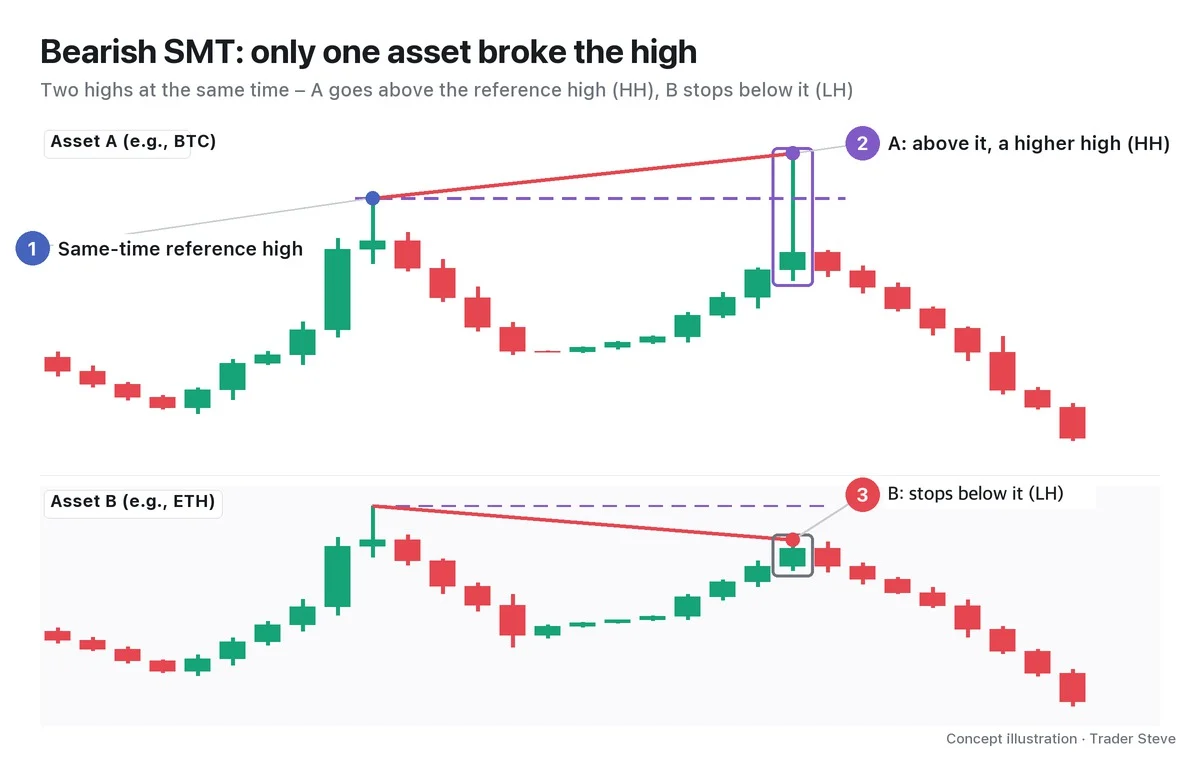
The asset that held its low (or high) is often called the stronger side, and the one that didn't is the weaker side. In a bullish SMT, the one to watch is B, which held its low; in a bearish SMT, it's B, which failed to break the high. Which asset to trade is covered in Part 3.
3. Why Look at a Pair: The Same Money Moves Both
The reason to put Bitcoin and Ethereum side by side is that both ride the same flow of money. When money flows into the crypto market as a whole, both go up; when it flows out, both go down.
"Does Solana move on its own? No. In the end, the leaders like Bitcoin and Ethereum have to set the mood for the whole market. A narrative that money is coming into crypto has to take shape — only then does price go up or not." — Trader Steve, live stream, Sep 21, 2026 (translated from Korean) · ▶ Watch the stream highlights (Korean audio)
On my live streams, I often say, "Bitcoin has to go first; only then do Ethereum and the other alts follow." Much of the money that moves altcoins is borrowed against Bitcoin as collateral, so Bitcoin has to hold up for that money to grow and for buying to reach the alts. Because they are tied to the same source of money, they usually make their highs and lows at about the same time.
That's also why, when the two show clearly different structures, it's worth pointing out.
"Structurally, Bitcoin and Ethereum are completely different right now. Ethereum broke through this structure. … Bitcoin hasn't broken through yet. It hasn't broken the structure yet, and the way I see it, the structure is still developing in a form where it can't push through." — Trader Steve, live stream, Aug 25, 2026 (translated from Korean) · ▶ Watch the stream highlights (Korean audio)
I didn't call it SMT, but the starting point of the idea is the same. If only one of two assets that always move together crosses a level, that difference is information in itself.
4. Why It's a Signal: Only One Side Swept the Stops
ICT's explanation starts from liquidity. Below an obvious low sit sell orders from traders who use that low as their stop — sell-side liquidity (SSL). Similar stops build up below Bitcoin's low and below Ethereum's low from the same time.
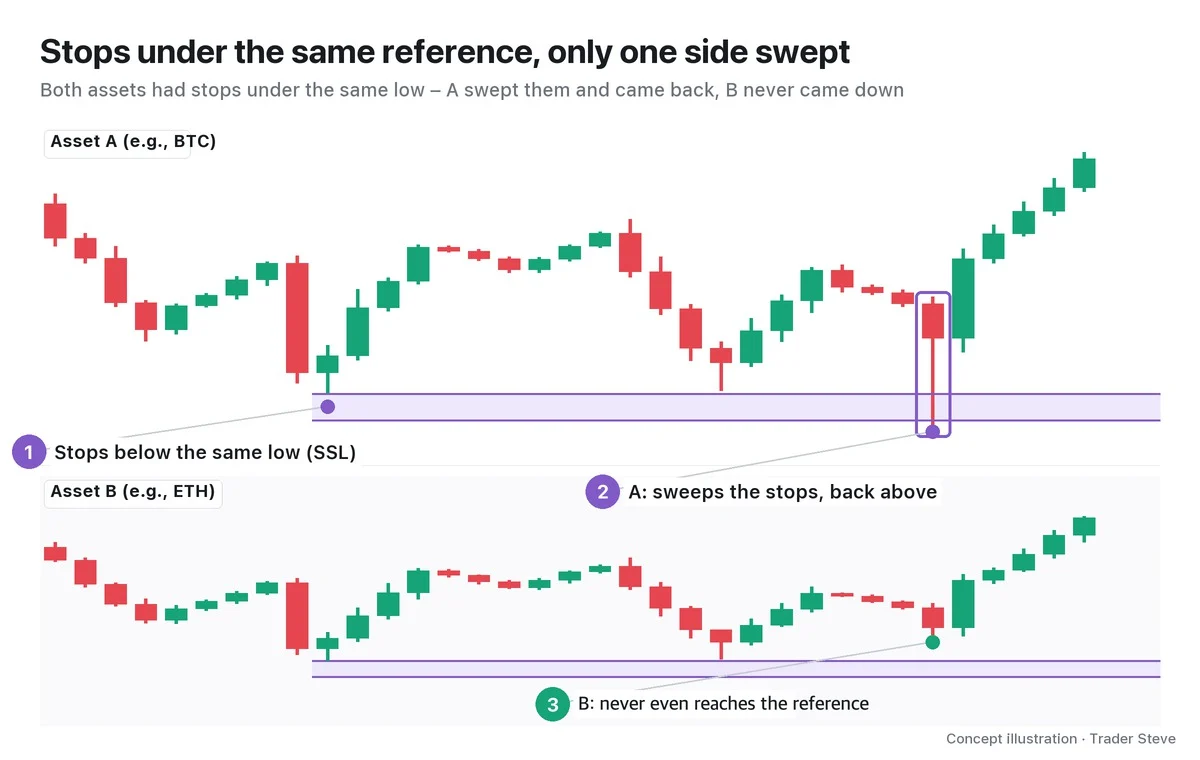
If selling had really been strong enough to drag the whole market lower, both assets' stops should have been triggered together. Instead, only A poked below the reference, and B never came near it. ICT calls this a crack in correlation and reads A's new low as closer to a move that swept one asset's stops than a sign of strength across the whole market. Once the stops have been used up, there is less fuel to keep pushing in that direction — that's the interpretation.
The liquidity that builds above and below reference highs and lows is covered in detail in ICT Liquidity (related lesson).
5. A Real Example: The Bullish SMT at the Jun–Jul 2026 Low
Let's check this on real Bitcoin and Ethereum daily charts.
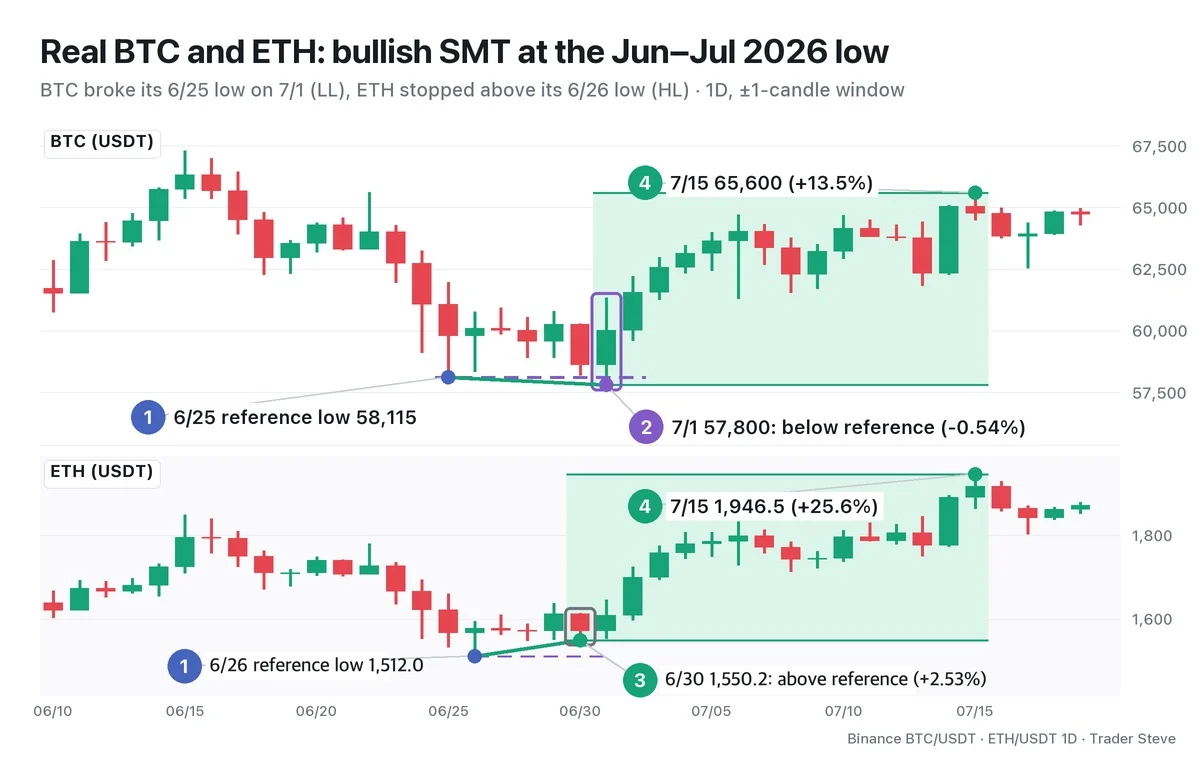
- ① Reference lows: BTC 58,115 on Jun 25, and ETH 1,512.0 one day later, on Jun 26. They are within ±1 daily candle of each other, so I treat them as lows from the same time.
- ② BTC 57,800 on Jul 1: BTC went 0.54% below the reference low, making a lower low (LL). The day before, on Jun 30, its low of 58,201 was still above the reference.
- ③ ETH 1,550.2 on Jun 30: over the same stretch, ETH's low was 2.53% above the reference (HL). Its Jul 1 low of 1,552.9 didn't reach the reference either.
- ④ Afterward: through Jul 19, BTC never broke its Jul 1 low again. On Jul 15, the highs were BTC 65,600 (+13.5% from the Jul 1 low) and ETH 1,946.5 (+25.6% from the Jun 30 low).
It looks just like the textbook drawing. Only BTC swept the stops below the reference, and ETH didn't follow it down. After that, ETH, the side that held its low, rallied more. For a reading of the same Jul 1 low using BTC alone, see ICT Turtle Soup (related lesson).
That said, this is a case picked after the fact, knowing the outcome. SMT is not a standalone signal that tells you direction, but a tool for confirming other evidence. Even after a split, if the side that held later breaks the reference, the SMT is erased — and there have been periods when entering against the move on SMT alone actually performed worse. Part 5 covers, with numbers, how to stack it with location, a structure shift and fair value gaps (FVGs).
Key Takeaways
- SMT is when two assets that move together split at highs or lows made at the same time. Only one breaks past its previous extreme.
- A split at the lows is a bullish SMT (A makes an LL, B an HL); a split at the highs is a bearish SMT (A makes an HH, B an LH).
- It only means something with a pair driven by the same money, like Bitcoin and Ethereum.
- ICT reads one side sweeping the stops while the other doesn't follow as a crack in correlation.
- It's a confirmation tool, not a standalone signal. Always check whether other evidence lines up.
In Part 2, we'll cover how to find SMT on a chart by its conditions, how to choose the pair and the time window, and a checklist for filtering out what isn't SMT.
See the Omnisight Report as well.
This lesson adapts the text, figures and live-stream quotes of the Trader Steve TA series for the web, translated from the original Korean. Check the text and figure captions for the timing and interpretation of each real example, and read conceptual diagrams and real charts separately.
Corrections: support@omnisight.report


