
What Is Turtle Soup? The False Breakdown Below a New Low, Explained
Historical examples for learning · not current prices or trade recommendations.
Contents
Price prints its lowest level in days, and it looks like the floor is about to give way — yet by the time that candle closes, price is back above the prior low. A trade built around this spot is called Turtle Soup (TS). This lesson uses charts to show what Turtle Soup is and why price so often turns around just beyond a new low or a new high.
1. The One-Line Definition: Where a Break to a New Low Fails
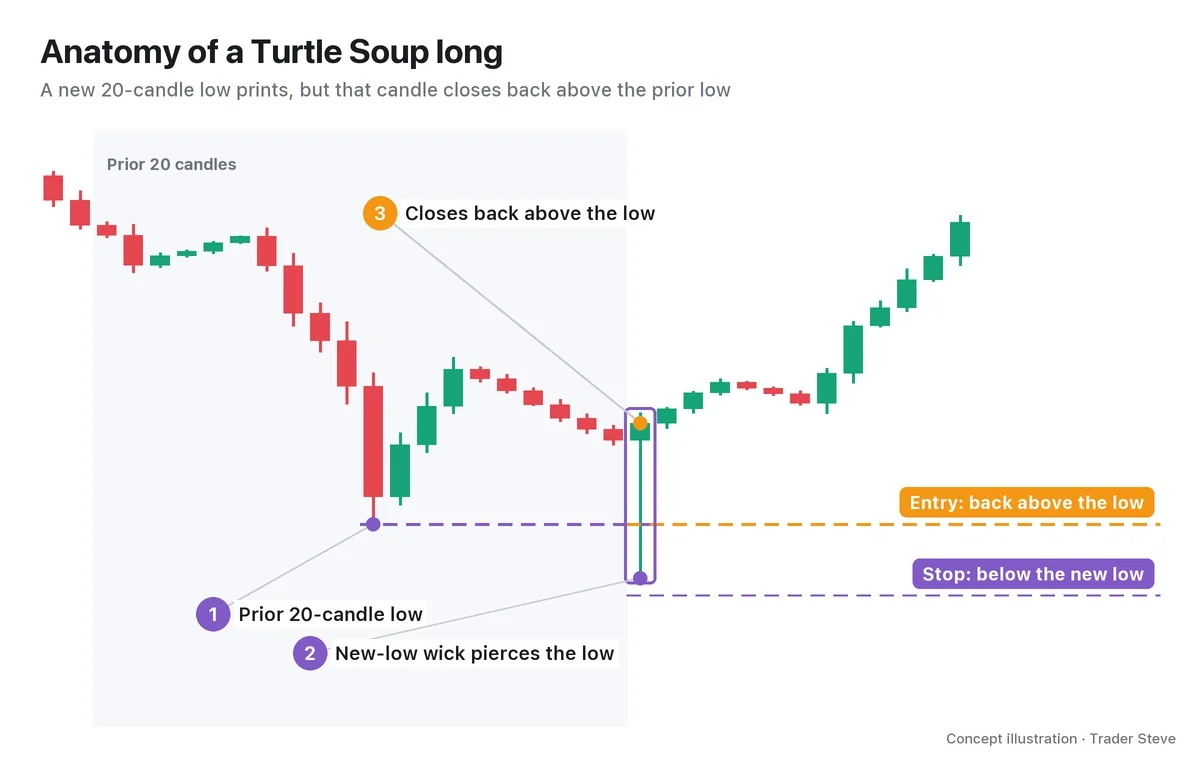
Turtle Soup is a countertrend setup: when price makes a new low of the last N candles (usually 20) and then comes back above the prior low, you treat the breakdown as failed and enter in the opposite direction (a buy). The high side works the same way. If price makes a new 20-candle high and is then pushed back below the prior high, it becomes a sell setup.
- Turtle Soup long: new 20-candle low → back above the prior low → buy
- Turtle Soup short: new 20-candle high → back below the prior high → sell
The key is not "a new extreme printed" but "the new extreme could not hold." If price makes a new low and keeps closing below it on the way down, that is not soup — it is a real breakdown.
Crypto trades 24 hours a day, so when I say "20 days," I count 20 daily candles, each opening at 09:00 KST (Korea Standard Time, UTC+9). On the 4-hour or 1-hour chart, I simply say "20 candles."
2. Where the Name Comes From: The Turtle Traders' Breakout Trade, Reversed
The name comes from a famous experiment in the 1980s. In 1983, Richard Dennis and William Eckhardt recruited a group of beginners and trained them as the Turtle Traders. The backbone of their rules was the Donchian Channel Breakout — trend following that says "buy when price breaks above the 20-day high, sell when it breaks below the 20-day low."
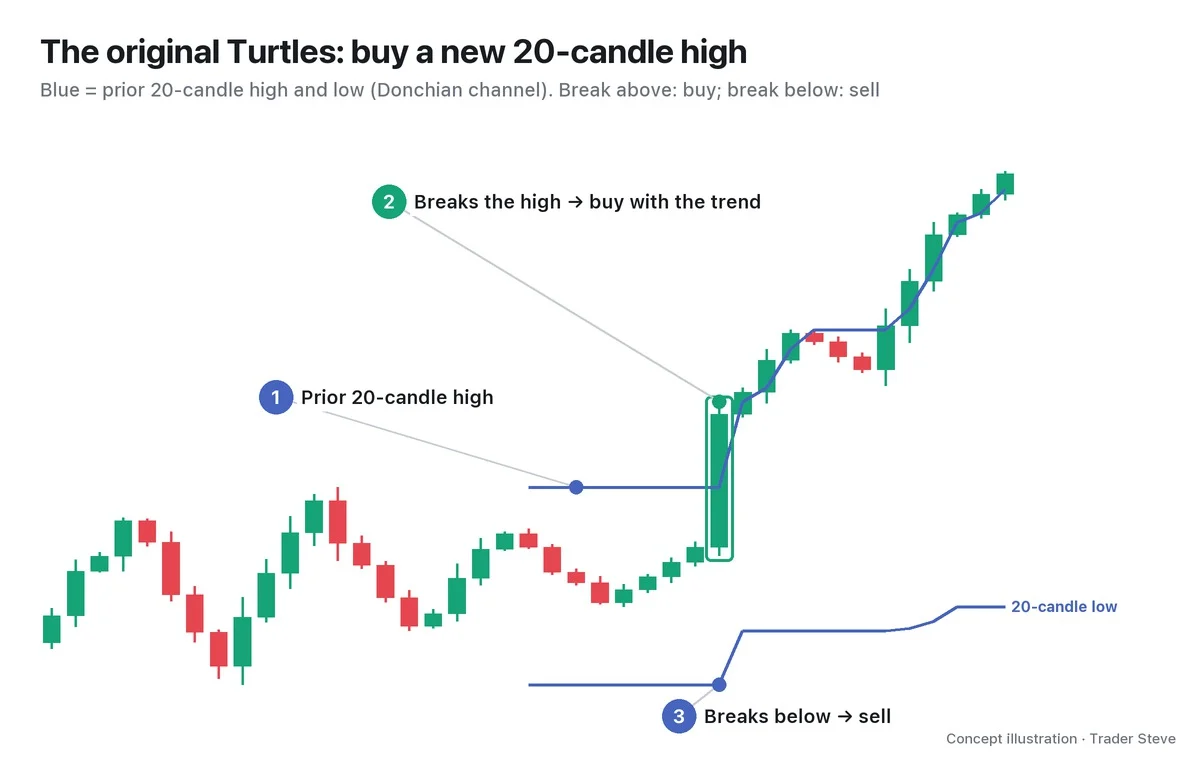
Breakout trading pays off big when it catches a large trend, but many breakouts fail to follow through and quickly fall back inside. In Street Smarts (1995), Linda Bradford Raschke and Laurence Connors laid out rules for trading these failed breakouts in the opposite direction. The name is usually explained as a joke: the breakouts the Turtles chased get cooked into soup. Part 2 walks through the original conditions one by one (20 candles, a prior low at least 4 candles back, where to enter and where to put the stop).
3. Why It Happens: Orders Stacked Below the Prior Low
The prior low is a price everyone is watching. That's why two kinds of sell orders pile up just below it: stop-loss sells from traders who bought above the low, and breakdown sells from traders who plan to "sell if the low breaks." In a leveraged market, the forced-liquidation prices of long positions cluster nearby as well.
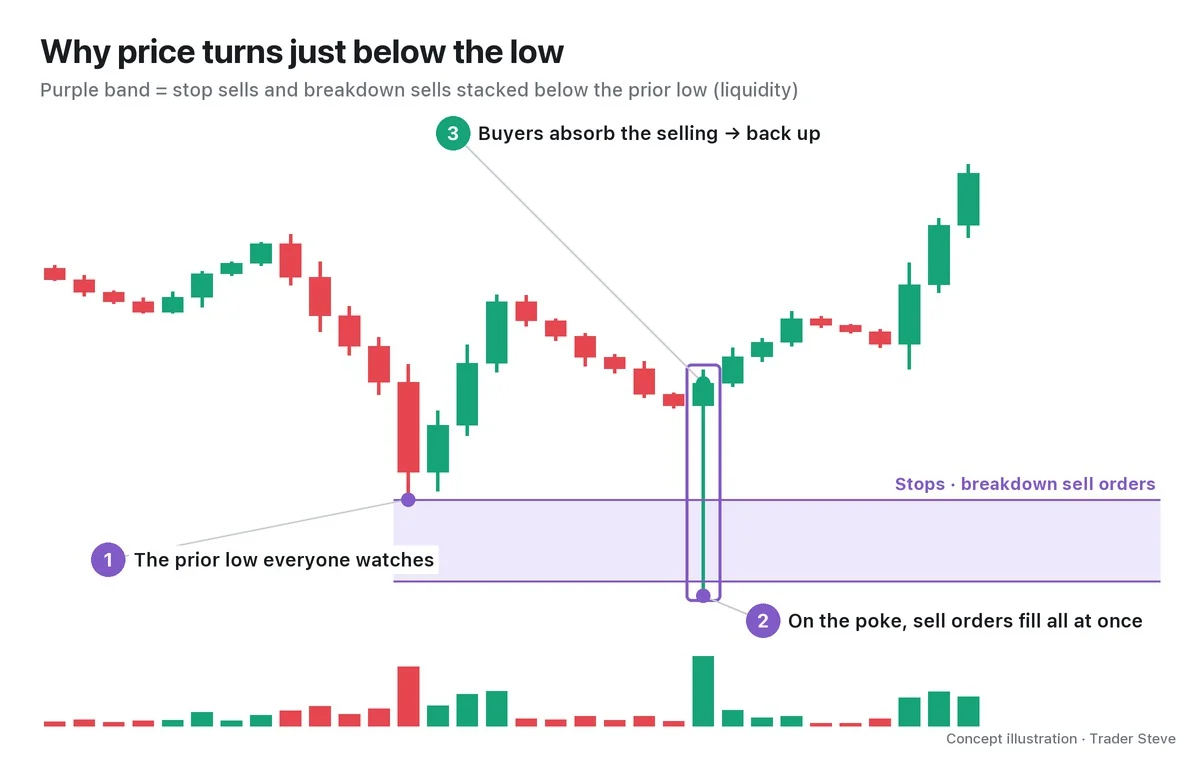
For anyone who wants to buy in size, this spot is an opportunity. Normally, a large buy order pushes price up before it is filled. Below the low, though, stops and liquidations dump sell orders all at once, so a big buyer can get the size they want without driving price much higher. Once the supply to absorb runs out, price returns above the prior low and leaves a long lower wick on the chart. In ICT, this cluster of orders below a low is called sell-side liquidity (SSL), and the one above a high is buy-side liquidity (BSL).
I don't use those names myself, but I described the same thing on a live stream, talking about a moment when Bitcoin briefly stabbed into a pocket of liquidations below and then came back up.
"See where the liquidation volume is sitting here? They put long orders underneath and pushed price down into it. As all of this blows up, a huge amount of forced selling hits right here. They soaked up every bit of that forced selling, and that's how the OI (open interest) went up." — Trader Steve, live stream, Oct 16, 2026 (translated from Korean) · ▶ Watch the stream highlights (Korean audio)
That quote was my reading on the stream at the time. When new buyers take the other side of liquidated longs' selling, existing positions just change hands, so that alone does not increase open interest (OI). For OI to rise, new contracts opened by both sides have to outnumber the ones being liquidated or closed. What Turtle Soup aims for is the direction of that side — the side that absorbed the selling.
4. From the Retail Trader's Side: Shaken Out, Back In, Shaken Out Again
For retail traders on the other side, this spot is a painful memory. Anyone with a stop just below the low gets stopped out at the tip of the wick, and price immediately heads back the original way. Jump back in, and you get shaken out again. Here is how I put it while looking at the chart of SOXL, a 3x leveraged US semiconductor ETF.
"It dumps straight down and breaks the stop-loss line with just the tip of the wick. Then it rips straight up. … Ah, it takes the low again. Everyone's stops get hit, stopped out. And then it pushes right back up." — Trader Steve, live stream, Sep 2, 2026 (translated from Korean) · ▶ Watch the stream highlights (Korean audio)
Turtle Soup is a way of looking at this scene from the other side. Instead of being the one who gets shaken out, you wait for price to come back after the shakeout and position yourself with the side that absorbed the selling.
5. A Real Bitcoin Daily Chart Example
Let's find a near-textbook example on a real Bitcoin daily chart.
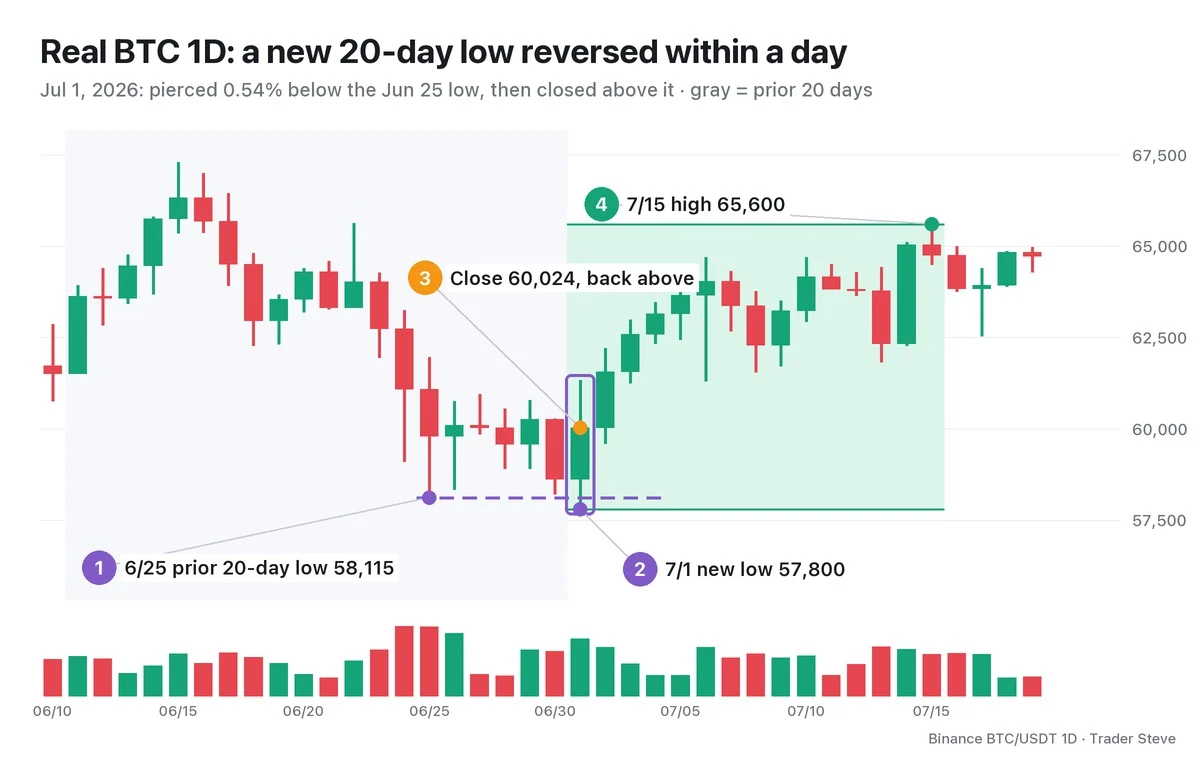
- ① Jun 25 low 58,115: the lowest price of the 20 days before Jul 1 (Jun 11–30), printed 6 candles before Jul 1.
- ② Jul 1 new low 57,800: pierced 0.54% below that low to make a new 20-day low.
- ③ Jul 1 close 60,024: the same day, price closed back above the prior low. The new-low candle itself reclaimed the level — the classic shape of a Turtle Soup long.
- ④ Jul 15 high 65,600: through Jul 19, the Jul 1 low was not broken again, and price rose 9.3% from the Jul 1 close to this high.
This is a picture seen in hindsight. The same shape can just as easily collapse, and Part 4 examines failed cases like that using the same criteria.
6. A Caution: Not Every New Low Is Soup
Turtle Soup is a countertrend setup, so it is often wrong. If price closes below the prior low with its body, not just its wick, and the next candle can't come back either, it is a real breakdown. Buy every new low inside a strong downtrend, and all you collect is stop-outs. That's why, in practice, you also check "where the new low formed (is it in a higher-timeframe discount zone?)" and "does structure change after price comes back?" Part 5 covers common mistakes and confirmation evidence.
Boiled down to one line from an ICT perspective, Turtle Soup is a trading rule for riding the move in reverse after price takes out the SSL below a low (or the BSL above a high) once and comes back. Where liquidity builds up is covered in ICT Liquidity (related lesson), and the sweep event itself in ICT Liquidity Sweeps (related lesson).
Key Takeaways
- Turtle Soup is a countertrend setup that enters in the opposite direction when a new 20-candle low (or high) can't hold and price comes back inside the prior extreme.
- The name comes from trading against the rules of the Turtle Traders, who followed 20-day breakouts.
- Stops, breakdown sells and liquidation orders stack up below the prior low, and the side that absorbs them pushes price back.
- It's soup only if the wick pierces and the candle closes back inside; a body break and close beyond the level is a real breakdown.
- Not every new low is an opportunity. You need both the right location and confirmation.
In Part 2, we'll turn the original conditions (20 candles, 4 candles, a close back inside) into a checklist and separate TS, which reclaims on the new-low candle itself, from TS+1, which reclaims on the next candle.
Checking all this by hand across several markets every day takes real time. The Omnisight Report lays out these liquidity levels and structures for each market.
This lesson adapts the text, figures and live-stream quotes of the Trader Steve TA series for the web, translated from the original Korean. Check the text and figure captions for the timing and interpretation of each real example, and read conceptual diagrams and real charts separately.
Corrections: support@omnisight.report


