
What Is Wyckoff Accumulation? An Overview of Phases A–E
Historical examples for learning · not current prices or trade recommendations.
Contents
As a long decline runs out of steam, the chart often drifts sideways for a while in a dull range. Wyckoff called the process of big players building a position inside that dull range accumulation, and he read it in five phases — from the formation of the range to the trend that carries price out of it. Phase E is the markup that has already left the range. This lesson explains what accumulation is, why it shows up as a range, and what each of Phases A–E does, all on a single map.
All dates and times are Korea Standard Time (KST, UTC+9). A daily candle is dated by its 09:00 KST open; intraday extremes are identified by their KST date and time.
1. The One-Line Definition: A Range Where Big Players Absorb Supply After a Long Decline
Accumulation is the stretch after a long decline where big players (the Composite Man, in Wyckoff's terms) absorb exhausted selling inside a range. That range is called a trading range (TR). On the live stream, I use "accumulation" and its Korean equivalents interchangeably.
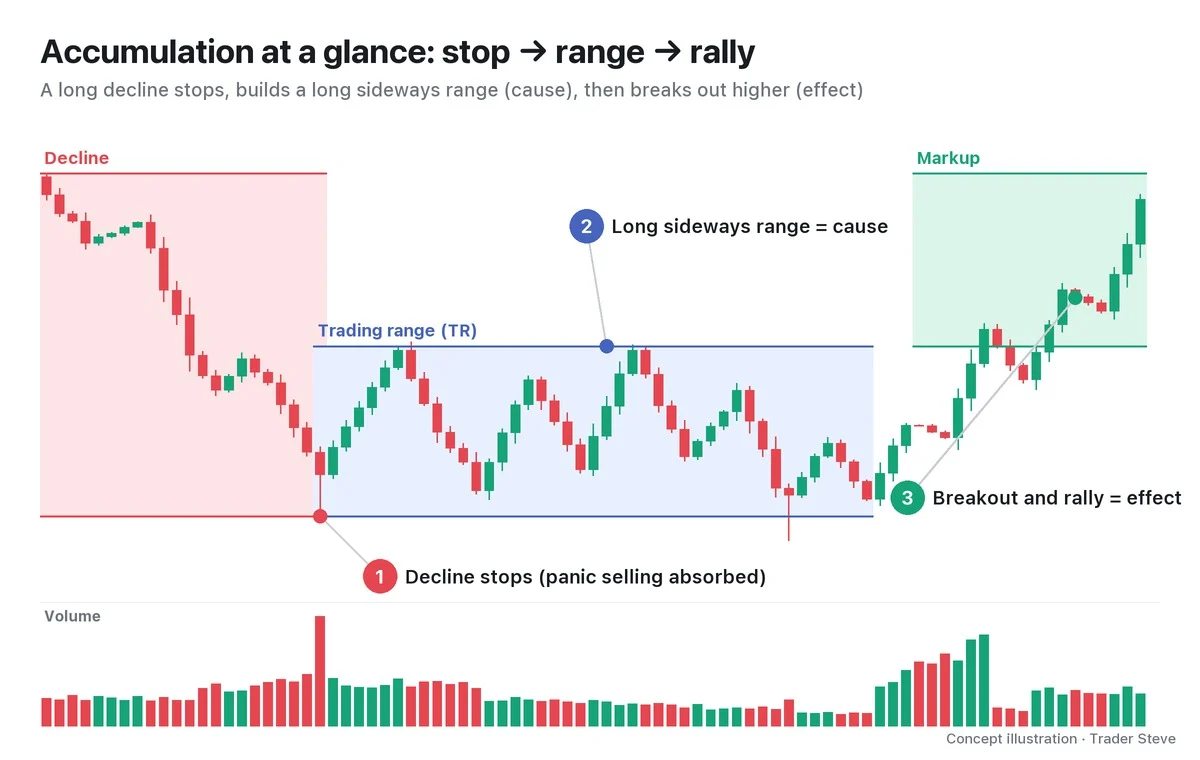
As the chart shows, accumulation plays out in three scenes. The falling price stops on heavy volume (①), spends a while moving up and down inside a range (②), and finally breaks out above the range and rallies (③). The most intuitive explanation of why big players put so much work into this zone is one I gave on a live stream.
"If price just keeps going up, the big players now have to buy a lot at high prices. So where did the big players want to buy? The accumulation zone is right here. They shook price because they wanted to fill more in this zone, but …" — Trader Steve, live stream, Oct 22, 2026 (translated from Korean) · ▶ Watch the stream highlights (Korean audio)
2. Why It Becomes a Range: You Can't Buy Big and Cheap While Pushing Price Up
Big players need to buy far more than any individual trader. If they bought all of it at once with market orders, the buying itself would drive price up, and every later fill would cost more. So they keep price pinned inside a band for a long time: they shake it lower to collect what frightened holders dump, and when it rises they let it stall. On the chart, that repetition looks like a long sideways range.
Wyckoff called this range the cause and the rally after price leaves it the effect. The more size is built up inside the range — in other words, the longer the range — the bigger the move that follows tends to be. This principle is covered in detail under the law of cause and effect in Wyckoff Three Laws (related lesson).
"Personally, I think the strongest of all the structure-based approaches is Wyckoff. That's just my personal opinion." — Trader Steve, live stream, Sep 4, 2026 (translated from Korean) · ▶ Watch this moment (Short, Korean audio)
3. The Five-Phase Map: Phases A–E
Wyckoff splits accumulation into five phases. Rather than memorizing names, it is easier to read each one as "what is the market doing right now?"
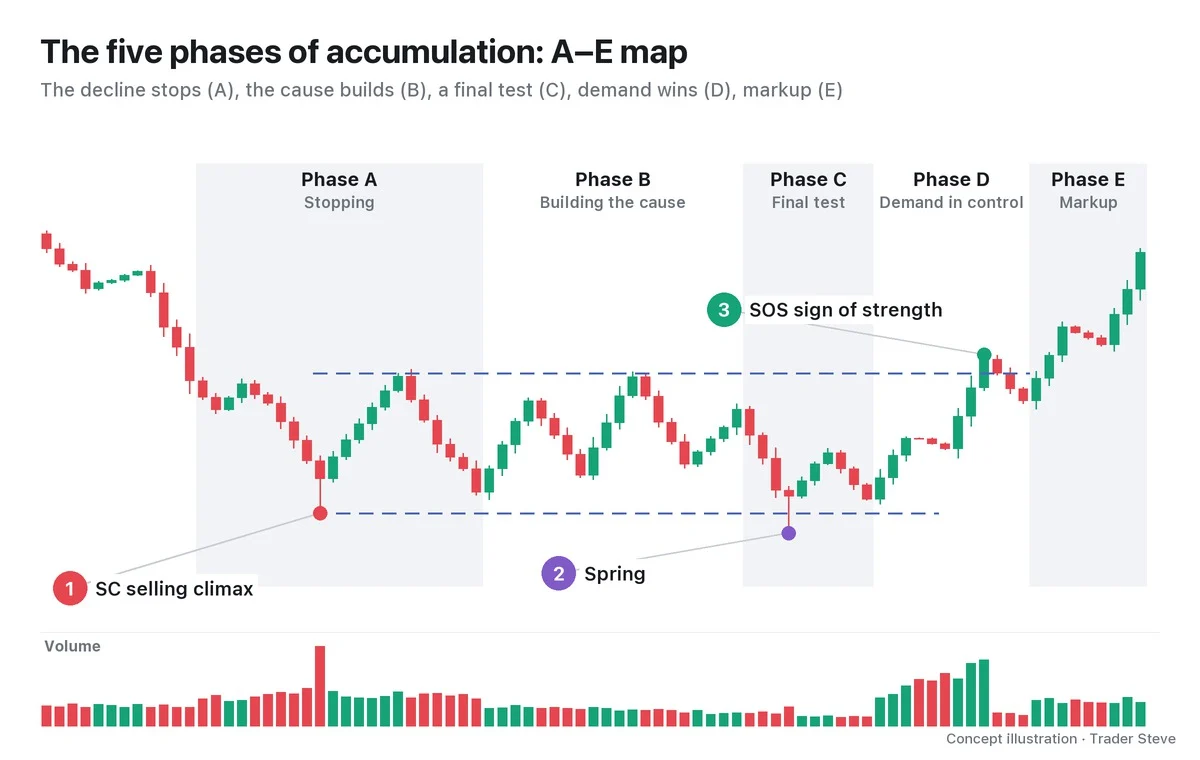
| Phase | What happens | Key events (abbreviations) |
|---|---|---|
| Phase A: Stopping | The decline stops and the range's floor and ceiling are set | PS · SC · AR · ST |
| Phase B: Building the cause | Price moves up and down inside the range for a long time while size is accumulated. The longest phase | Repeated STs · UA |
| Phase C: Final test | The remaining supply and weak hands are shaken out one last time | Spring · Test |
| Phase D: Demand in control | Price makes higher lows and higher highs and clears the top of the range | SOS · LPS · JAC · BU |
| Phase E: Markup | Price leaves the range and trends higher | Repeated LPS and BU |
Let's start with just the three events on the chart. The selling climax (SC) is the panic selling at the end of the decline, and it sets the floor of the range (①). A spring is a brief stab below the bottom of the range in Phase C that quickly comes back inside (②). A sign of strength (SOS) is a rally that clears the top of the range decisively (③). The other abbreviations in the table — preliminary support (PS), automatic rally (AR), secondary test (ST), upthrust action (UA), last point of support (LPS), jump across the creek (JAC) and back-up (BU) — are defined in Part 2.
The version with a spring is called Schematic #1; the version without a spring, where the lows step higher like a staircase, is called Schematic #2. Part 2 covers the rest of the events one by one, along with the criteria that separate #1 from #2.
4. Volume Tells the Story
In Wyckoff, volume matters as much as price. Even within the same range, the way volume changes tells you which phase you are in.
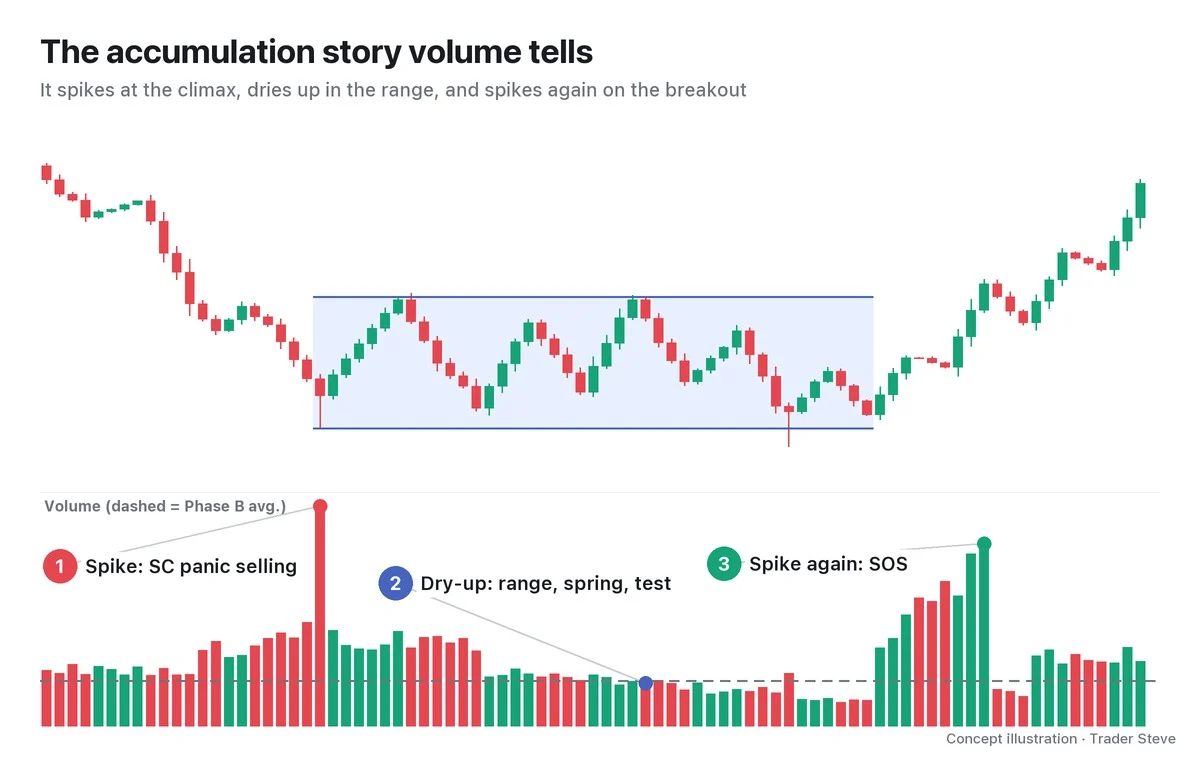
- Spike: volume peaks at the SC. Frightened holders dump all at once, and the volume is the footprint of someone absorbing it.
- Dry-up: volume shrinks as Phase B goes on (the dashed line is the Phase B average). On the spring and the test that follows, volume should also be far below the SC before you conclude that "selling has dried up."
- Spike again: volume expands again on the SOS that clears the top of the range. This time the volume comes from the buyers.
"I build a scenario on Wyckoff's framework and judge whether this is accumulation or distribution, and then judge everything — the volume in that structure, the probabilities, all of it …" — Trader Steve, live stream, Aug 20, 2026 (translated from Korean) · ▶ Watch the stream highlights (Korean audio)
You cannot tell from the shape alone whether a range is accumulation or its opposite, distribution. You also have to check whether volume follows the sequence above.
5. Real ETH: A 74-Day Range After a Plunge
Let's look for a range that resembles accumulation on a real Ethereum (ETH) daily chart. In this part I won't label any events; I'll only look at the shape.
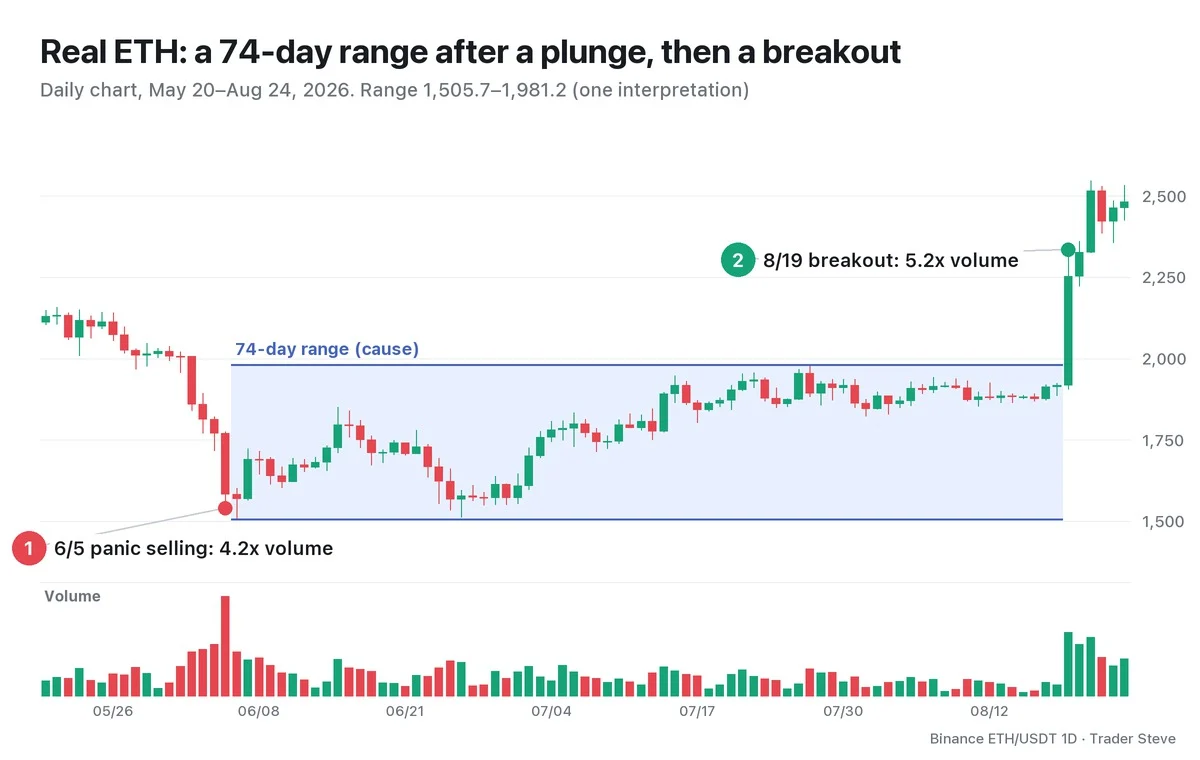
In early June, Ethereum fell sharply for several days. Volume on Jun 5 was 4.2x the average of the previous 20 days, and the decline stopped the next day, Jun 6, at a low of 1,505.7. Price then moved sideways for 74 days between 1,505.7 and 1,981.2 (a range about 31.6% tall, measured from the low). On Aug 19, with volume spiking to 5.2x the previous 20-day average, price closed at 2,252.8, the first close above the top of the range at 1,981.2.
Spike (Jun 5) → dry-up (inside the range) → spike again (Aug 19). It is the same sequence as the volume story in Section 4. Labeling the phases this way, however, is one interpretation, made in hindsight. While the range is still forming, you cannot know whether it is accumulation or just a pause before the next leg down. Part 4 labels the events in this range one by one.
The larger cycle that contains accumulation (accumulation–markup–distribution–markdown) continues in Wyckoff Market Cycle (related lesson), and the story from the big players' side continues in Wyckoff Composite Man (related lesson).
Key Takeaways
- Accumulation is the stretch after a long decline where big players absorb exhausted selling inside a range.
- Buying big and cheap means you can't push price up, so it forms a range. The range is the cause; the rally that follows is the effect.
- Read it in order: Phase A stopping → B building the cause → C final test → D demand in control → E markup.
- Check whether volume follows the sequence spike → dry-up → spike again.
- Phase labels are an interpretation. Only when price leaves the range and holds is it confirmed as accumulation.
In Part 2, we'll cover the definition of each event, from PS, SC, AR and ST to the spring, SOS and LPS, and the criteria that separate Schematic #1 from #2.
Checking the events and volume inside a range by hand for every market takes real time. If you want an analysis that pulls several theories together in one place, see the report below.
This lesson adapts the text, figures and live-stream quotes of the Trader Steve TA series for the web, translated from the original Korean. Check the text and figure captions for the timing and interpretation of each real example, and read conceptual diagrams and real charts separately.
Corrections: support@omnisight.report


