
What Is an AR in Wyckoff? Automatic Rally and Automatic Reaction Explained
Historical examples for learning · not current prices or trade recommendations.
Contents
After a big decline ends in panic selling, a chart that looked like nobody would ever buy it again often pops higher within a few days. In Wyckoff, that first bounce is called the automatic rally (AR). The mirror image — the first drop that comes on its own at the end of a big advance — is called the automatic reaction (AR). This lesson uses charts to show what an AR is, why it comes "automatically" right after a climax, and why its peak becomes the upper boundary of the range that follows.
All dates and times are Korea Standard Time (KST, UTC+9). A daily candle is dated by its 09:00 KST open; intraday extremes are identified by their KST date and time.
1. The One-Line Definition: The First Countermove After a Climax
An AR is the first move in the opposite direction right after a climax.
- In accumulation (a bottom being built), it is the first bounce after the selling climax (SC) — the capitulation candle where fearful selling pours out all at once.
- In distribution (a top being built), it is the first drop after the buying climax (BC) — the candle where chasing buyers pile in all at once.
The key word is "first." Price may bounce several times, but the AR is the first meaningful bounce, and only that one. I once pointed out this exact moment on a live stream while looking at a different market's chart:
"So by Wyckoff's standards, this is where the selling climax comes in and then the automatic rally comes in. It just bounces right back up, right?" — Trader Steve, live stream, Oct 16, 2026 (translated from Korean) · ▶ Watch the stream highlights (Korean audio)
"Bounces right back up" captures the character of the AR well. It isn't someone shoving price higher; it's something that was pressed down springing back.
2. The AR in Accumulation (Automatic Rally) and in Distribution (Automatic Reaction)
Both go by the same abbreviation, AR, which makes them easy to mix up. Throughout this series, I'll keep them apart by writing "the AR in accumulation (automatic rally)" and "the AR in distribution (automatic reaction)."
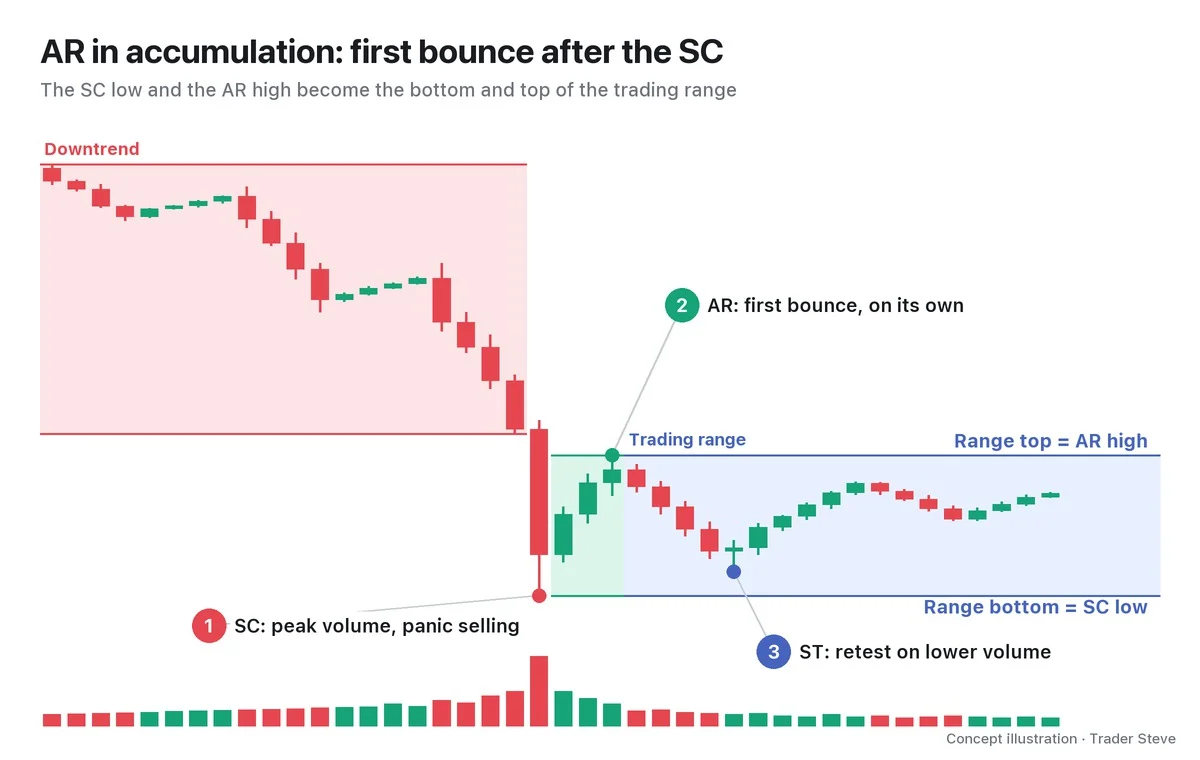
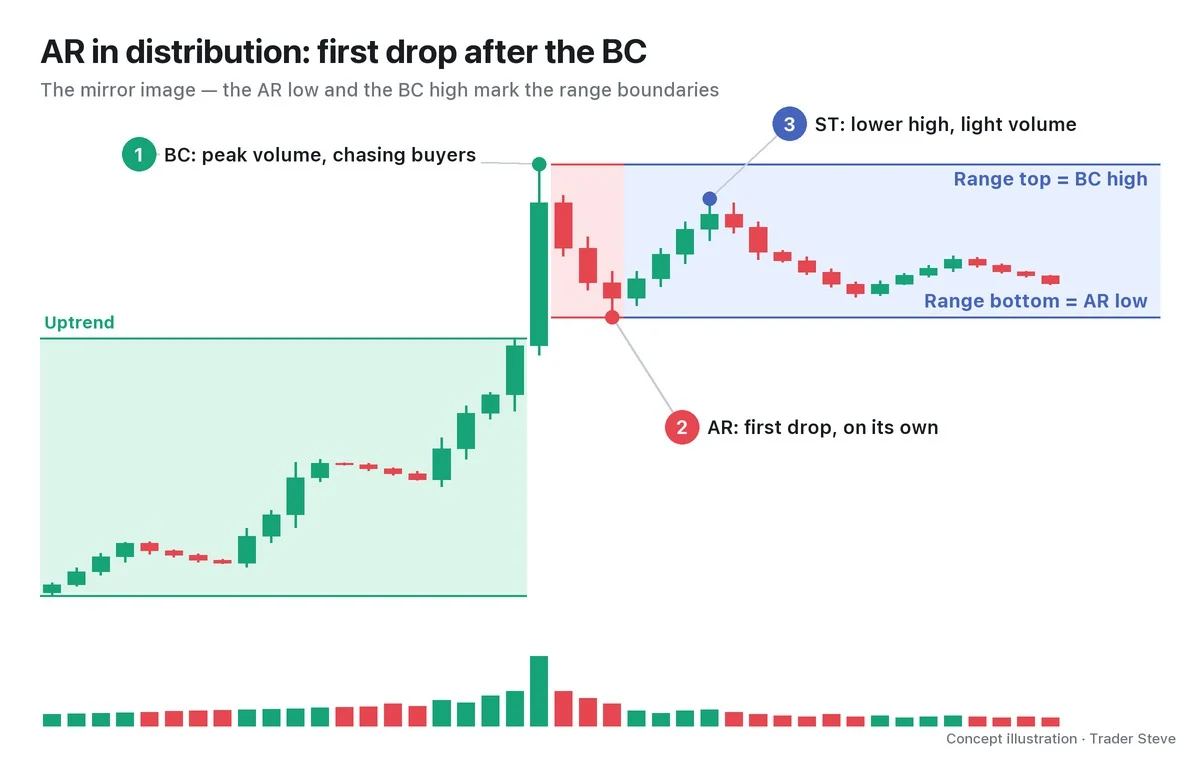
| AR in accumulation (automatic rally) | AR in distribution (automatic reaction) | |
|---|---|---|
| Event just before | Selling climax (SC) | Buying climax (BC) |
| Direction | Bounces up | Drops down |
| Boundary it sets | AR high = top of the range | AR low = bottom of the range |
| Range | SC low to AR high | AR low to BC high |
| Volume | Usually smaller than the SC | Usually smaller than the BC |
3. Why "Automatic": Sellers Temporarily Run Out
On the SC candle, stop-losses, forced liquidations and panic selling all hit at once — and big players absorb that supply. The result is a market where, for the moment, almost nobody is left who wants to sell right now.
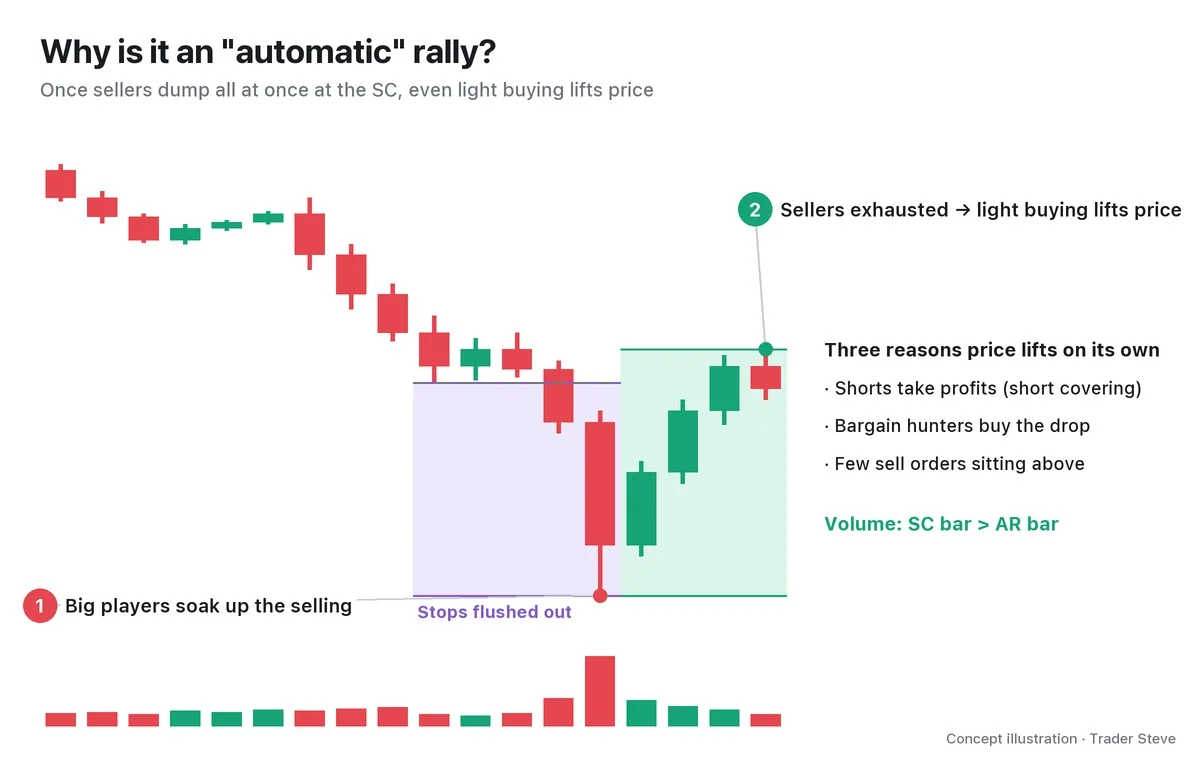
In that state, price can rise easily even without heavy buying. There are three reasons.
- Shorts taking profits (short covering): traders who bet on the decline buy back to lock in their gains, and that is buying.
- Bargain buying: after a steep drop, some traders see value and buy a little at a time.
- Thin offers: there are few sell orders resting above, so even modest buying moves price up several ticks at a time.
That is why volume during the AR is usually smaller than at the SC. The move (price) is large relative to the effort behind it (volume). This "effort vs. result" view is covered separately in Wyckoff Effort vs. Result (related lesson). Distribution is an exact mirror: once all the chasing buyers are in at the BC, nobody is left to buy, and profit-taking by earlier buyers alone is enough to push price lower on its own.
4. Its Place in Phase A: Evidence of a "Stop," Not a "Reversal" Signal
Wyckoff divides accumulation into phases. The AR sits in the first one, Phase A, and the usual sequence is:
Preliminary support (PS) → selling climax (SC) → automatic rally (AR) → secondary test (ST)
Distribution runs preliminary supply (PSY) → BC → automatic reaction (AR) → ST. Phase A is the phase where the prior trend stops. So the AR is only the first evidence that "the decline has stopped," not a signal that "price has now turned into an uptrend." An explanation I gave while looking at another market's daily chart contains this exact sequence:
"This is where the biggest selling volume exploded. It's what you'd call a selling climax. The selling climax came in, and so a strong … recoil followed. … It shot up really hard. And after that, it couldn't keep going up and just dumped straight back down." — Trader Steve, live stream, Sep 13, 2026 (translated from Korean) · ▶ Watch the stream highlights (Korean audio)
Even after shooting up hard, price "couldn't keep going up" and came back down. That is the ST that follows the AR. If you read the AR as a reversal signal and chase it at the peak, this pullback is exactly what you walk into.
5. A Real BTC Daily Chart: The February 2026 Automatic Rally and Range
Let's check it on a real Bitcoin (BTC) chart. The event names (SC, AR, ST) are an interpretation of the chart.
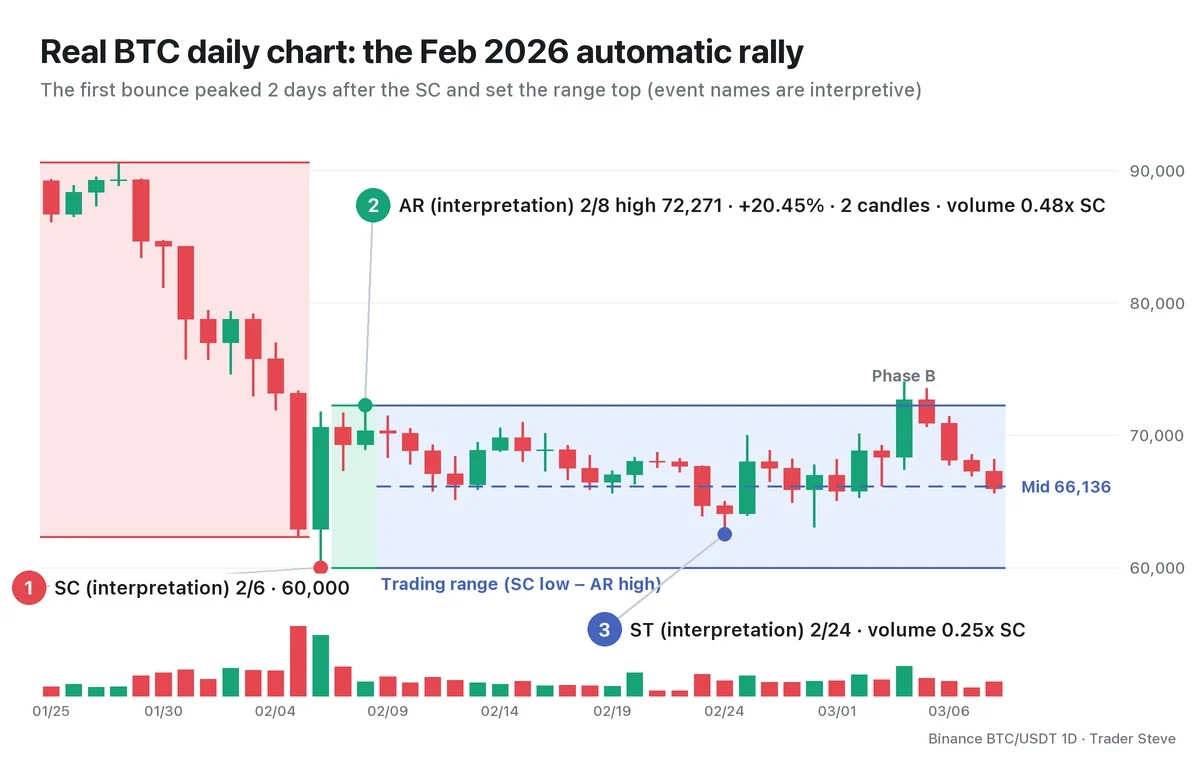
The decline that started from the 97,924 high on Jan 14 ran into a large bearish candle on Feb 5 with volume 5.08x the average of the previous 20 candles, and bottomed at the 60,000 low on Feb 6 (−38.7% from the high). The Feb 6 candle also carried 3.61x average volume, yet it closed at 70,580, 17.6% above its low. In effect, the AR had already started inside the SC candle.
Price then climbed to the 72,271 high on Feb 8 — +20.45% from the SC low in just 2 candles. The largest volume during this bounce was 0.48x the SC candle. Volume fell by more than half while price jumped more than 20%. That fits a bounce "with sellers exhausted." The bounce retraced 32.4% of the preceding decline.
When the 65,756 low on Feb 11 retraced more than half of the bounce, the Feb 8 high was confirmed as "the peak of the first bounce." Later, the ST came at the 62,510 low on Feb 24 (4.18% above the SC), on volume of 0.25x the SC.
The most important thing the AR leaves behind is the opposite boundary of the range. With the SC low as the lower boundary and the AR high as the upper boundary, you get the trading range (TR). In this case it runs 60,000–72,271, with a midpoint of 66,136. From Feb 9 through the end of the month, price moved only inside this range.
This range becomes the reference for reading Phase B. A move like the 74,050 high on Mar 4 — above the AR high, then back inside the range the next day — can only be interpreted because the range is there. The AR is used to set the range boundaries and price height. The size of the cause in point-and-figure (P&F) terms is measured separately, by the number of columns across that range (see Wyckoff Point-and-Figure Count, wyckoff/pnf-count).
In the same 2026 BTC data, the larger range is read from the Feb 6 SC and the smaller one from the Jun 5 SC. For the periods, boundaries, update rules and confirmation conditions, see the shared range reference table in Wyckoff Accumulation Phases Part 4.
Key Takeaways
- An AR is the first countermove right after a climax (SC or BC). In accumulation it is an automatic rally; in distribution, an automatic reaction.
- It comes on its own because sellers (buyers, in distribution) are temporarily exhausted at the climax, so its volume is usually smaller than the climax.
- The AR peak (the trough, in distribution) becomes the opposite boundary of the range.
- The AR is evidence that the trend has stopped, not a signal that it is reversing. An ST usually comes next.
In Part 2, we'll set a single rule for which candle marks the AR peak and show how to draw the range from that line. For the climaxes themselves, see Wyckoff Selling Climax (related lesson) and Wyckoff Buying Climax (related lesson); for the full sequence, Wyckoff Accumulation Phases (related lesson) and Wyckoff Distribution Phases (related lesson); and for the underlying law of supply and demand, Wyckoff Three Laws (related lesson).
Finding the climax, measuring the AR and drawing the range by hand for every market takes real time. The Omnisight Report organizes this kind of Wyckoff structure alongside the other theories.
This lesson adapts the text, figures and live-stream quotes of the Trader Steve TA series for the web, translated from the original Korean. Check the text and figure captions for the timing and interpretation of each real example, and read conceptual diagrams and real charts separately.
Corrections: support@omnisight.report


