
What Are the Creek, JAC and BU? How Breakouts and Back-Ups Work
Historical examples for learning · not current prices or trade recommendations.
Contents
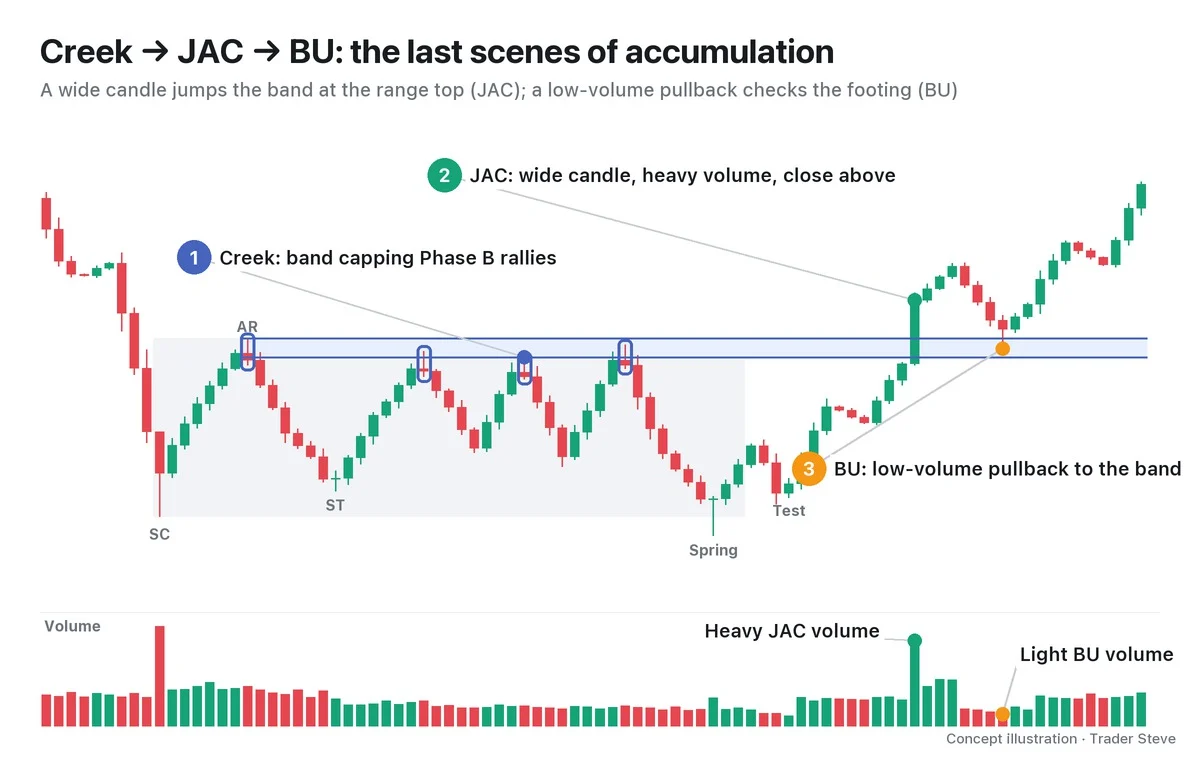
As an accumulation range nears its end, Wyckoff watches for three scenes in order: the creek, a band of resistance at the top of the range; the jump across the creek (JAC), a forceful move across that band; and the back-up (BU), a step back after the crossing to check the footing. This lesson explains what the three scenes are and why old resistance turns into support, using diagrams and a real Ethereum (ETH) chart.
All dates and times are Korea Standard Time (KST, UTC+9). A daily candle is dated by its 09:00 KST open; intraday extremes are identified by their KST date and time.
1. The One-Line Definitions: Band → Jump → Step Back and Check
- Creek: resistance inside an accumulation range where rally highs keep getting capped at about the same height. Treat it as a ragged band (zone), not a clean single line.
- Jump across the creek (JAC): a rally across that band with a wide candle, expanding volume and a close above the band. It is also called the JOC (jump over the creek).
- Back-up (BU): after the JAC, a pullback on shrinking volume comes down near the creek band and holds above it on a closing basis. It is also written BUEC (back-up to the edge of the creek).
2. The Creek Metaphor and Where It Sits in the Accumulation Schematic
A creek is a small stream, and Wyckoff teaching has long used the metaphor: think of price as someone trying to cross it.
The walker hesitates at the bank several times (the rally highs inside the range), gathers strength and jumps across in one go (the JAC), then, on the far bank, steps back to check that the ground underfoot is solid (the BU). If that ground gives way and the walker slips back into the water — that is, if price closes back below the creek band — the crossing didn't happen.
Inside the accumulation schematic, the first rally after the selling climax (SC), the automatic rally (AR), sets the first top of the range, and a secondary test (ST) of the low follows. Then, through a long Phase B, every rally stalls at about the same height. The AR high and these rally highs stack up to form the creek. After the spring and the test confirm that selling pressure below has dried up, the JAC appears in Phase D as a sign of strength (SOS), and the BU that follows becomes one form of the last point of support (LPS).
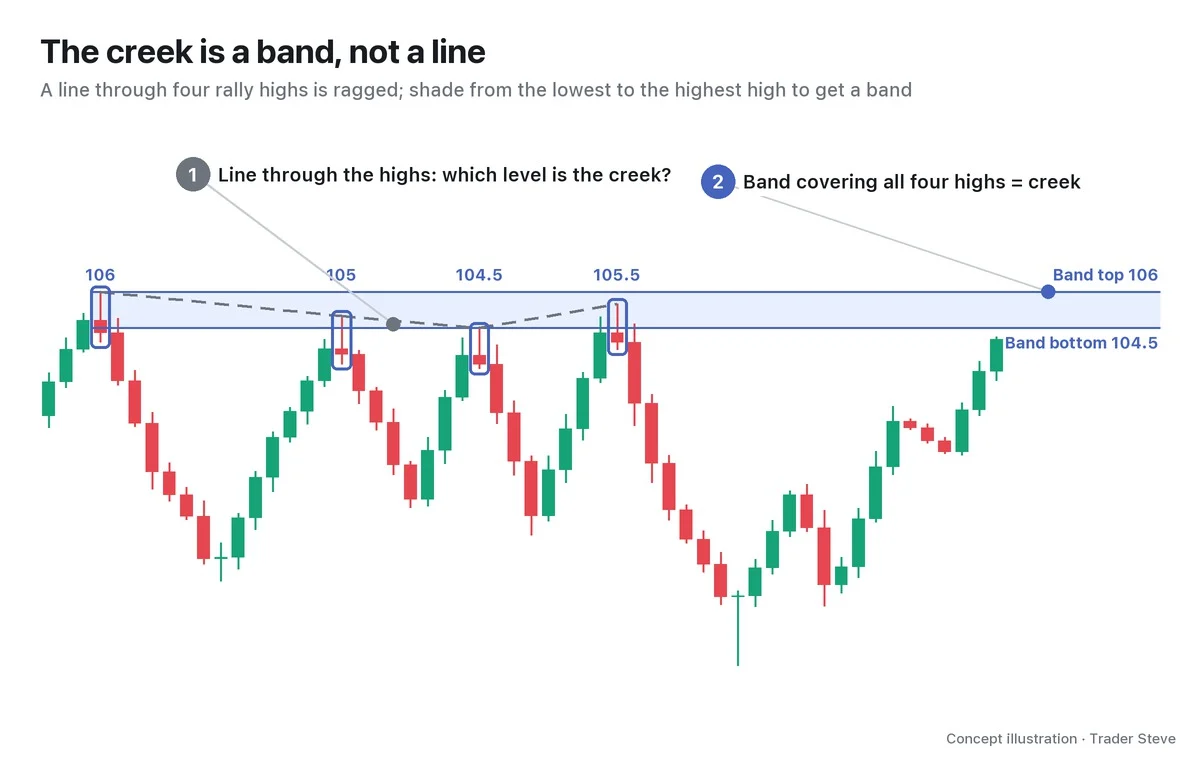
Rally highs stall at slightly different prices each time, so a single line leaves some highs sticking out above it and others falling short. That's why this series treats the creek as a band from the start. Part 2 shows how to draw it.
3. Why the BU Holds: How Resistance Turns into Support
Rallies stalling at the same band again and again means sell orders were stacked at that height. Breakeven selling from people who bought lower in the range and profit-taking on every rally both cluster in this band.
The JAC is the scene where that supply gets absorbed in one push by a wide candle and heavy volume as price crosses the band. So when price comes back down to the band, there isn't as much left to sell as before. On top of that, the side that drove price up through the band bought size around there, so it has a reason to step in again when a pullback reaches that spot. This is the support/resistance flip (S/R flip): resistance becoming support.
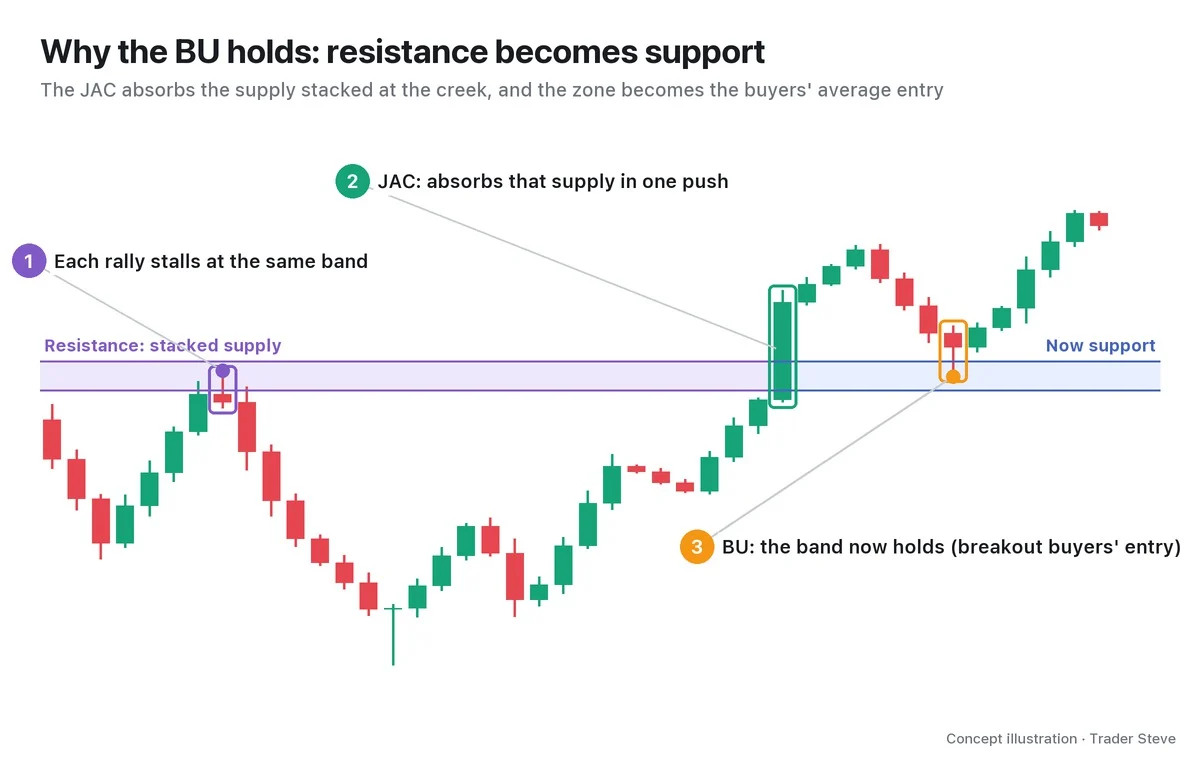
On the live stream, I describe the same spot as "where price breaks through the resistance line and then comes back to it." In Wyckoff terms, that's the BU.
"The guys who trade well, the ones interested in this coin, would have been waiting right here — for price to break through this line, the one that was resistance, and then come back to it. … I think support can show up in a spot like this. Why? Because price broke up hard through a zone where a lot of liquidity was already sitting, where a lot of buy and sell orders get placed. So even if it gets pushed back down, there's a good chance support shows up in several places. Why? There's a good chance this is the big players' average entry." — Trader Steve, live stream, Oct 16, 2026 (translated from Korean) · ▶ Watch the stream highlights (Korean audio)
I said support "can show up," not that it "will definitely hold." Part 4 looks at cases where the band fails to hold.
4. What Volume Looks Like in the Three Scenes: Big on the JAC, Small on the BU
In Wyckoff, price action is always read together with volume. Each of the three scenes has an expected volume signature.
| Scene | Price | Volume |
|---|---|---|
| Creek (rallies inside the range) | Stalls at the same band again and again | Dries up gradually as the range drags on |
| JAC | Wide candle, close above the band | Expands noticeably |
| BU | Pulls back to the band, narrow candles | Clearly lower than on the JAC |
Heavy volume on the JAC means enough buying came in to absorb the stacked supply; light volume on the BU means little new selling hits the market on the way down. It is the simplest place to get a feel for Wyckoff's law of effort vs. result. If volume instead expands on the BU, treat it as a warning (Parts 4 and 5).
5. A Real Ethereum Chart: Fall 2023 (One Interpretation)
This is the ETH daily chart from August to November 2023, where almost the same sequence as the diagram actually played out (Binance daily candles open at 09:00 KST). The labels below were applied after the fact and are one interpretation.
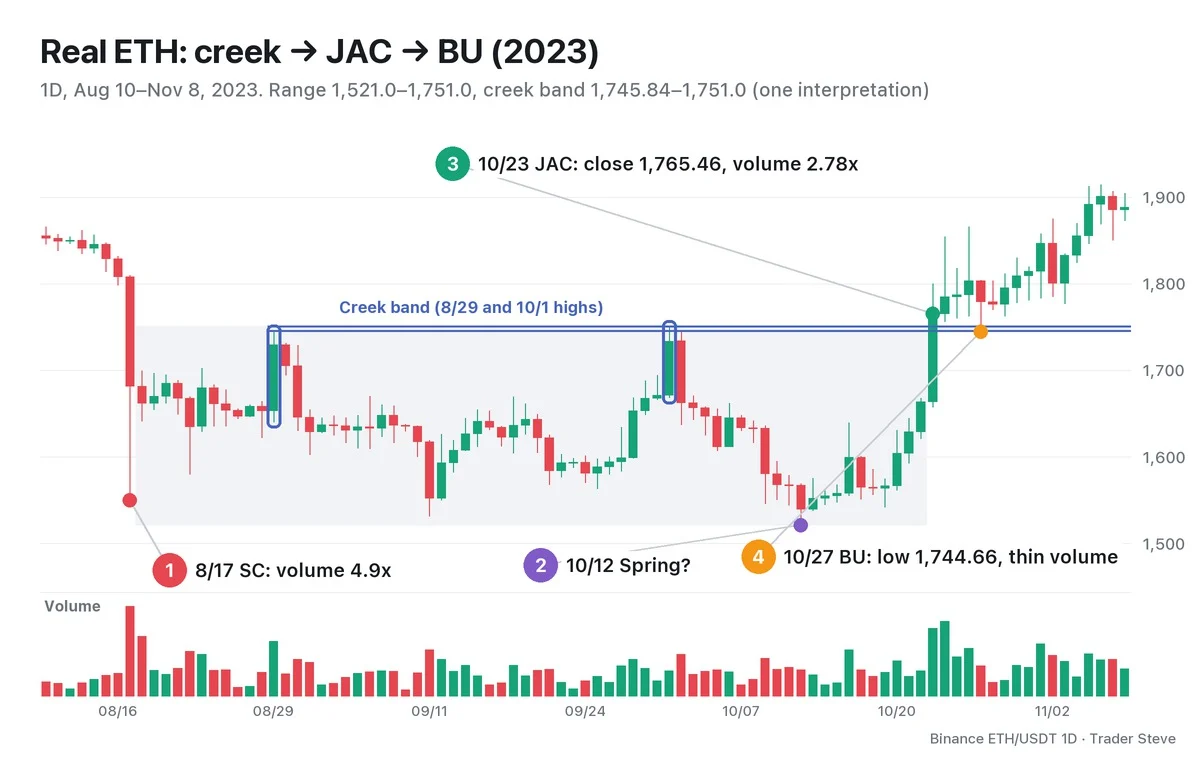
- ① SC: on Aug 17, price fell 7.0% in a single day on volume 4.90x the previous 20-day average and stopped at a low of 1,550.0.
- Range: Aug 18–Oct 22, 1,521.0–1,751.0 (height 230, 15.1%).
- Creek band: the Aug 29 high of 1,745.84 and the Oct 1 high of 1,751.0 — capped twice at the same height. Because the two highs are so close, the band is only 0.30% wide.
- ② Spring candidate: the Oct 12 low of 1,521.0, 0.65% below the Sep 11 low of 1,531.01.
- ③ JAC: on Oct 23, price rose 6.12% and closed at 1,765.46, the first close above the band since the range formed. Volume was 2.78x the average, and the close sat at 76% of the candle's range.
- ④ BU: the Oct 27 low of 1,744.66. The wick dipped 0.07% below the bottom of the band, but the close was 1,779.4, above the band. Volume dried up from 0.98x to 0.43x to 0.50x of the previous 20-day average, and the average volume of those three days was 0.30x the JAC candle.
From the JAC through Nov 8, there was no daily close below the top of the band. Testing the band with a wick and holding above it on a closing basis while volume shrank is exactly the BU in the diagram. Still, this confirms that price crossed — it does not promise a rally.
See also: Wyckoff Accumulation Phases (related lesson), Wyckoff Sign of Strength (related lesson) for judging the strength of the JAC candle, Wyckoff Last Point of Support (related lesson) for BU entry types, and Basics Support and Resistance (related lesson).
Key Takeaways
- The creek is the resistance where rally highs inside an accumulation range get capped; read it as a band, not a single line.
- The JAC crosses that band on a closing basis with a wide candle and heavy volume.
- The BU is where a pullback on shrinking volume comes near the band, and you check whether it holds above the band.
- Old resistance turns into support because the stacked supply is absorbed during the JAC, and the zone becomes the breakout side's average entry.
- Labels on a real chart are an interpretation. They confirm the crossing, not a rally.
In Part 2, we'll cover how to actually draw the creek and which checklist to use to identify a JAC and a BU.
Drawing the range, the band and the volume by hand for every market takes time. The Omnisight Report compiles a combined analysis that includes the Wyckoff view.
This lesson adapts the text, figures and live-stream quotes of the Trader Steve TA series for the web, translated from the original Korean. Check the text and figure captions for the timing and interpretation of each real example, and read conceptual diagrams and real charts separately.
Corrections: support@omnisight.report


