
What Is Wyckoff Distribution? An Overview of Phases A–E
Historical examples for learning · not current prices or trade recommendations.
Contents
At the end of a long rally, the chart sometimes spends a while moving sideways up high. Wyckoff called the process of big players gradually releasing the size they had built up inside that range distribution, and he read it in five phases — from the formation of the range to the trend that carries price out of it. Phase E is the decline that has already left the range. This lesson explains what distribution is, why it shows up as a range near the top, and what each of Phases A–E does, all on a single map.
All dates and times are Korea Standard Time (KST, UTC+9). A daily candle is dated by its 09:00 KST open; intraday extremes are identified by their KST date and time.
1. The One-Line Definition: A Range After a Long Rally Where Big Players Hand Off Their Size
Distribution is the stretch after a long rally where big players (the Composite Man, in Wyckoff's terms) hand off the size they built up to late-arriving buyers inside a range. That range is called a trading range (TR). Because it is accumulation — absorbing supply at the end of a decline — turned upside down, distribution is called the mirror image of accumulation. On the live stream, I use "distribution" interchangeably with Korean phrases that mean "handing off size" or "offloading it onto others."
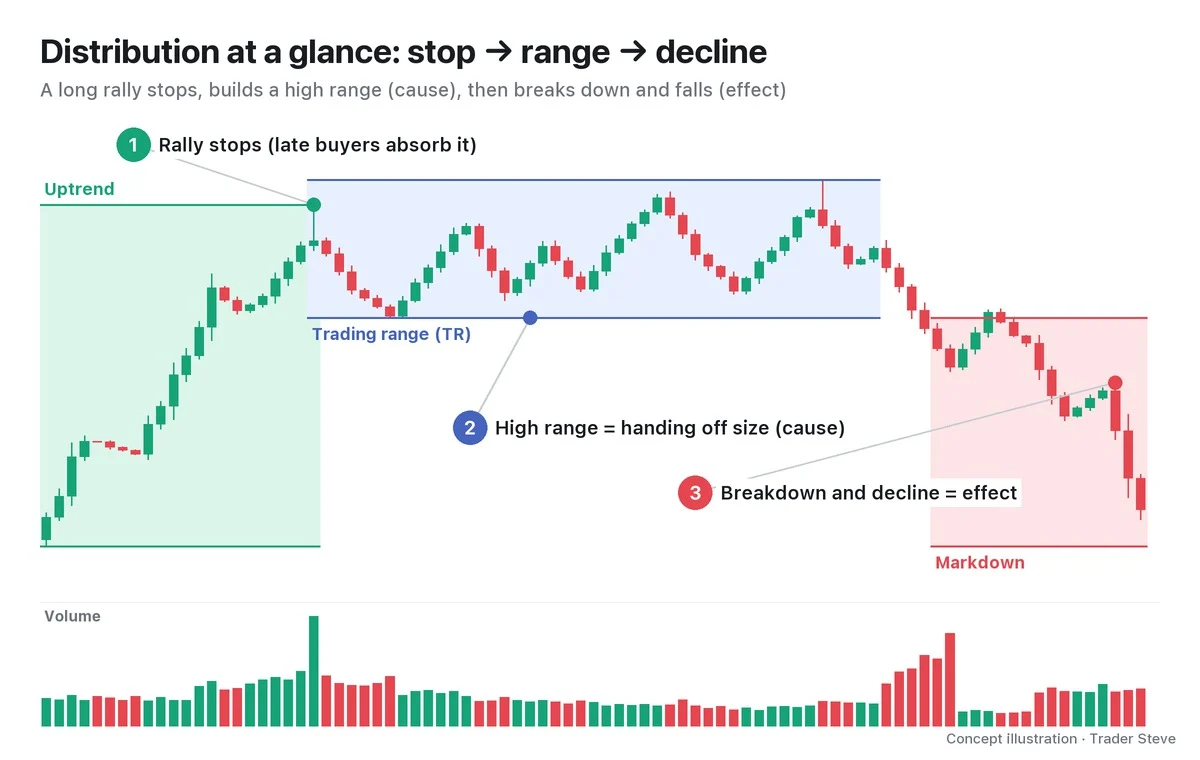
As ①②③ in the chart show, distribution plays out in three scenes: the stop, the range and the decline. The key point is that the size is handed off while price stays high. A hypothetical I walked through on a live stream, about a semiconductor stock, matches this definition.
"It's not a picture where price gets pushed down below here and then collapses from there. The big players have to offload more size onto more retail traders and get out safely, so you can get a structure where they hand off all of it at a spot like this, where price has gone up a lot more than you'd think, and only then does the market go down." — Trader Steve, live stream, Aug 22, 2026 (translated from Korean) · ▶ Watch the stream highlights (Korean audio)
2. Why It Becomes a Range: Big Size Only Sells If Someone Is There to Buy It
Big players have far more to sell than any individual trader. If they dumped it all at once, the buy orders able to absorb it would soon run out, and every later sale would go at a lower price. So they hold price inside a high band for a long time and sell a little at a time to whoever chases it each time it rises. On the chart, that repetition looks like a long sideways range near the high.
In everyday English, "distribution" also means getting goods out to buyers — the wholesale and retail trade. I compare the big players' job to exactly that business. I used this analogy while laying out a bullish scenario for Bitcoin (BTC).
"I was going to pick it up down below and sell it up here, but … at heart, I'm in the distribution business. … Price has to come down so I can pick up a thousand, two thousand units here and then go sell them up here — that's how I make a lot of money. But I haven't picked anything up. I'm not holding any size." — Trader Steve, live stream, Aug 21, 2026 (translated from Korean) · ▶ Watch the stream highlights (Korean audio)
Selling off up high, piece by piece, what was bought cheap — that is distribution. The story from the big players' side continues in Wyckoff Composite Man (related lesson). Wyckoff called this range the cause and the decline after price leaves it the effect.
3. The Five-Phase Map: Phases A–E
Wyckoff splits distribution into five phases. Rather than memorizing names, it is easier to read each one as "what is the market doing right now?"
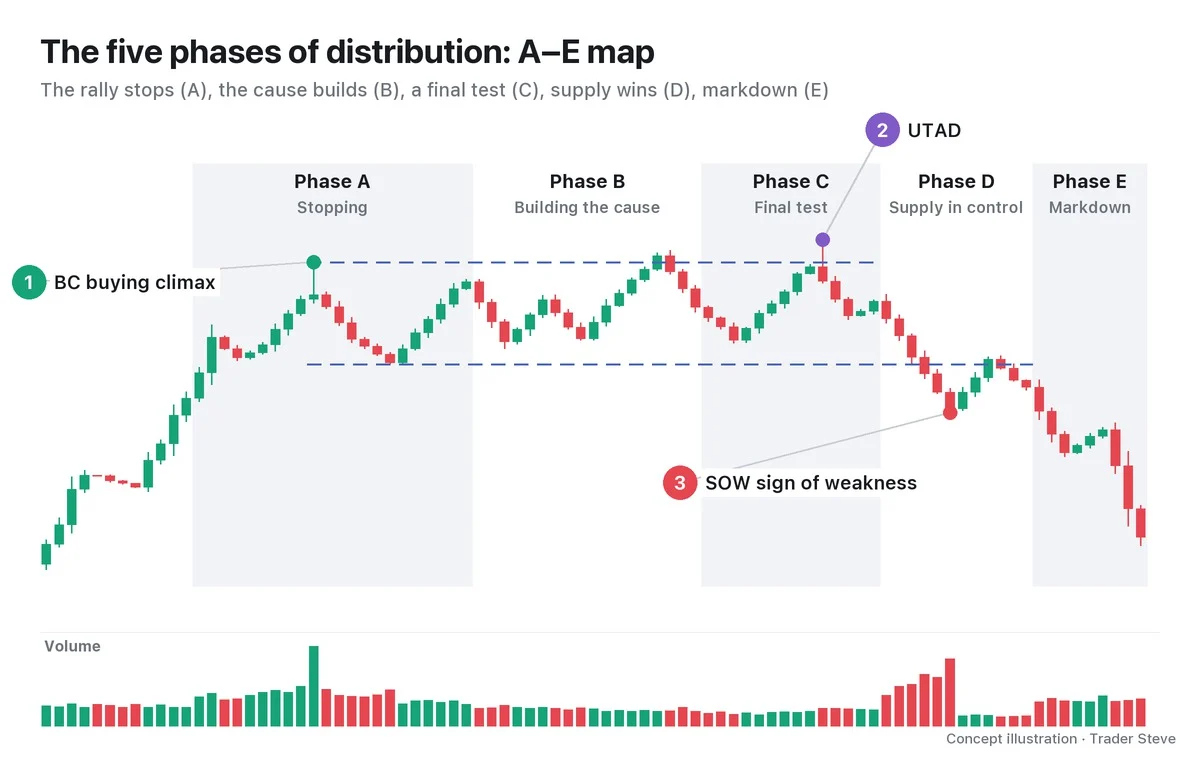
| Phase | What happens | Key events (abbreviations) |
|---|---|---|
| Phase A: Stopping | The rally stops and the range's ceiling and floor are set | PSY · BC · AR · ST |
| Phase B: Building the cause | Price moves up and down inside the range for a long time while size is handed off. The longest phase | UT · repeated STs · mSOW |
| Phase C: Final test | The remaining buyers are drawn in one last time | UTAD (or a lower high) |
| Phase D: Supply in control | Price makes lower highs and lower lows and breaks the bottom of the range (the ice) | SOW · LPSY |
| Phase E: Markdown | Price leaves the range and trends lower | Repeated LPSYs |
Let's start with just the three events on the chart. The buying climax (BC) is the overheated buying at the end of the rally, and it sets the ceiling of the range (①). An upthrust after distribution (UTAD) is a brief move above the BC high in Phase C that comes back inside the range (②). A sign of weakness (SOW) is a decline that breaks the bottom of the range decisively (③). The bottom of the range is likened to a sheet of frozen ice and is called the ice.
The version with a UTAD is called Schematic #1; the version without one, where the highs step lower like a staircase, is called Schematic #2. The other abbreviations in the table — preliminary supply (PSY), automatic reaction (AR), secondary test (ST), upthrust (UT), minor sign of weakness (mSOW) and last point of supply (LPSY) — are defined one by one in Part 2, along with the criteria that separate #1 from #2.
4. Volume Tells the Story
From the shape of the range alone, accumulation and distribution often look alike. What separates them is how volume flows.
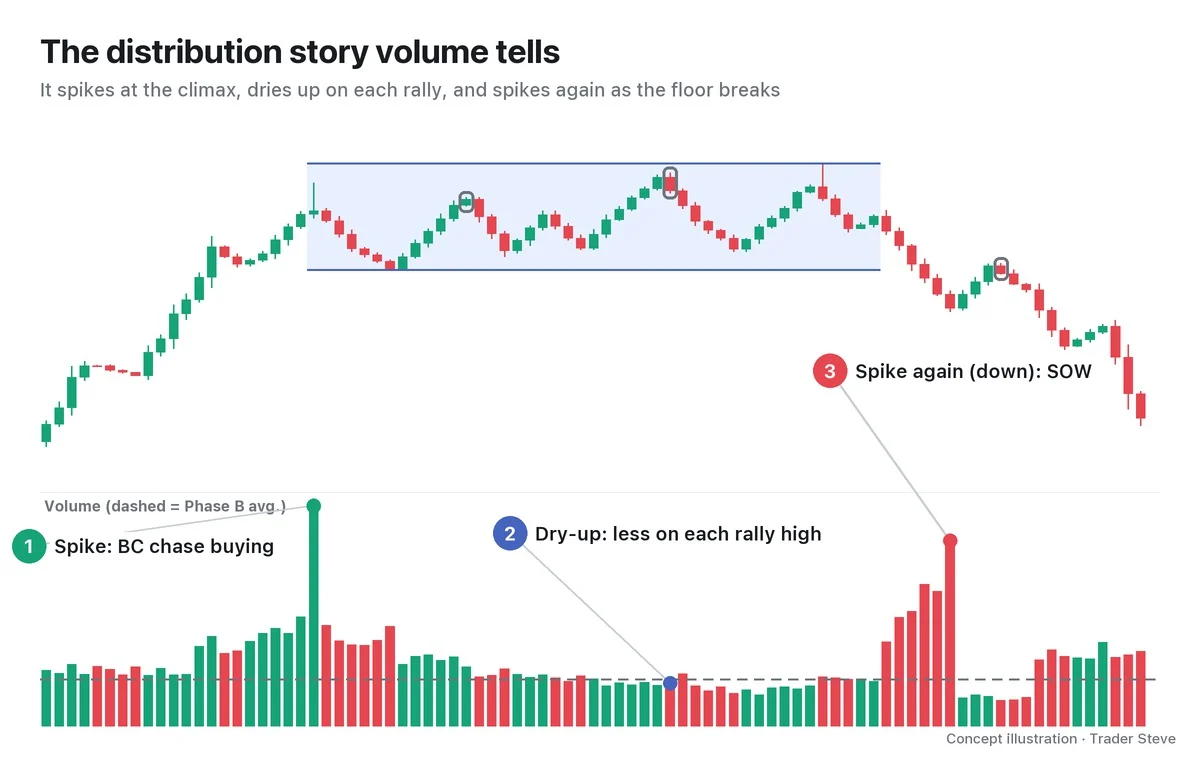
- Spike: volume peaks at the BC. Late chase buying piles in all at once, and the volume is the footprint of someone handing size to those buyers.
- Dry-up: each time price rallies inside the range, volume at the high gets smaller (the dashed line is the Phase B average). Demand to push price higher is fading.
- Spike again (down): volume expands again on the SOW that breaks the bottom of the range. This time the volume comes from the sellers.
If accumulation is "spike at the bottom → dry-up → spike again on the way up," distribution is "spike at the top → dry-up on each rally → spike again on the way down."
5. Real BTC: A 113-Day Range Near the High
Let's look for a range that resembles distribution on a real Bitcoin daily chart. In this part I won't name any events except the BC; I'll only look at the shape.
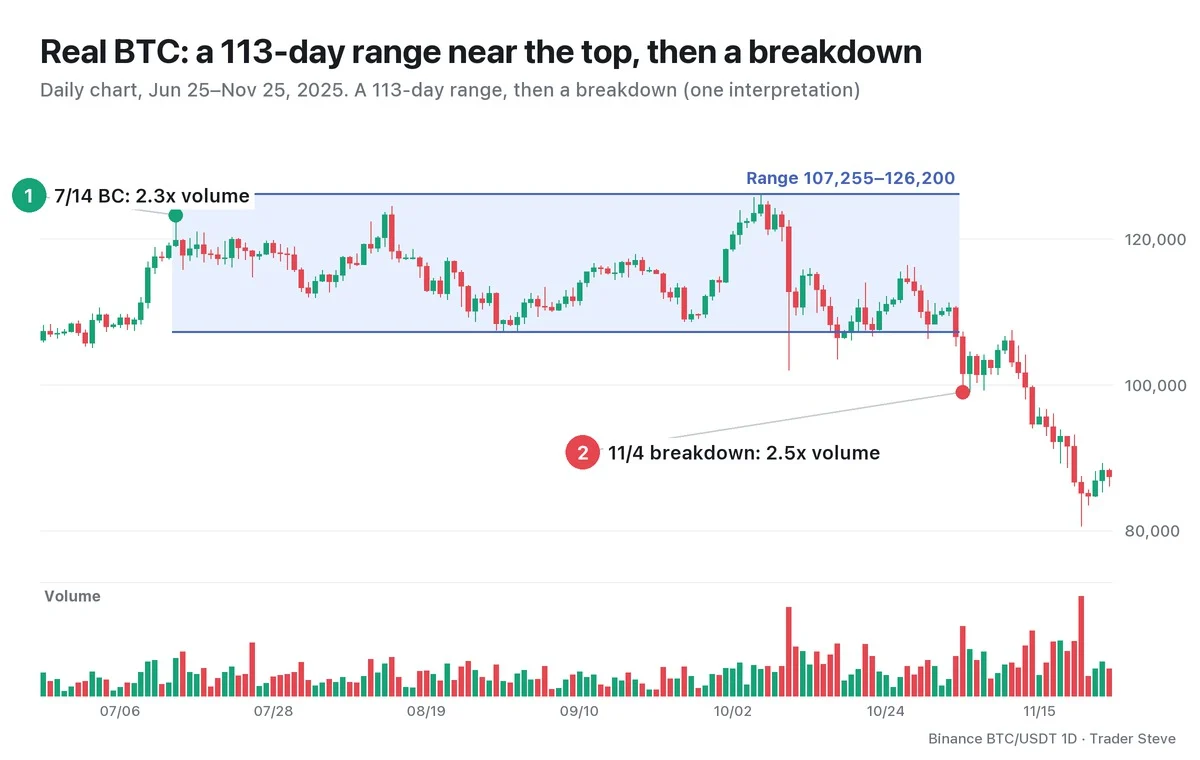
On Jul 14, 2025, Bitcoin printed a high of 123,218, and volume that day was 2.3x the average of the previous 20 days. Price then moved up and down between the Sep 1 low of 107,255 and the Oct 6 daily high of 126,200 (on the 4-hour chart, the 01:00 KST candle on Oct 7) — a band about 17.7% wide measured from the floor. In the Oct 10 crash, the lower wick broke far through the floor, and on Oct 17–18 the close dipped below the floor briefly before coming back. On Nov 3 the close went below the floor again, and the next day, Nov 4, volume expanded to 2.5x the previous 20-day average as price closed at 101,497. Through Nov 25, the close never got back above the bottom of the range.
Spike at the top (Jul 14) → up and down inside the range → spike again on the way down (Nov 4). It is the same sequence as in Section 4. This, however, is one interpretation, made in hindsight. While the range is still forming, you cannot know whether it is distribution or just a pause before a further rally (reaccumulation). Part 4 labels the events in this range one by one.
The larger frame around the same top (the weekly-chart phase) is covered in Wyckoff Market Cycle (related lesson); here I look at the daily structure inside it. The mirror image is in Wyckoff Accumulation Phases (related lesson).
Key Takeaways
- Distribution is the stretch after a long rally where big players hand off the size they built up to late buyers inside a range.
- Big size only sells if someone is there to buy it, so it forms a range that stays at high prices. The range is the cause; the decline that follows is the effect.
- Read it in order: Phase A stopping → B building the cause → C final test → D supply in control → E markdown.
- Check whether volume follows the sequence spike at the top → dry-up on each rally → spike again on the way down.
- Phase labels are an interpretation. Only when price holds below the bottom of the range is it confirmed as distribution.
In Part 2, we'll cover the definition of each event, from PSY, BC, AR and ST to the UTAD, SOW and LPSY, and the criteria that separate Schematic #1 from #2.
Checking the events and volume inside a range by hand for every market takes real time. If you want an analysis that pulls several theories together in one place, see the report below.
This lesson adapts the text, figures and live-stream quotes of the Trader Steve TA series for the web, translated from the original Korean. Check the text and figure captions for the timing and interpretation of each real example, and read conceptual diagrams and real charts separately.
Corrections: support@omnisight.report


