
Effort vs. Result in VSA: What Volume Is Really Telling You
Historical examples for learning · not current prices or trade recommendations.
Contents
You have probably seen it many times: a candle where volume explodes but price goes nowhere, or a candle where volume has dried up yet price creeps higher. This lesson shows how to read a single candle through its volume, spread and close location, and what the two names that come out of that reading, no demand and no supply, actually mean.
All dates and times are Korea Standard Time (KST, UTC+9). A daily candle is dated by its 09:00 KST open, and intraday extremes are identified by their KST date and time.
1. Effort vs. Result Shrunk to One Candle: The Three Inputs of VSA
Wyckoff's third law is the law of effort vs. result. Effort is volume; result is how far price actually moved. The law itself, and how to compare large sections of a chart, are covered in Wyckoff Three Laws. This topic shrinks that comparison down to a single candle (or two or three candles).
This candle-by-candle reading is volume spread analysis (VSA). Tom Williams refined the Wyckoff method so it could be read one candle at a time, and it uses three inputs.
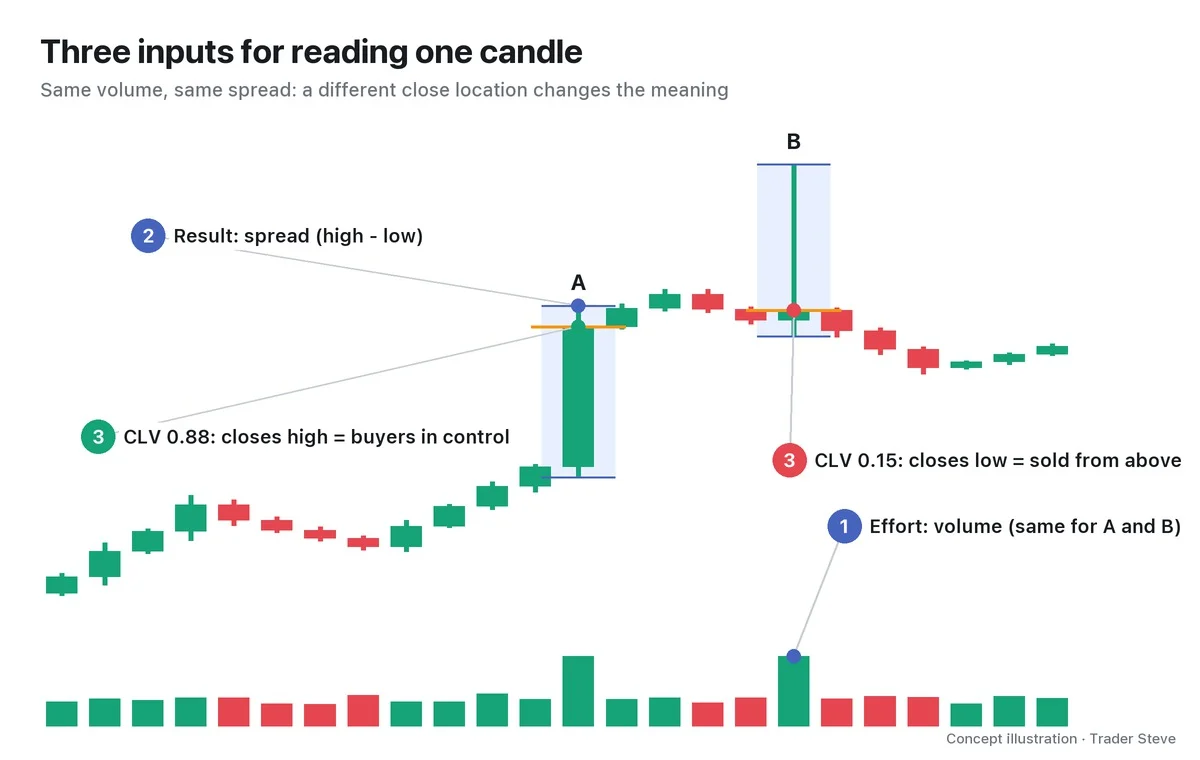
- ① Effort = volume: how much was bought and sold. This series measures it as relative volume (RVOL) = this candle's volume ÷ the average of the previous 20 candles.
- ② Result = spread: the distance between the high and the low. It is read as relative spread (RS), compared with the average range of the previous 20 candles.
- ③ Result = close location: where the close sits inside the candle, measured as the close location value (CLV) (0 = closes at the low, 1 = closes at the high). Whether the candle finished near the top or the bottom tells you who won the fight.
In the illustration, A has a CLV of 0.88: buyers won. B has the same volume and range, but a CLV of 0.15: it was sold from above and pushed back down.
Only when you add the background (the trend that came before, and whether price is near a high or at the bottom of a range) does the meaning of a given candle become clear. Reading bodies and wicks is covered in Basics Candlesticks, and the fundamentals of volume itself in Basics Volume.
2. Harmony and Mismatch: Did the Result Follow the Effort?
Put effort and result side by side and you get four cases.
| Effort (volume) | Result (spread, close) | Name | How to read it |
|---|---|---|---|
| Big | Big, closes in that direction | Harmony | The move is likely real |
| Big | Small, or closes on the opposite side | Mismatch | The other side is absorbing it |
| Small | Small | Harmony | Taking a breather |
| Small | Big | Mismatch | The other side was empty, so price moved easily |
This gap between effort and result is called a mismatch (kept separate from indicator divergence). A mismatch is a signal to "read it again," not a sign that price is about to reverse.
I don't use the term VSA, but I once described a scene where big effort produced no result like this (talking about a Korean semiconductor stock early in the trading session).
"A lot of volume came in here, and it looked really deliberate. They pumped the volume up like this, right? And then it slammed right back down. Now the real question is whether anyone will take it — whether the market and the big players will link arms and build this rally picture together." — Trader Steve, live stream, Oct 14, 2026 (translated from Korean) · ▶ Watch the stream highlights (Korean audio)
The effort was pumped up, but the result went right back to where it started. That's why the next question is "who will take the other side?" The candles that follow give the answer.
3. No Demand: Price Rises, but the Buying Side Is Empty
No demand (ND) is one version of "small effort, small result." It has three conditions.
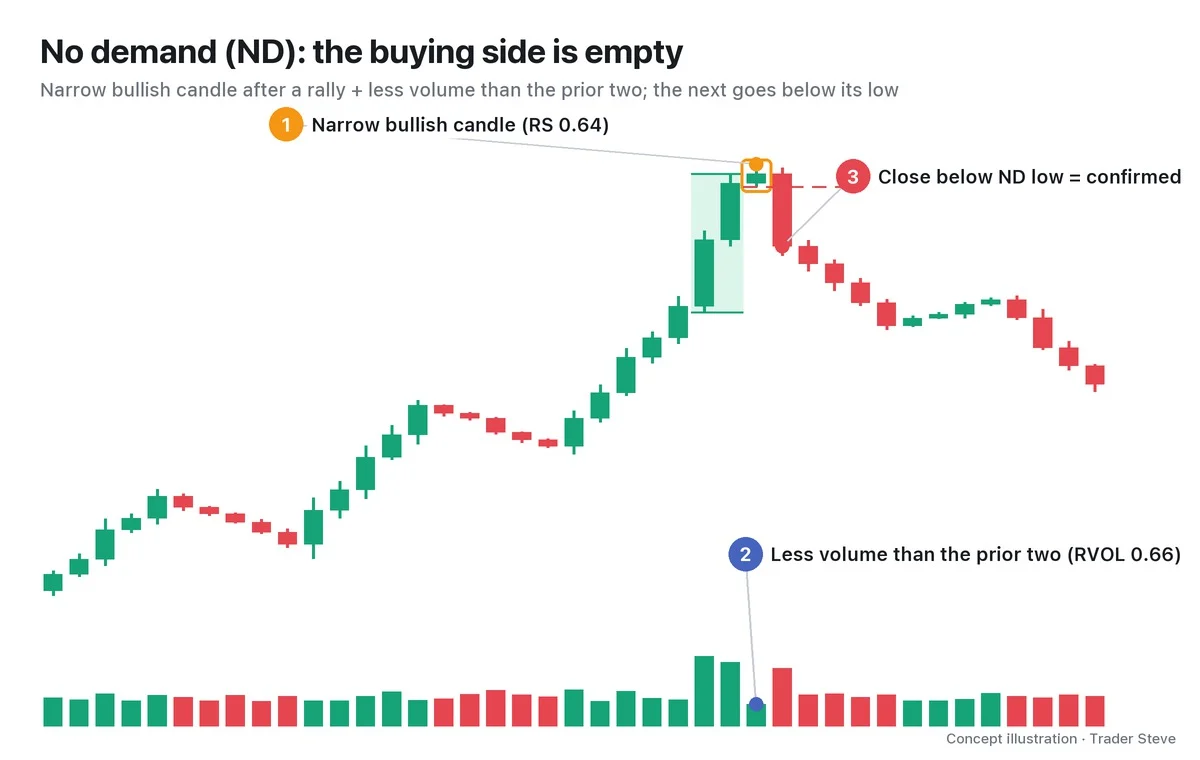
- An up candle: it closes above the previous candle's close. The candle in the illustration is narrow, with a relative spread of 0.64.
- Less volume than the prior two candles: RVOL 0.66, a sharp drop from the two large bullish candles before it (green boxes).
- Background: price has already rallied and is near a high or resistance.
What it says: "Price went up, but the big players' buying didn't show up." Earlier, price was pushed higher on heavy volume; at the top, the buying power that should follow is missing.
One ND candle settles nothing, so you wait for a confirmation candle. If the next candle closes below the ND candle's low, the read is playing out. If price heads back up on heavy volume, it was just a candle taking a breather.
4. No Supply: Price Dips, but Selling Has Dried Up
No supply (NS) is the mirror image of ND.
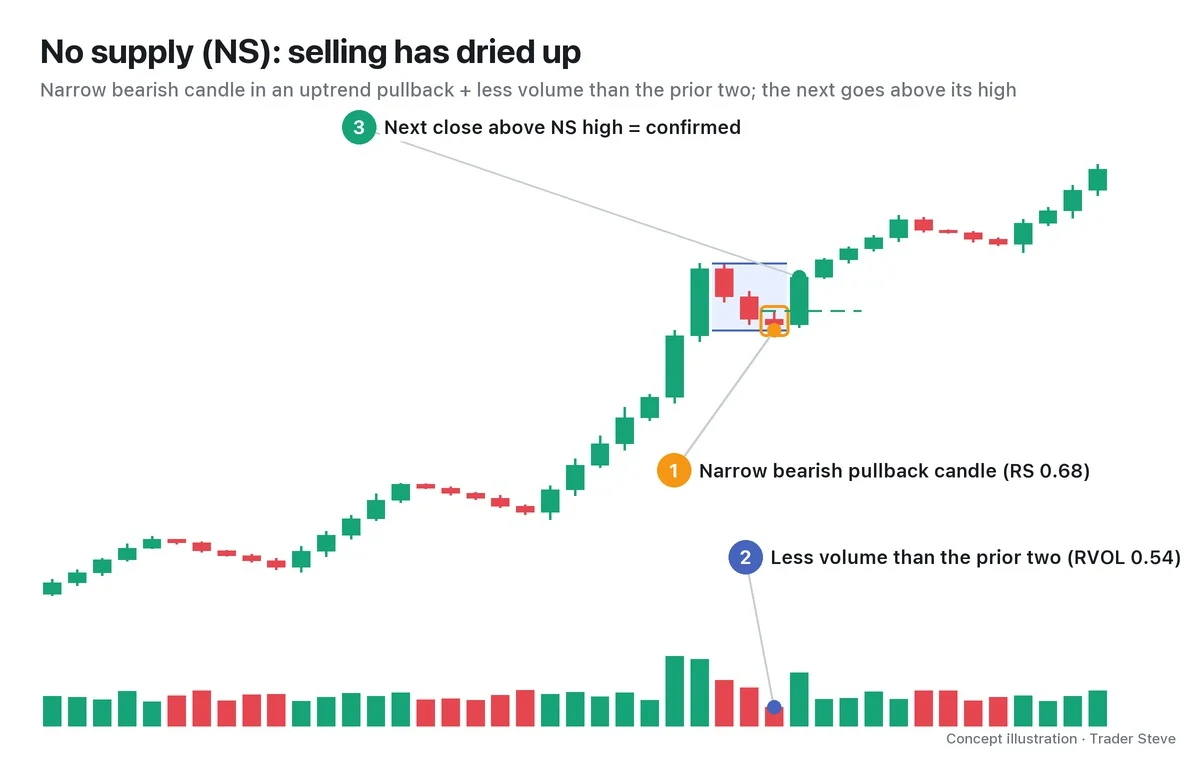
- A down candle: it closes below the previous candle's close. The candle in the illustration is narrow, with a relative spread of 0.68.
- Less volume than the prior two candles: RVOL 0.54. Volume shrinks as the pullback goes on.
- Background: a pullback in an uptrend, retesting support or the bottom of the range.
What it says: "Price fell, but the supply being dumped has dried up." I talk about this scene often. Here is what I said on a day when SOXL, a 3x leveraged US semiconductor exchange-traded fund (ETF), pushed up and then got knocked back down.
"Today again it pushed up like this and then slammed right back down, but look at the volume. It's dead. The volume is totally dead. Flip that around, and what does it mean? Now, even if someone wants to dump more, there's nothing left to dump. … Why? Because nobody's left to sell. Nobody's left to hit their stop-loss." — Trader Steve, live stream, Sep 2, 2026 (translated from Korean) · ▶ Watch the stream highlights (Korean audio)
"Volume is dead → there's nothing left to sell" is the one-line definition of no supply. But no sellers doesn't mean buyers have arrived, so you watch whether the next candle closes above the NS candle's high (the confirmation candle). Part 2 covers that difference.
5. Real BTC 4-Hour Chart: Four Candles at the Top
This is the Bitcoin (BTC) 4-hour chart for Monday, Jul 29, 2024. Weekend candles naturally carry little volume, so ND and NS labels stick to them too easily; that's why the example uses weekday candles.
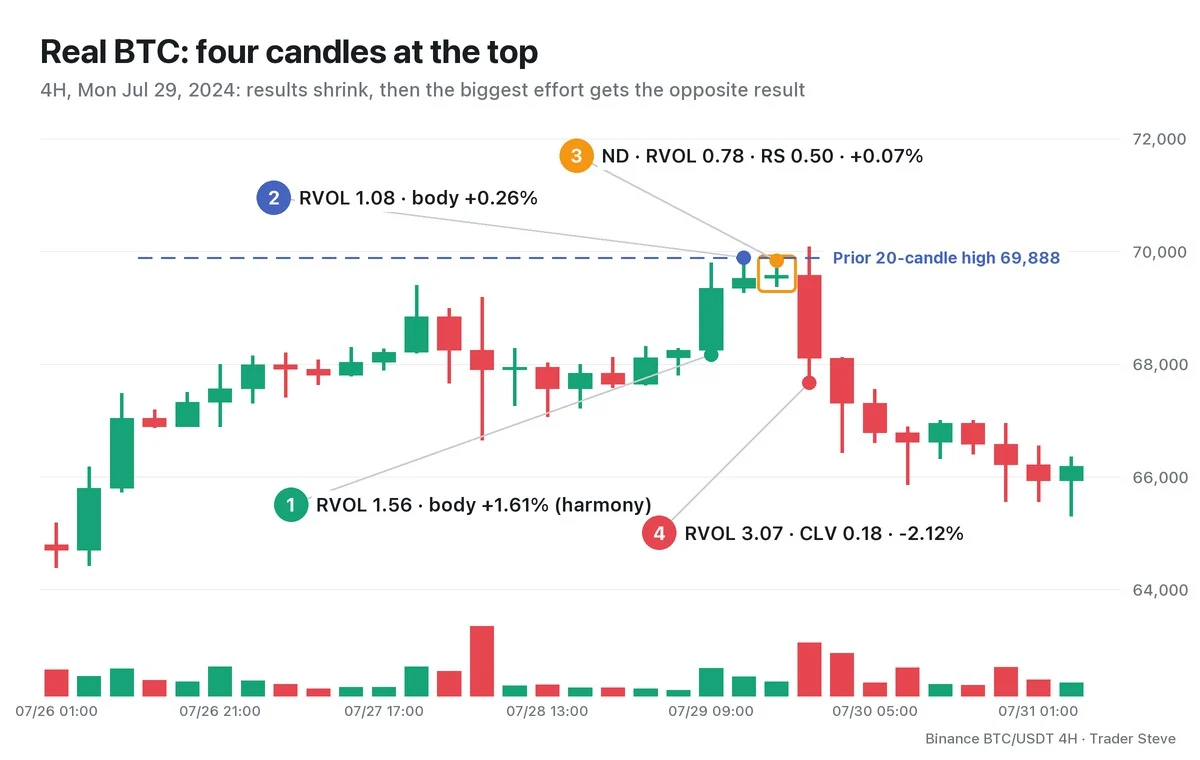
- ① 09:00 candle: RVOL 1.56, relative spread 1.73, body +1.61%, CLV 0.72. Volume came in and the result was large too. That's harmony.
- ② 13:00 candle: RVOL 1.08, body +0.26%. High 69,888; the result shrank sharply.
- ③ 17:00 candle (ND): high 69,838.62, low 69,375. RVOL 0.78, relative spread 0.50, body +0.07%. It closed above the previous candle, but on less volume than the prior two candles: no demand.
- ④ 21:00 candle: it stabbed above the prior 20-candle high of 69,888 to 70,080, then closed at 68,104. With RVOL 3.07, it was the biggest effort of the four, yet its CLV was 0.18 and its body -2.12%: the result went the other way. Because it closed below ③'s low, it is also the confirmation candle for the ND.
The result shrank from 1.61% → 0.26% → 0.07% while effort shrank too (ND), and then the biggest effort produced a result to the downside. In VSA, a high-volume candle that stabs above the high and finishes near its low is called an upthrust bar (as a Wyckoff event, see Wyckoff Upthrust). Within the next 12 candles (two days), the low came down to 65,303 at 05:00 on Jul 31.
The same chart also has one candle that doesn't fit. The 05:00 KST candle on Jul 28 (early Sunday morning) was a big effort at RVOL 3.28, but its body was only -0.51% and its close sat near the middle of its range. Both sides fought hard, but with almost no result, it says nothing about direction. Heavy volume doesn't always give you an answer.
Key Takeaways
- Effort is volume; result is spread and close location. Judge their size against the previous 20 candles.
- When effort and result agree, that's harmony; when they don't, it's a mismatch. A mismatch means "read it again," not a confirmed reversal.
- No demand: an up candle that is narrow, on less volume than the prior two candles. The buying side is empty.
- No supply: a down candle that is narrow, on less volume than the prior two candles. Selling has dried up.
- Candle names are words for reading the chart, not trade signals. Always look at the background and the next candle (confirmation) too.
In Part 2, we'll put numbers on the ND and NS conditions and turn them into a checklist you can use right on the chart.
Measuring volume and spread by hand for every candle takes real time. The Omnisight Report lays it out for you, market by market.
This lesson adapts the text, figures and live-stream quotes of the Trader Steve TA series for the web, translated from the original Korean. Check the text and figure captions for the timing and interpretation of each real example, and read conceptual diagrams and real charts separately.
Corrections: support@omnisight.report


