
What Is Ice in Wyckoff? The Ice Line and Fall Through the Ice Explained
Historical examples for learning · not current prices or trade recommendations.
Contents
A price that held the floor of a range several times closes below it one day on a single large bearish candle. In Wyckoff, that floor is called the ice, and the moment it breaks is called a fall through the ice. This lesson uses diagrams and a real Ethereum (ETH) chart to explain what the ice is, why the decline speeds up once the ice breaks, and why broken ice becomes a ceiling.
All dates and times are Korea Standard Time (KST, UTC+9). A daily candle is dated by its 09:00 KST open; intraday extremes are identified by their KST date and time.
1. The One-Line Definition: The Floor Demand Defended Inside the Range
The ice is the support line at the bottom of a range (a trading range). As price swings up and down, buyers (demand) show up every time and hold price up at that level. Think of it as the last floor that demand defended inside the range.
The name comes from a metaphor. Price walking on ice can slip and get back up, but once the ice breaks, it falls straight into the water. Textbooks write it slightly differently, but this series abbreviates it as fall through the ice (FTI).
The ice can be a horizontal line, a sloping line or a band (a zone). How to draw it is covered in Part 2.
2. Where the Ice Sits in a Distribution Structure
The ice comes up mostly in distribution structures: the range in which big players hand off their size after a long rally.
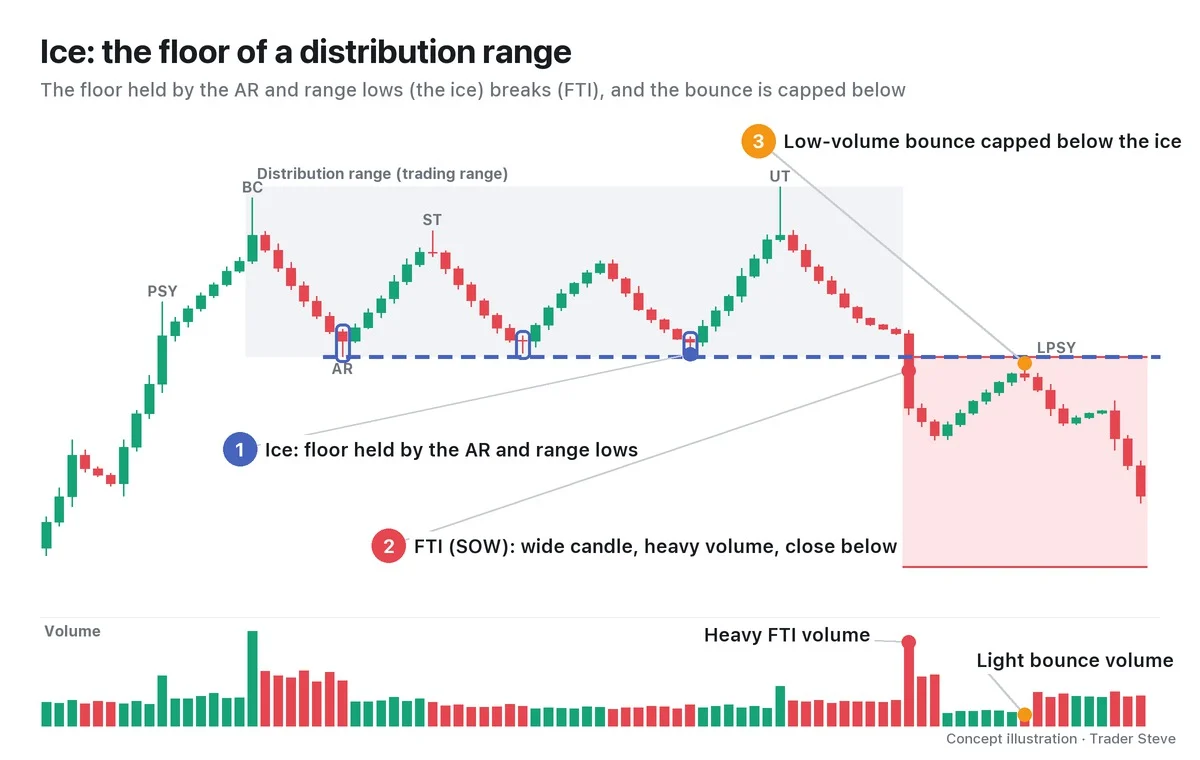
Here is the sequence, step by step.
- PSY (preliminary supply) and BC (buying climax): at the end of the rally, a high prints on heavy volume.
- AR (automatic reaction): after the BC, price drops fast and forms the first floor of the range. This low is where the ice starts.
- ST (secondary test) and UT (upthrust): price knocks on the upper part of the range again. Meanwhile, every time it comes back down, the lows near the AR hold, and the ice becomes clearer.
- FTI: eventually the candle body breaks the ice and closes below it. It is strong evidence that supply has beaten demand, so it is read as a classic sign of weakness (SOW).
- A bounce capped from below: a bounce on shrinking volume turns down below the ice. That bounce high is a candidate for the LPSY (last point of supply).
The distribution phases (Phase A–E) and the types of SOW and LPSY are covered in their own topics. This series focuses on the moment the floor breaks and what comes after. Accumulation ranges have an ice too, a line connecting the selling climax (SC) and ST lows; what happens when that breaks is covered in Part 2 and Part 5.
3. The Mirror Image of the Creek: JAC and FTI
Wyckoff has another line that pairs with the ice: the creek, the resistance line at the top of an accumulation range. Near the end of accumulation, when price leaps over the creek on a wide bullish candle and heavy volume, it is called a jump across the creek (JAC).
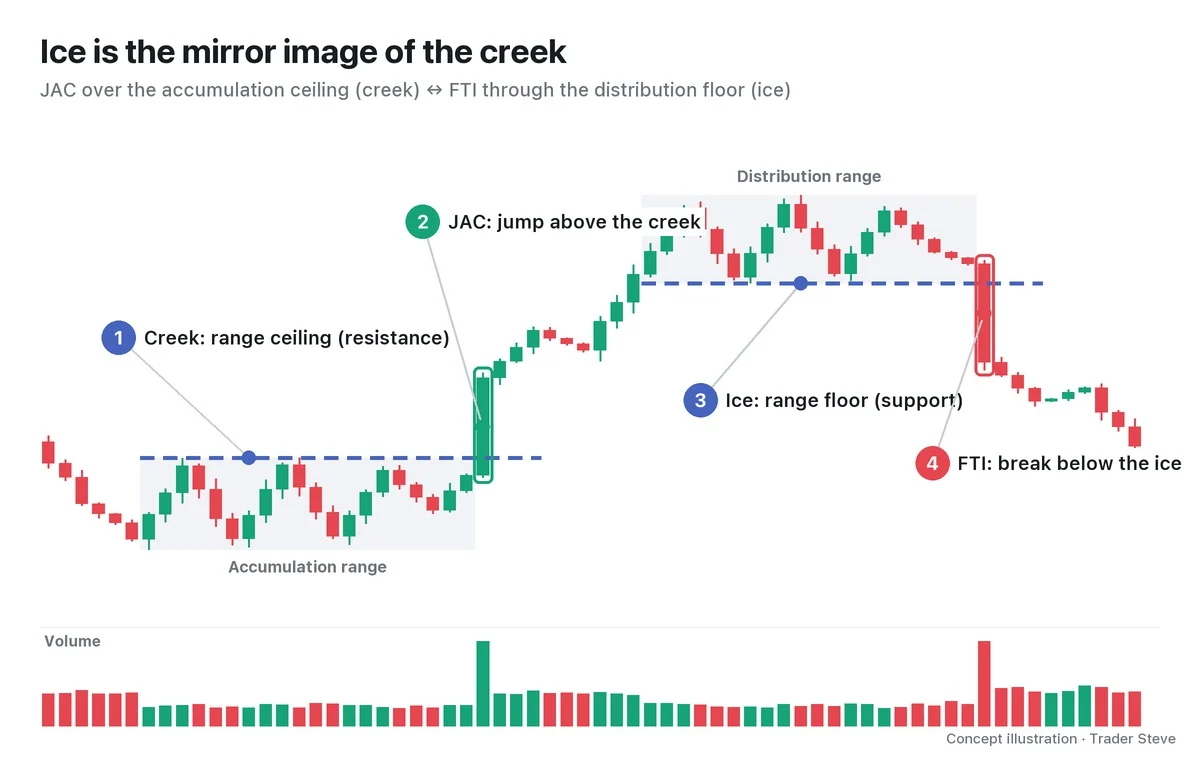
The ice and the FTI are the same picture flipped upside down.
| Accumulation side | Distribution side | |
|---|---|---|
| Reference line | Creek: range ceiling (resistance) | Ice: range floor (support) |
| The break | JAC: up on a wide bullish candle | FTI: down on a wide bearish candle |
| After the break | Pullbacks hold above the creek | Bounces are capped below the ice |
The creek and the JAC are covered in their own topic (see Wyckoff Creek, JAC and BU). Here it is enough to remember that the two are mirror images.
4. Why the Drop Speeds Up When the Ice Breaks
The ice is a line many people watch at the same time. Most traders who bought inside the range set their rule — "if this floor breaks, I'm out" — just below it. That is why stop-loss orders are stacked in layers just under the ice.
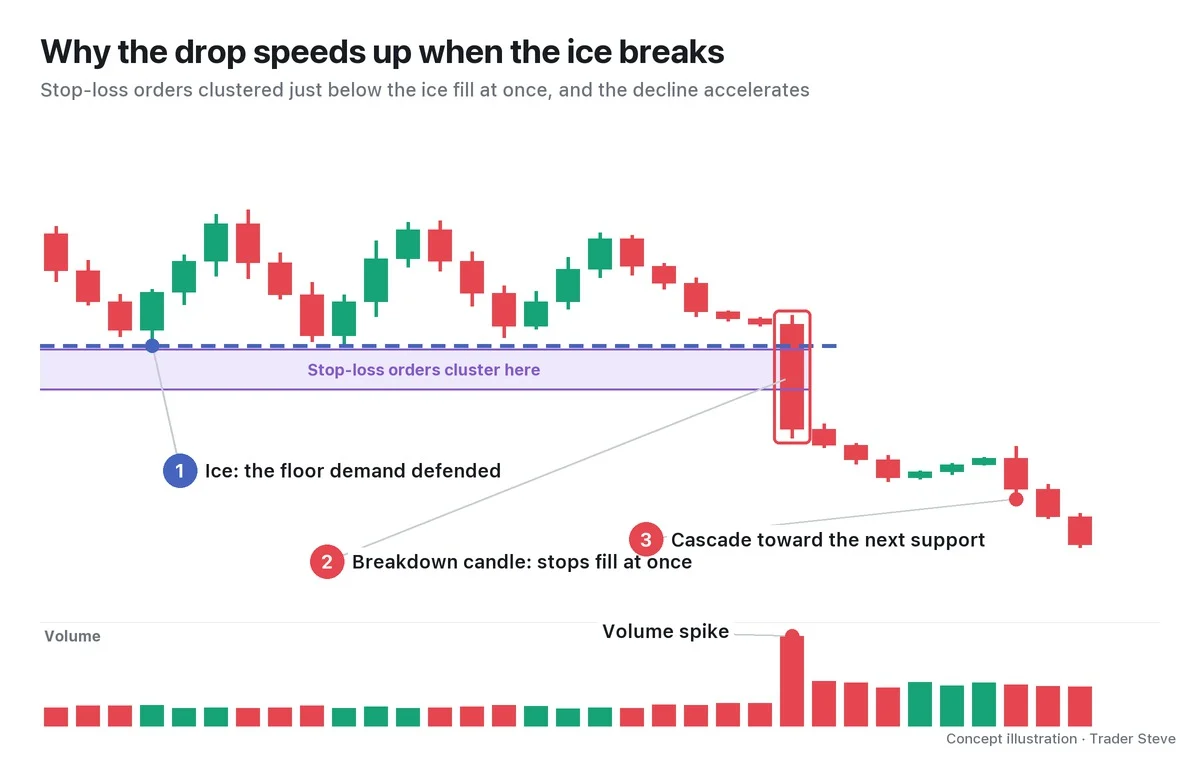
The moment the line breaks, stop-loss selling pours out, and that selling pushes price further down into the next stops. With demand's last line of defense gone, there is also nobody on the other side to absorb it for a while. That is why the FTI candle is wide and its volume heavy.
On the live stream, I once explained the psychology at the moment a support line breaks like this:
"At this moment, at this point in time, everyone sitting there holding a position that's underwater has no choice but to dump it. The moment it breaks this line, the moment it snaps the low line below it and slams straight down, what goes through your head? You see the next low line. … and that's where everyone dumps." — Trader Steve, live stream, Oct 16, 2026 (translated from Korean) · ▶ Watch this moment (Short, Korean audio)
When the ice breaks, a trapped holder sees only "the next low." That thought turning into selling all at once is what the acceleration really is.
5. Broken Ice Becomes a Ceiling: Real ETH in 2024
After an FTI, bounces struggle to get back above the ice. The area around the ice is where the average entry prices of everyone who bought inside the range are concentrated, so when price returns there, selling appears from people trying to get out at breakeven. The line that was support turns into resistance.
Let's look at a real Ethereum (ETH) daily chart. The range, ice and FTI labels are one interpretation from a Wyckoff point of view, and the dates are Binance daily candle names (the candle that opens at 09:00 KST).
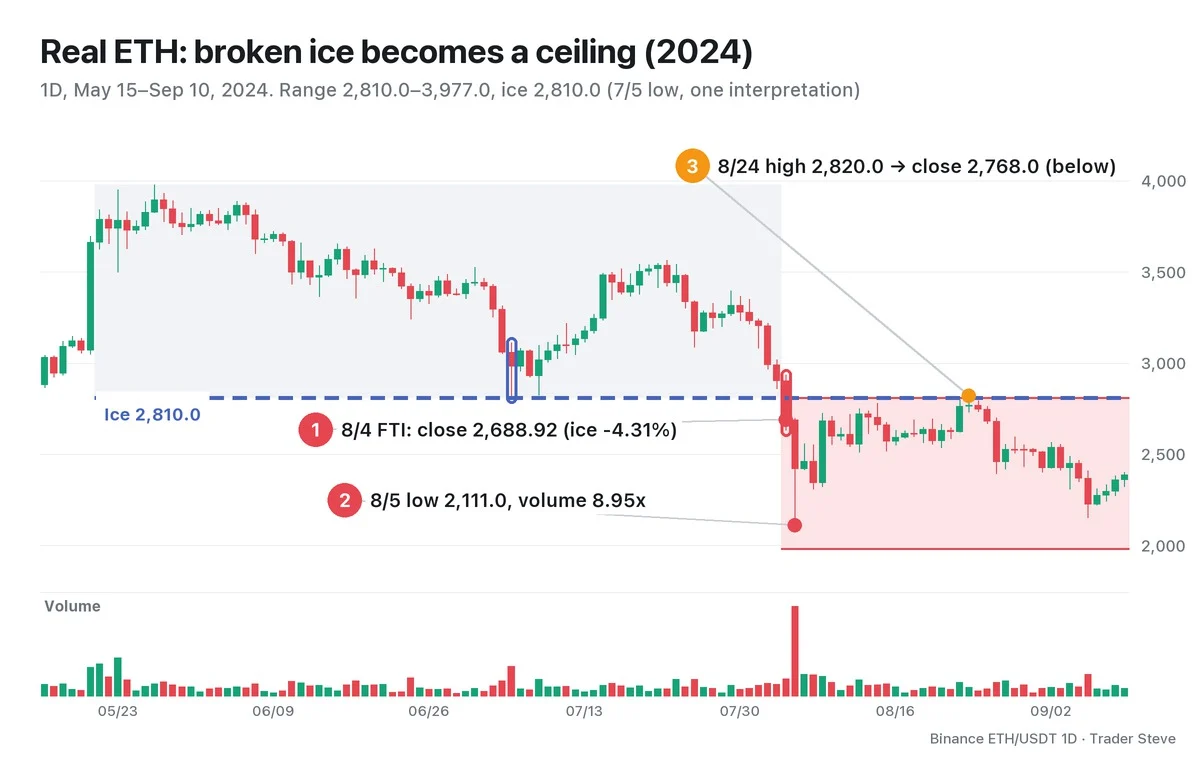
- The range: from the May 27 high of 3,977.0 to the Jul 5 low of 2,810.0. Jul 5 volume was 3.42x the 20-day average, and the Jul 8 low of 2,822.8 also held in the same band. I treat this 2,810.0 as the ice.
- ① FTI: the Aug 4 daily candle opened at 2,903.65 and closed at 2,688.92 (-7.4% from the previous day), a close 4.31% below the ice.
- ② Acceleration: the next day, Aug 5, the low reached 2,111.0, and volume was 8.95x the 20-day average.
- ③ Capped from below: the Aug 14 high of 2,780.0 stopped 1.07% below the ice. On Aug 24, the high of 2,820.0 poked 0.36% above the ice with a wick, but the close of 2,768.0 was below it, and volume had dried up to 0.57x the average. Three days later, on Aug 27, came a -8.3% day.
In the 60 days after the FTI, there was not a single close above the ice. It is a case where the spot the ice broke acted as a ceiling from then on.
"Let's say this is the low. It broke down through the support line at the bottom, the one it had been pushing along and that should at least have held. Then when it pushed back up to try to break through it, it got hit on the head and is getting pushed back down, right? So, in a word, this one's structure is just dead." — Trader Steve, live stream (Dogecoin daily chart), Aug 26, 2026 (translated from Korean) · ▶ Watch the stream highlights (Korean audio)
It's a different market, but the same structure. The break below the ice, the bounce capped from below, the dead structure: this whole topic fits into those few sentences.
Not every breakdown is an FTI, though. If price only pokes below with a wick and soon returns above the ice and holds, it may instead be a spring or a shakeout (a deceptive drop on the accumulation side). A real break needs three things together: a close below, a wide candle on heavy volume, and a failure to get back up. Telling these apart is the subject of Part 2.
Key Takeaways
- The ice is the support line at the bottom of a range that demand defended, the mirror image of the creek (the range ceiling).
- An FTI is a close below the ice on a wide bearish candle and heavy volume, a classic sign of weakness in distribution.
- The decline speeds up as the stop-loss orders clustered just below the ice fill all at once.
- Broken ice tends to become the ceiling for bounces, and a bounce high capped below it is an LPSY candidate.
- If price only pokes below with a wick and comes back, it may not be an FTI. Make the call from the candles that follow.
In Part 2, we'll cover which lows to draw the ice from and the conditions that separate a real breakdown (FTI) from a false breakdown, with a checklist and a scorecard. For support/resistance flips in general, see Basics Support and Resistance.
If drawing the range, the ice and the volume multiples by hand for every market is a chore, you can see a report that also lays out the Wyckoff structure through the link below.
This lesson adapts the text, figures and live-stream quotes of the Trader Steve TA series for the web, translated from the original Korean. Check the text and figure captions for the timing and interpretation of each real example, and read conceptual diagrams and real charts separately.
Corrections: support@omnisight.report


