Wyckoff's Three Laws: Supply and Demand, Cause and Effect, Effort vs. Result
Historical examples for learning · not current prices or trade recommendations.
Contents
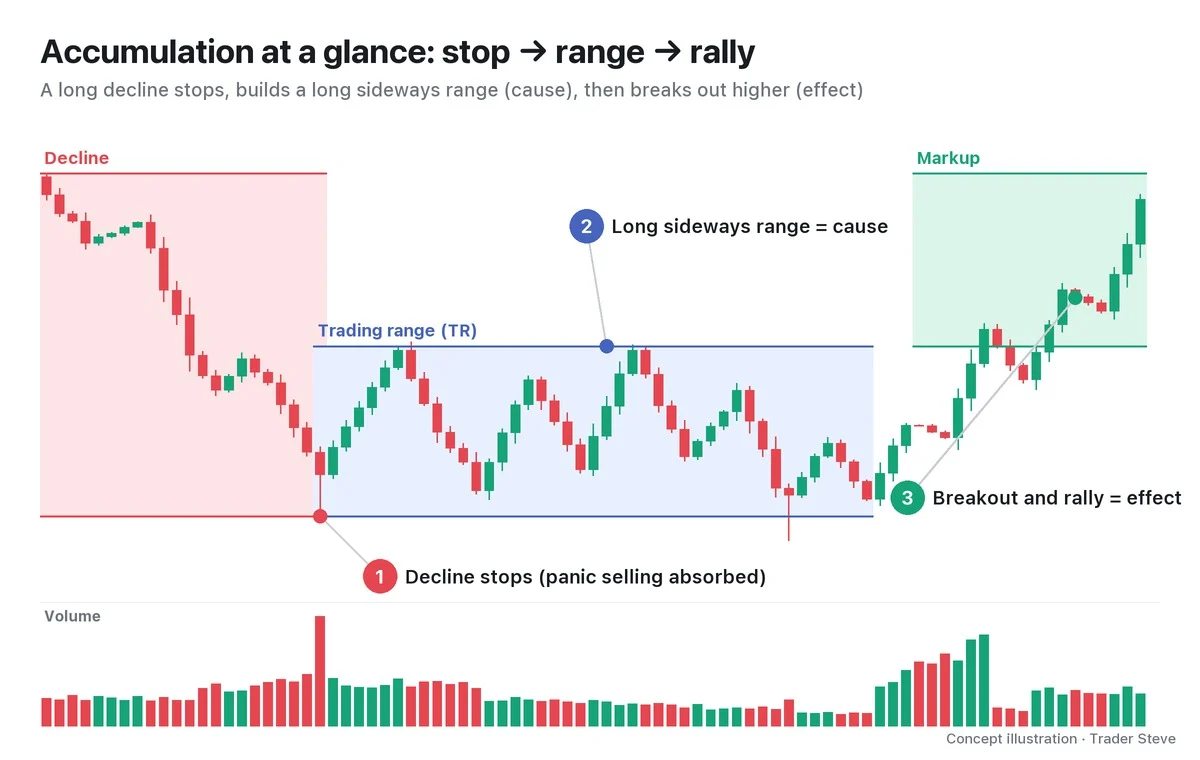
When you start studying Wyckoff, the first thing you run into is a list of event names: selling climax (SC), secondary test (ST), spring. Every one of those names grows out of three underlying principles. This lesson uses charts to show the three principles Wyckoff uses to read a chart (the three laws), and which of price, time and volume each one tells you to watch.
All dates and times are Korea Standard Time (KST, UTC+9). A daily candle is dated by its 09:00 KST open; intraday extremes are identified by their KST date and time.
1. Why Wyckoff Starts With the Laws
The Wyckoff Method is a way of reading charts developed by Richard Wyckoff (1873–1934), and its roots are the three laws below.
| Law | What it mainly watches | In one line |
|---|---|---|
| Law of supply and demand | Price (direction) | Price goes toward the side with more size |
| Law of cause and effect | Time (how long the range lasts) | Price moves as far as what was built up |
| Law of effort vs. result | Volume | Did price move as much as the volume? |
The event names are labels for scenes where these laws are at work, so once you understand the laws, the names follow. In the end, the three laws make one demand: read price, time and volume together, at the same time.
2. The Law of Supply and Demand: Price Is the Outcome of a Battle Over Size
The first law is the simplest. When the size buyers want to buy (demand) is larger than the size sellers want to sell (supply), price rises; when it's the other way around, price falls; when they're about even, price moves sideways.

The key point is that you don't look to the news for the answer to "why did it fall?" I put it bluntly on the live stream (talking about SK hynix, a Korean stock):
"Why is Hynix dropping? What's the reason price is falling? Some narrative, blah blah… No, no, no. It goes down because people are selling. If there are more sellers than buyers, it goes down. That's the market." — Trader Steve, live stream, Oct 19, 2026 (translated from Korean) · ▶ Watch the stream highlights (Korean audio)
A price also prints only when both sides meet. If no one is there to take the other side, no trade happens at all.
"Say I mint 'Trader Steve Coin.' And I sell a ton of it. Does it sell? Nobody buys it. … Selling means there has to be a buyer for the trade to execute and a price to print. If nobody is buying, how the heck are you supposed to unload any size?" — Trader Steve, live stream, Oct 20, 2026 (translated from Korean) · ▶ Watch this moment (Short, Korean audio)
So supply and demand is a battle of size, not of headcount. On a chart, size shows up as volume. By looking at whether volume concentrates on up candles or down candles, you can estimate who is winning.
3. The Law of Cause and Effect: The Range Is the Cause, the Trend Is the Effect
The second law says that a trend (the effect) doesn't appear out of nowhere. A big trend is usually preceded by a long sideways trading range (TR). Wyckoff calls what happens inside it the cause: big players buying up size (accumulation) or unloading it (distribution).
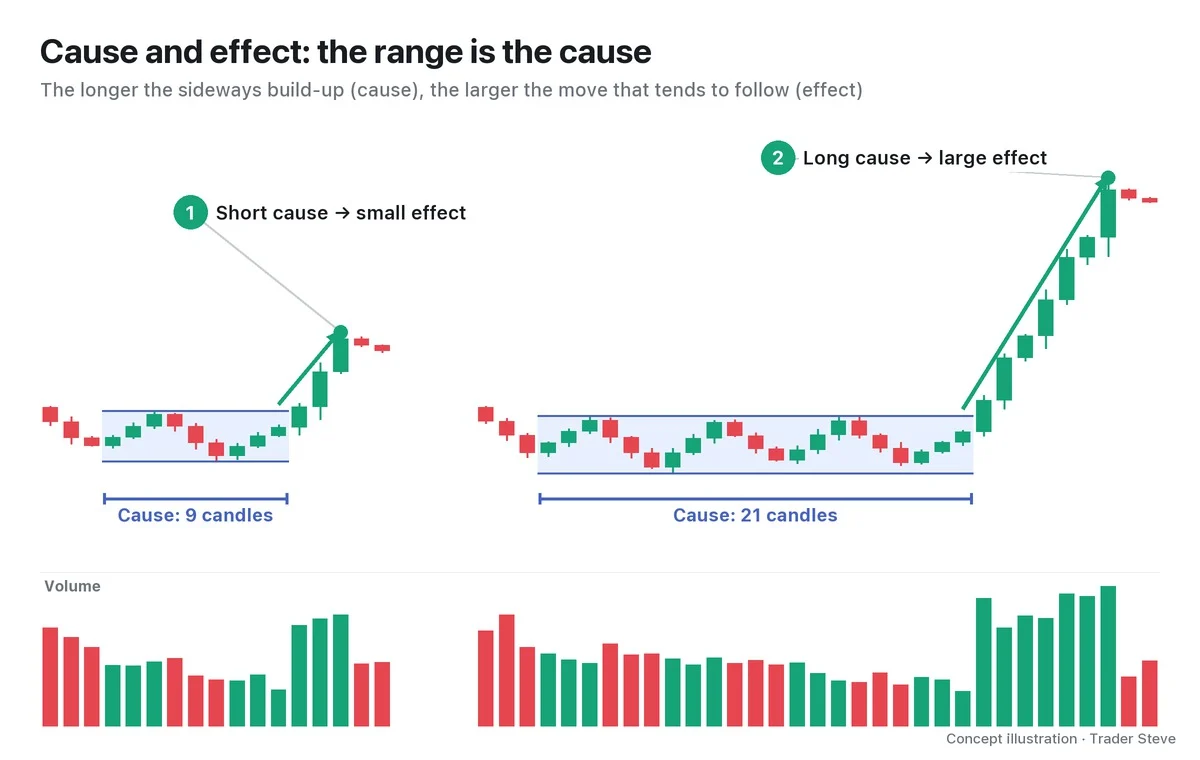
The larger and longer the cause, the larger the effect tends to be. The more size you hold, the farther you can carry it before you sell. I compare it to running a trading business:
"Say you guys are merchants who buy and sell goods. Here in Korea, you bought this many — 100 units — of a good called Bitcoin. You go far away to sell them … and you arrive in the US. Getting there costs a fortune. … If you haul over a measly 100 units and sell all 100, you might barely cover your expenses, right? Why would you do something that loses money?" — Trader Steve, live stream, Aug 21, 2026 (translated from Korean) · ▶ Watch the stream highlights (Korean audio)
In other words, if the size held (the cause) is small, there is nothing left over after traveling far, so a big move (the effect) rarely comes. The formal way to measure distance from the size of the cause is the point-and-figure (P&F) count, which is covered separately.
4. The Law of Effort vs. Result: Volume Is the Effort, Price Change Is the Result
The third law treats volume as effort and price change as result. You read the result from the body size, the high-to-low range, and whether the close finished near the top or the bottom of the candle.
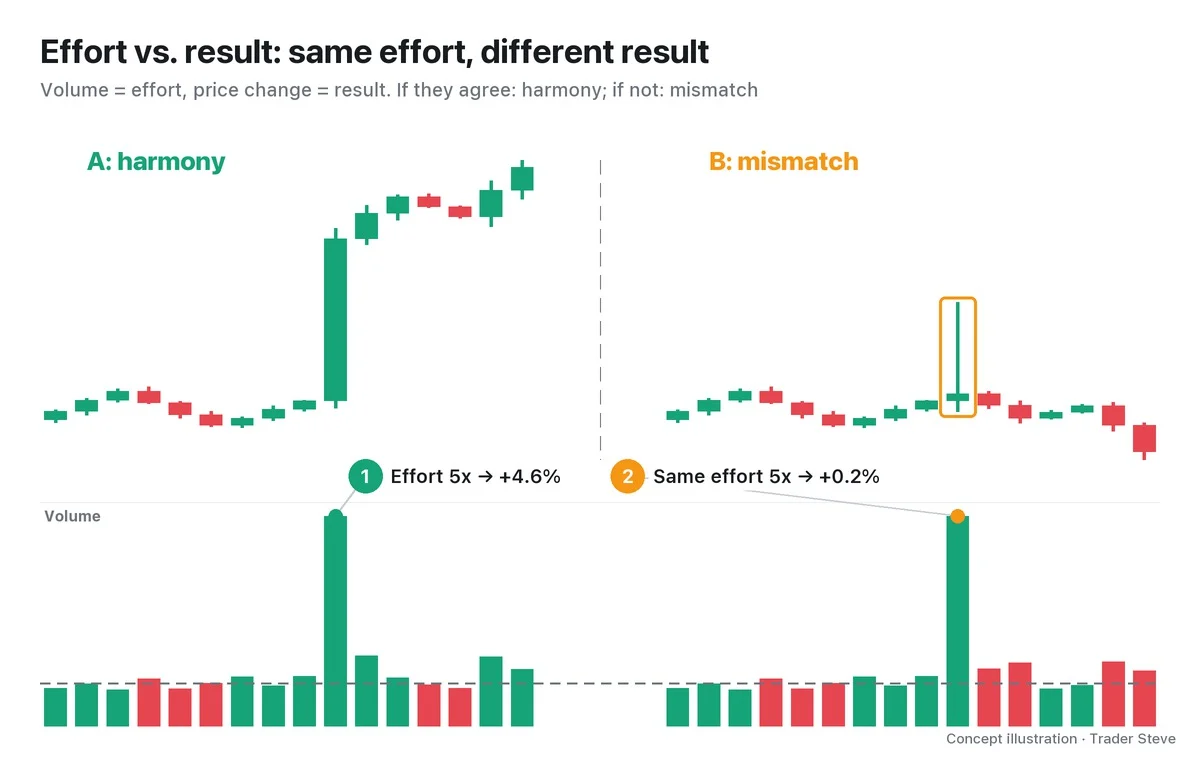
- Harmony: big effort, big result. Momentum is building in that direction, so the trend is likely to continue.
- Mismatch (divergence): big effort with a small result, or small effort with a big result. The other side may be absorbing the size, or the side doing the pushing may have run out of size, so read it as a warning that direction may change. Wyckoff texts call this divergence; this series says "mismatch" to keep it separate from indicator divergence.
If price keeps getting pushed down while volume shrinks steadily, the effort on the selling side is fading. Here is what I said looking at the 4-hour chart of a 3x leveraged US semiconductor exchange-traded fund (ETF), SOXL:
"Volume keeps shrinking. Actually, if you think about it by Wyckoff's standards, they've pushed the selling really hard by now. There's no size left to sell. It means they want to dump more and push price down further, but there's no size left to push it down with." — Trader Steve, live stream, Sep 2, 2026 (translated from Korean) · ▶ Watch the stream highlights (Korean audio)
I don't use the name "three laws," but I talk about the same ideas on the live stream all the time. The basics of reading volume bars are in the Basics Volume topic.
5. The Three States of Supply and Demand on a Real Bitcoin Chart
I split the Bitcoin (BTC) daily chart for May–Sep 2026 into three segments and calculated the average volume of up days and down days in each.
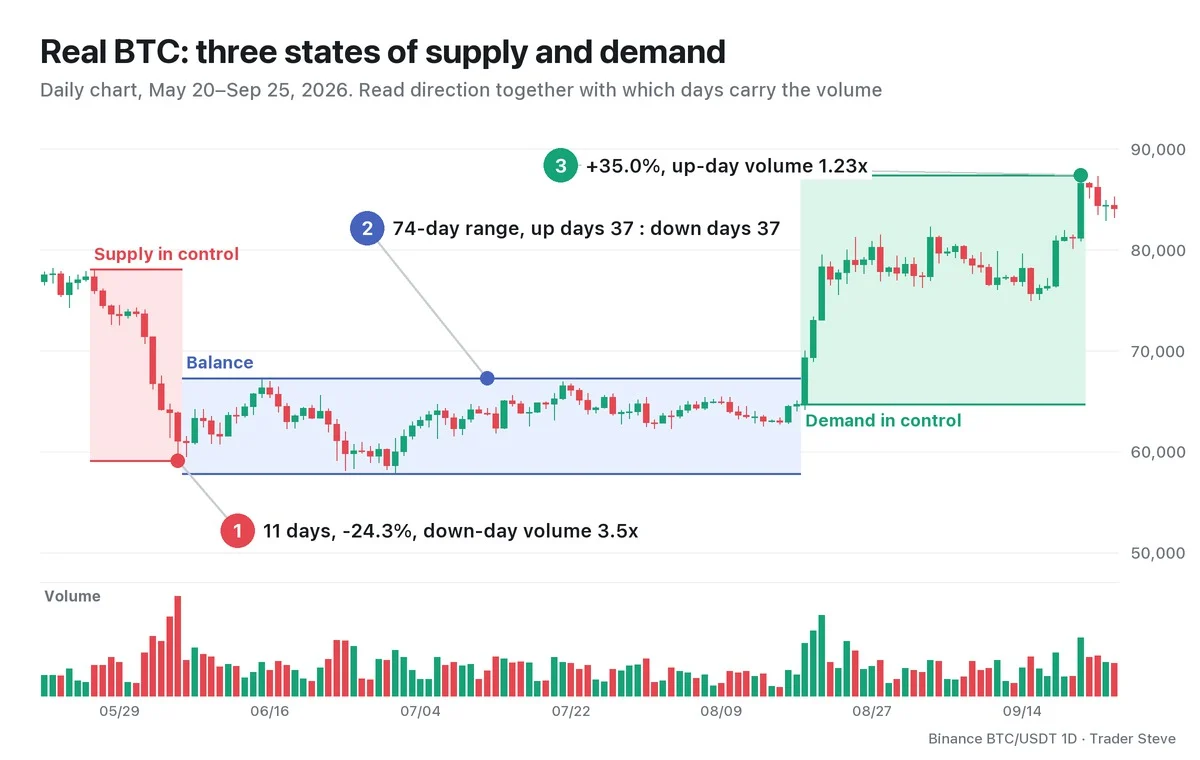
| State | Period | Price | Up days : down days | Average volume (up days / down days) |
|---|---|---|---|---|
| ① Supply in control | 5/26–6/5 (11 days) | 78,080 → 59,131 (-24.3%) | 1 : 10 | 7,515 / 26,630 BTC |
| ② Balance | 6/6–8/18 (74 days) | 57,800–67,292 | 37 : 37 | 14,948 / 15,742 BTC |
| ③ Demand in control | 8/19–9/21 (34 days) | 64,725 → 87,396 (+35.0%) | 20 : 14 | 19,068 / 15,531 BTC |
① In the decline, average volume on down days was 3.5x that of up days: the selling side's size overwhelmed. ② In the 74-day range, up days and down days were tied at 37 each, and average volume was similar. ③ In the rally, volume on up days was 1.23x that of down days, tilting toward demand.
Note two things. First, the skew in the decline (3.5x) was much larger than in the rally (1.23x). The degree of skew differs every time, so don't memorize any single multiple as a benchmark. Second, the large move in ③ came after 74 days of balance. That is the shape the law of cause and effect describes, but this is only a reading of a past chart; the same shape does not guarantee the same outcome.
The same period seen from the big players' point of view continues in the Wyckoff Composite Man topic, and the accumulation–distribution cycle in the Wyckoff Market Cycle topic.
Key Takeaways
- Supply and demand: direction is decided by the battle between the size buyers want to buy and the size sellers want to sell.
- Cause and effect: the longer and larger the range (cause), the larger the trend that follows (effect) tends to be.
- Effort vs. result: check whether price (result) moved as much as volume (effort). If they agree, it's harmony; if not, it's a mismatch.
- A mismatch is only a warning, not a confirmed signal. Check all three laws together.
In Part 2, we'll cover how to confirm the three laws on a chart using volume, the range and close location.
Doing this math by hand for every market takes real time. The Omnisight Report lays it out for each market.
This lesson adapts the text, figures and live-stream quotes of the Trader Steve TA series for the web, translated from the original Korean. Check the text and figure captions for the timing and interpretation of each real example, and read conceptual diagrams and real charts separately.
Corrections: support@omnisight.report