
What Is an LPS? The Wyckoff Last Point of Support and Why It Forms
Historical examples for learning · not current prices or trade recommendations.
Contents
Price punches out of a range decisively, then a few days later it starts creeping back down, and a lot of traders get nervous: "Was that a false breakout?" Wyckoff gave a name to one special pullback among these. It is the last point of support (LPS). By the end of this lesson, you'll be able to explain, with four images, what an LPS is, where it sits on the accumulation map, why it forms and what it looks like.
All dates and times are Korea Standard Time (KST, UTC+9). A daily candle is dated by its 09:00 KST open; intraday extremes are identified by their KST date and time.
1. The One-Line Definition and Its Place on the Accumulation Map
An LPS is the low of a pullback that comes after demand has won in an accumulation range. It holds higher than the earlier lows, on narrow candles and shrinking volume. Put simply, it is "the spot where the remaining supply was tested one last time and still could not drag price down."
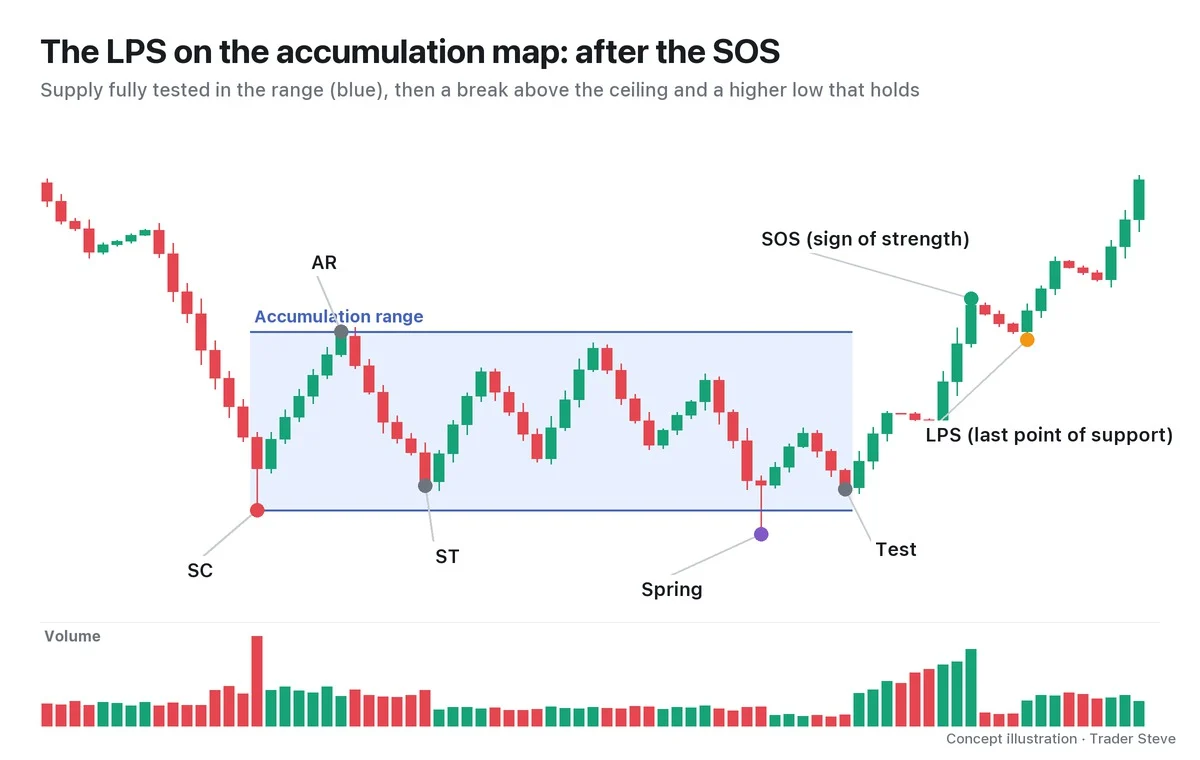
Inside an accumulation range, several events play out in order: the selling climax (SC), where panic selling makes the bottom; the automatic rally (AR), the bounce high; the secondary test (ST), which checks the bottom again; and the spring, a brief poke below the bottom, followed by its test. Those all happen inside the range. An LPS inside the range is a spot where, after the spring and test, a higher low on dried-up volume shows that demand has the upper hand. An LPS above the range comes next: a sign of strength (SOS) clears the range ceiling on volume, and when that rally pauses and pulls back, the low of that pullback is the LPS. In the illustration, the LPS sits higher than every earlier low: the SC, the ST, the spring and the test.
Each event and the flow of Phases A–E are covered in Wyckoff Accumulation Phases (related lesson), and the event just before the LPS in Wyckoff Sign of Strength (related lesson). This lesson focuses on the most common LPS: the one that forms after the SOS, near the range ceiling.
2. Why It Forms: Checking Demand Once More at the Old Ceiling
There is a reason price that clears the ceiling doesn't just take off, and comes back instead. Right after a breakout, two kinds of selling hit at once: profit-taking from those who bought cheap inside the range, and breakeven selling from those who were trapped near the range ceiling. Late buyers who chased the breakout also dump if they get shaken. The market gets pushed back for a while as it absorbs that supply.
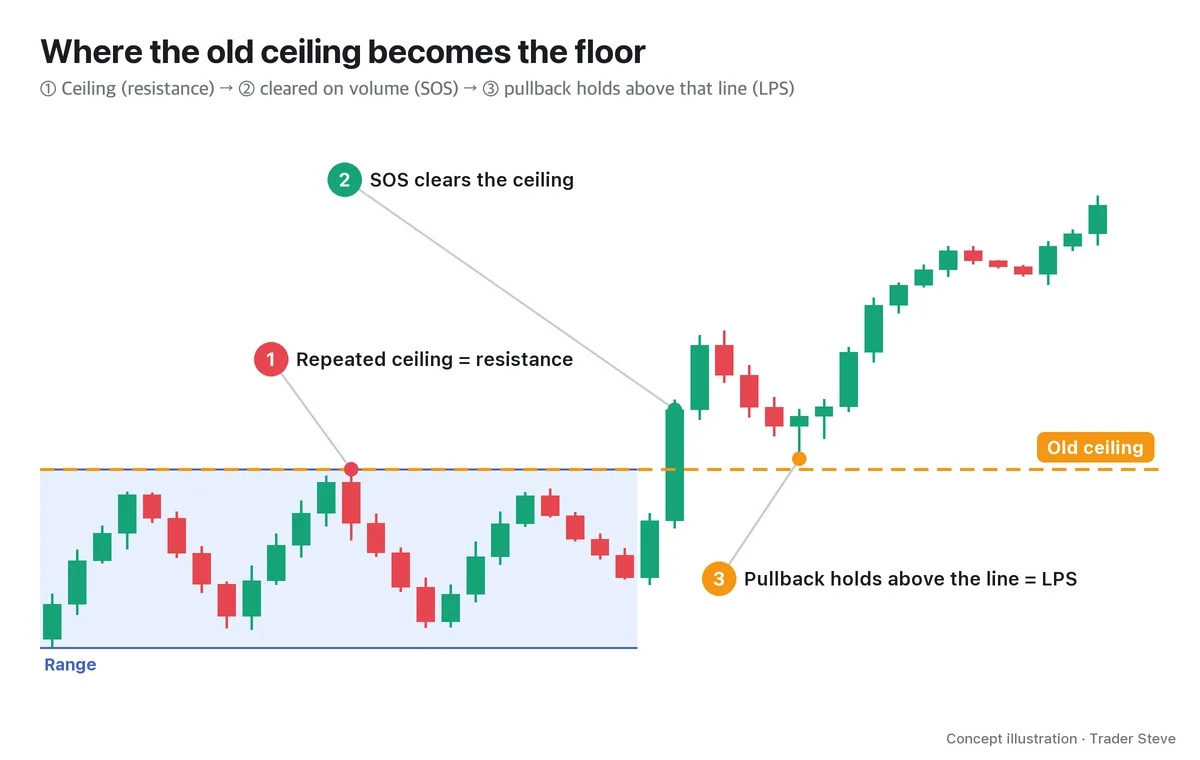
The key is who takes the other side of that supply. If demand is real, price stops near the old ceiling. The line that used to cap price from above now supports it from below, the so-called support/resistance flip (S/R flip). The flip itself is covered in detail in Basics Support and Resistance (related lesson).
Explaining the big picture on Bitcoin, I described this process as price "stepping on" the level.
"Like I said, these are spots price pretty much has to step on once … I think stepping down to places like this once before moving on is, structurally too, the textbook move." — Trader Steve, live stream, Aug 27, 2026 (translated from Korean) · ▶ Watch the stream highlights (Korean audio)
By "the textbook move" I mean the standard play: it is structurally natural for price to press down once, confirm support and then move on, and that is exactly the scene Wyckoff calls an LPS.
3. What an LPS Looks Like: Higher Low, Narrow Candles, Dry Volume
Even among pullbacks, you can recognize an LPS by a few traits. In Wyckoff, the most important one is volume.
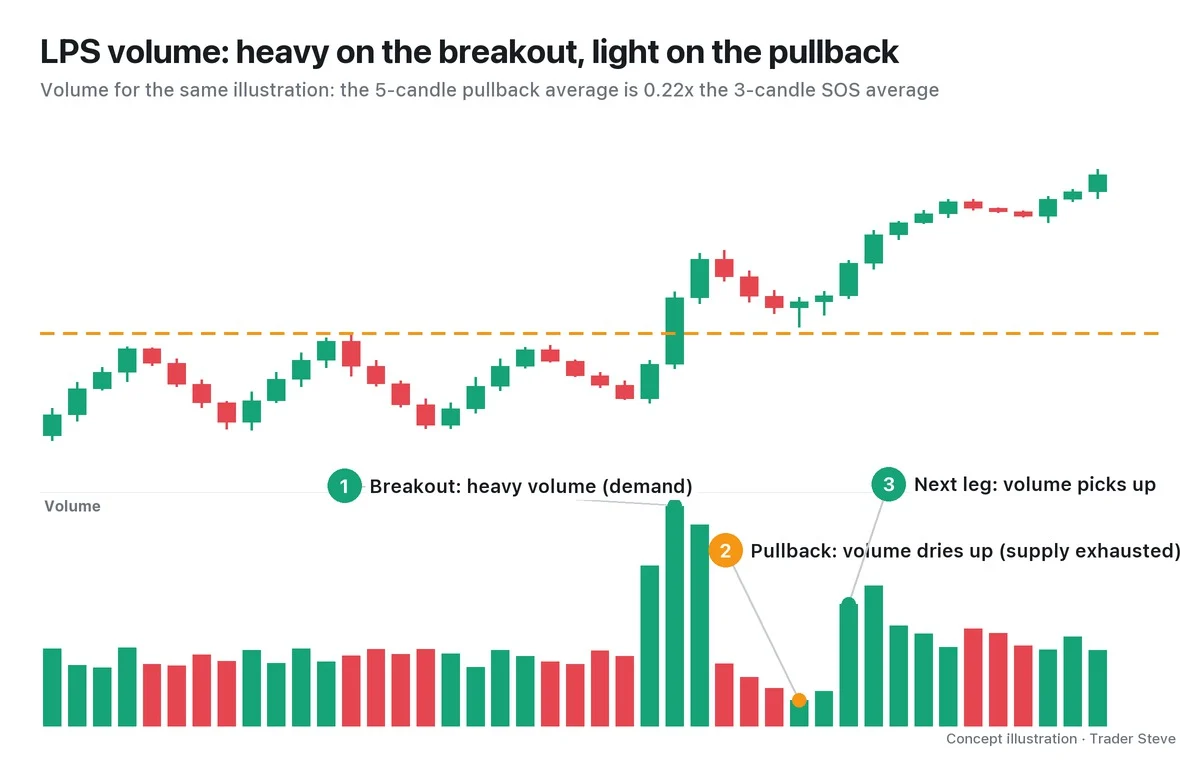
- Higher low: price stops above the lows inside the range, usually near the old ceiling or above it.
- Narrow candles: the high-to-low range (spread) of the pullback candles is smaller than the SOS candles'. That means the selling pressure is weak.
- Shrinking volume: volume during the pullback is clearly lower than during the SOS. In the illustration, the five-candle pullback average is 0.22x the three-candle SOS average. It signals that there weren't many sellers and price simply drifted down on a little selling, not that supply flooded in.
- Close above the line: the low candle leaves a lower wick and closes above the old ceiling. It does not close back inside the range.
On the other hand, if a wide bearish candle on heavy volume closes below the old ceiling, that is not an LPS. It is a sign that supply is winning again. The identification checklist comes in Part 2, and failed cases get their own look in Part 5.
4. A Real ETH Daily Chart: The Old 1,751 Ceiling Becomes the Floor
Now let's check this on a real Ethereum (ETH) daily chart. The event names below are one interpretation, applied in hindsight.
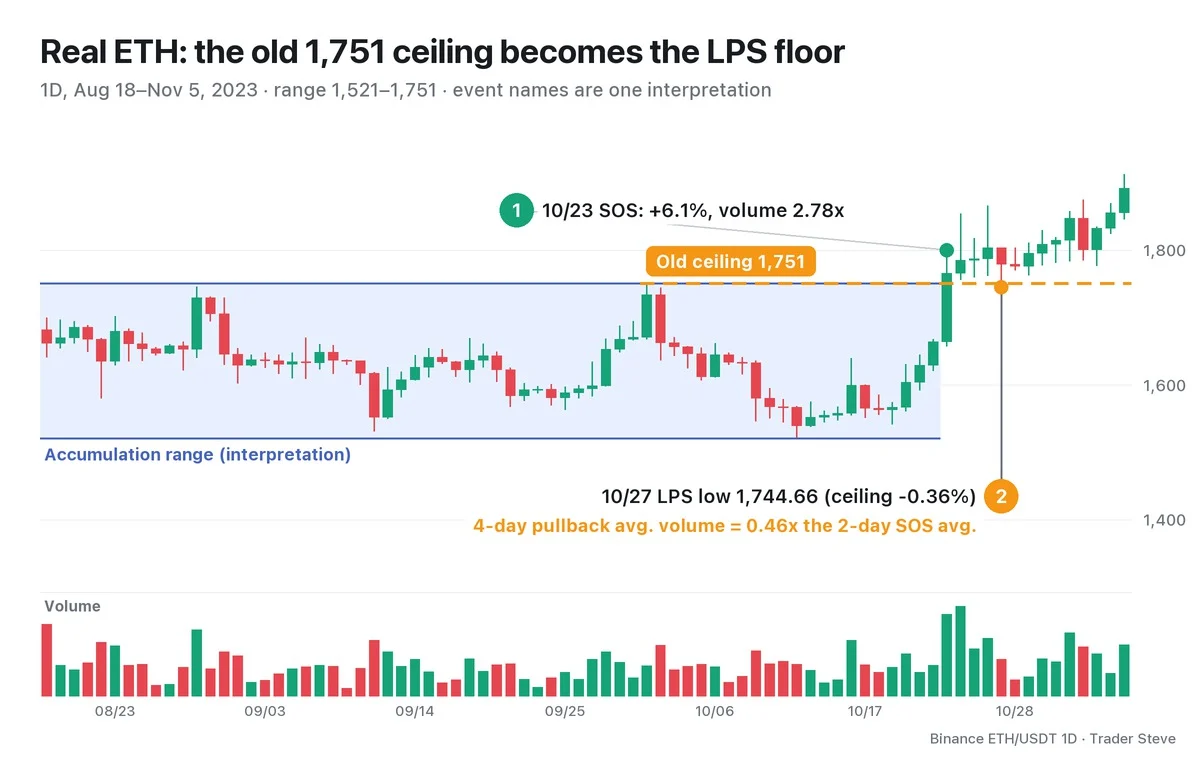
From Aug 18 to Oct 22, 2023, Ethereum moved in a 1,521–1,751 range (about 15.1%). The 1,751 ceiling is the Oct 1 high. The Oct 23 daily candle rose 6.1%, from a 1,663.69 open to a 1,765.46 close, the first close above the ceiling, on 2.78x the average volume of the previous 20 days (①). Volume the next day was 2.81x.
In the four-day pullback that followed (Oct 25–28), the lowest point was the Oct 27 low of 1,744.66 (②). It poked 0.36% below the old ceiling, but the close, 1,779.40, was above the line, and the candle's range of 3.3% was far narrower than the SOS candle's (8.6%). Volume on this low candle was at a normal level (0.98x), and the next day it dried up to 0.43x. Average volume over the four pullback days was 0.46x the two-day SOS average. And from the SOS through Nov 5, not a single day closed below the ceiling. The four traits above showed up almost exactly.
One more note: the old ceiling and the LPS low both sit inside the daily bullish fair value gap (FVG) left by the Oct 23 SOS candle (1,667.80–1,756.21). Stacking confluence like this is a topic for Part 5.
On the live stream, I don't use the name "LPS"; I say price "steps on the retest and climbs." I said this looking at the chart of SOXL, a US leveraged exchange-traded fund (ETF), and it shows well why Wyckoff's LPS confirms a change in direction.
"It broke the structure like this, came up, and it's stepping on the retest and climbing, so the direction has definitely turned to the upside." — Trader Steve, live stream, Aug 28, 2026 (translated from Korean) · ▶ Watch the stream highlights (Korean audio)
5. "Last" Is Something You Only Know Afterward
The name LPS has a trap in it. Whether a low really was the "last" point of support only becomes clear after price has left it behind. While a pullback is still unfolding, you cannot confirm whether it is an LPS or a failure that collapses back into the range.
So in real time, call it an "LPS candidate," and decide in advance what would prove you wrong. The most basic invalidation condition is a candle that closes below the old ceiling (back inside the range) on rising volume. Keep in mind that the ETH case above looks clean partly because the outcome is already known. An LPS is not a buy button; it is the spot where you test the hypothesis that demand is winning.
Key Takeaways
- An LPS (last point of support) is the higher low of a pullback that comes after demand has won.
- On the accumulation map, it comes after the SOS, just before the real rally. The most common spot is near the old range ceiling.
- It is the process of absorbing the profit-taking and breakeven supply that follows a breakout, and confirming whether old resistance turns into support.
- Its look: higher low · narrow candles · shrinking volume · close above the line.
- Whether it was the "last" one, you only know afterward. In real time, treat it as a candidate and set the invalidation condition first.
In Part 2, we'll cover the two places an LPS forms (inside the range and above it) and a checklist for identifying one.
Calculating the old ceiling, volume multiples and pullback ratios by hand for every market takes real time. If you want an analysis that pulls several theories together in one place, see the report below.
This lesson adapts the text, figures and live-stream quotes of the Trader Steve TA series for the web, translated from the original Korean. Check the text and figure captions for the timing and interpretation of each real example, and read conceptual diagrams and real charts separately.
Corrections: support@omnisight.report


