
What Is an LPSY? The Wyckoff Last Point of Supply and Why It Forms
Historical examples for learning · not current prices or trade recommendations.
Contents
Once a chart has started to fall, there is always a moment when it feels like "here comes the bounce." Wyckoff gave a name to the top of the especially weak ones among those rallies: the last point of supply (LPSY). This lesson uses illustrations and a real Ethereum (ETH) chart to show what an LPSY is, where it appears in a distribution structure and why it forms.
All dates and times are Korea Standard Time (KST, UTC+9). A daily candle is dated by its 09:00 KST open; intraday extremes are identified by their KST date and time.
1. The One-Line Definition: The Top of a Weak Rally After a Sign of Weakness
An LPSY is the top of a rally that drifts up without strength and stalls after a sign of weakness (SOW) in a distribution structure.
- An SOW comes first. There has to be a decline that breaks the support line at the bottom of the range on a wide bearish candle and heavy volume. Without an SOW, the top of just any rally is not called an LPSY.
- The rally is weak. The candles' range (the spread) is narrow, and volume shrinks.
- It is capped low. The high stalls below the broken support line or below the middle of the range.
The Y at the end of the abbreviation comes from supply. It is there so you don't confuse it with its mirror image on the accumulation side, the last point of support (LPS).
2. Where the LPSY Sits in a Distribution Structure
An LPSY never appears on its own. It has a fixed place in the sequence of a distribution structure, in which big players sell off their size in pieces.
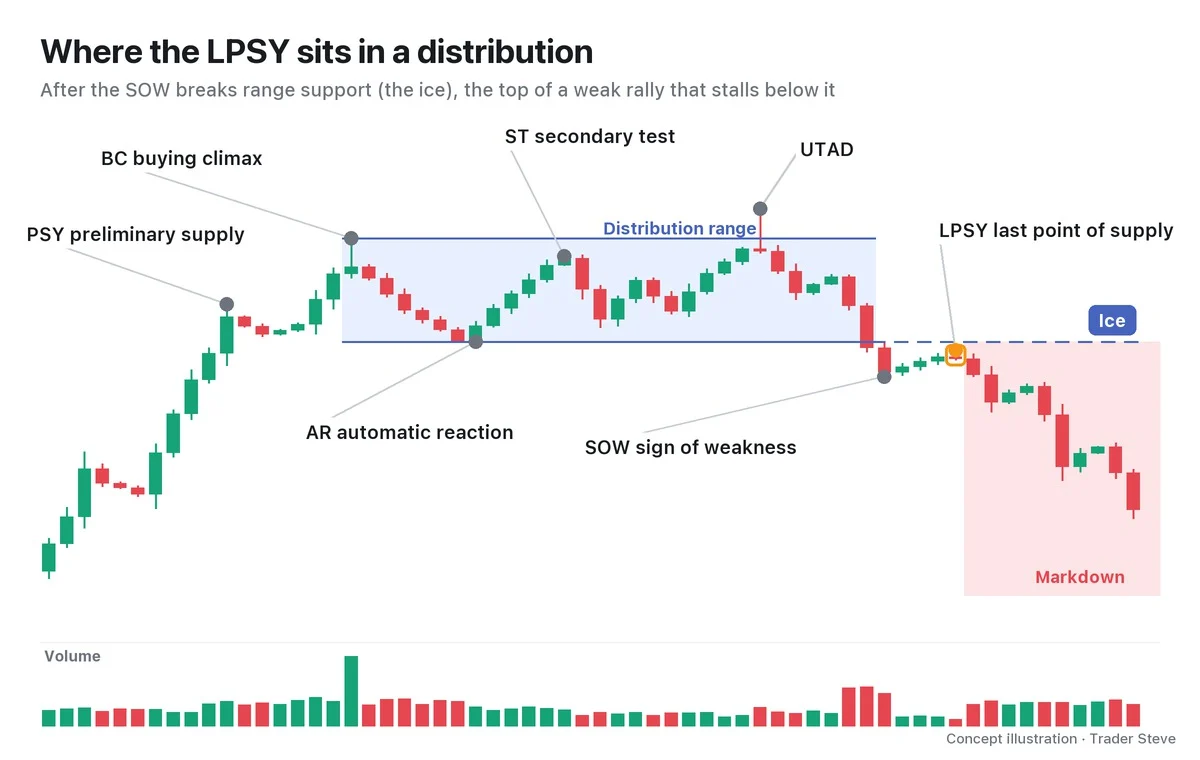
Here is the sequence by name only. At the end of a rally comes preliminary supply (PSY), the first wave of selling; then the buying climax (BC), where overheated buying piles in; the automatic reaction (AR), the first sharp drop after it; the secondary test (ST), which tests the high again; and the upthrust after distribution (UTAD), which pokes above the range and comes back. Together these build the range. Next, the SOW breaks the support line at the bottom of the range, and the top of the weak rally that follows is the LPSY. In the textbook picture, the real decline follows from there.
In Wyckoff, the support line at the bottom of the range is called the ice. Once the line that held price up like a sheet of ice breaks, it turns around and becomes resistance pressing down from above. That is why an LPSY often stalls below this ice. How to draw the ice is covered separately in the next topic.
3. What an LPSY Rally Looks Like
The key to recognizing an LPSY is not how high the rally goes but how much strength it has.
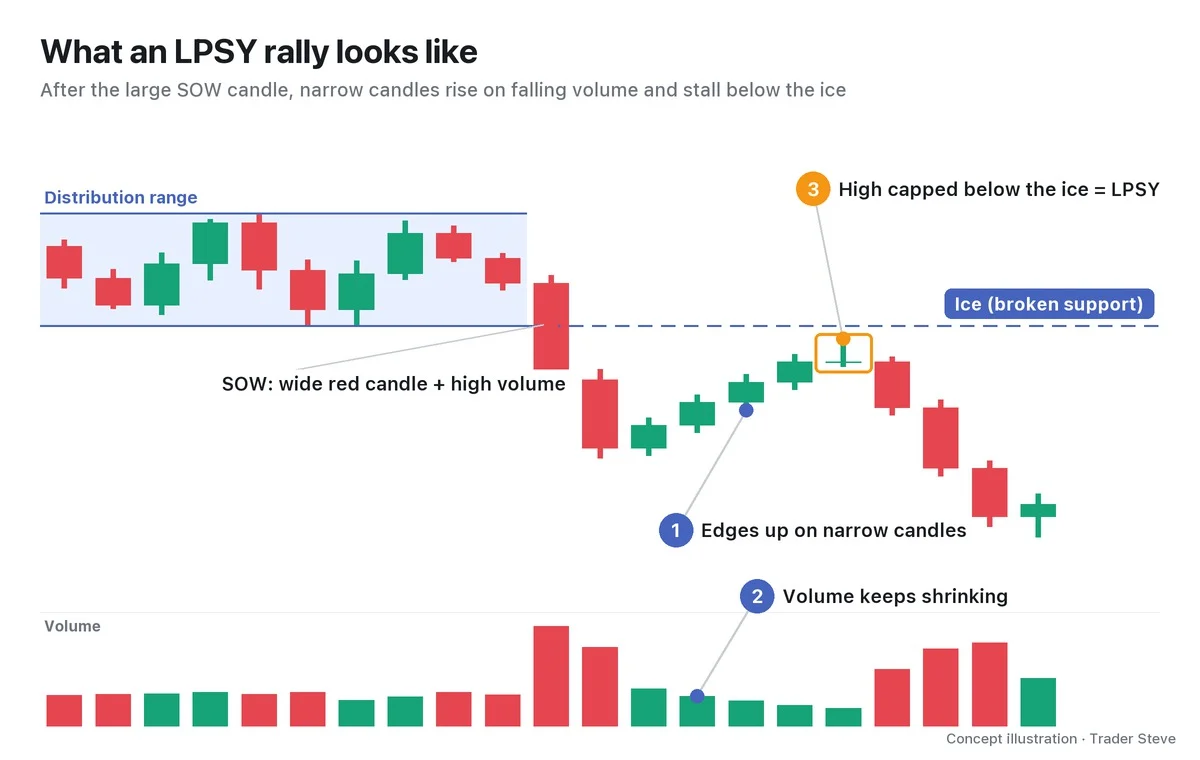
- Narrow candles: The SOW bearish candle was long and wide, but the rally candles are narrow. That means the buying lifting price is weak.
- Shrinking volume: Volume is lower on the rally than on the decline. That means not many new buyers are stepping in.
- A low high: Price doesn't even reach the old support line, and the top candle often gets pushed off its high and finishes in the lower part of the candle.
The LPS in an accumulation structure is this picture flipped upside down. The low of a pullback on shrinking volume after a sign of strength is an LPS; the top of a rally on shrinking volume after a sign of weakness is an LPSY.
4. Why It Forms: The Remaining Size Is Handed to Whoever Buys the Rally
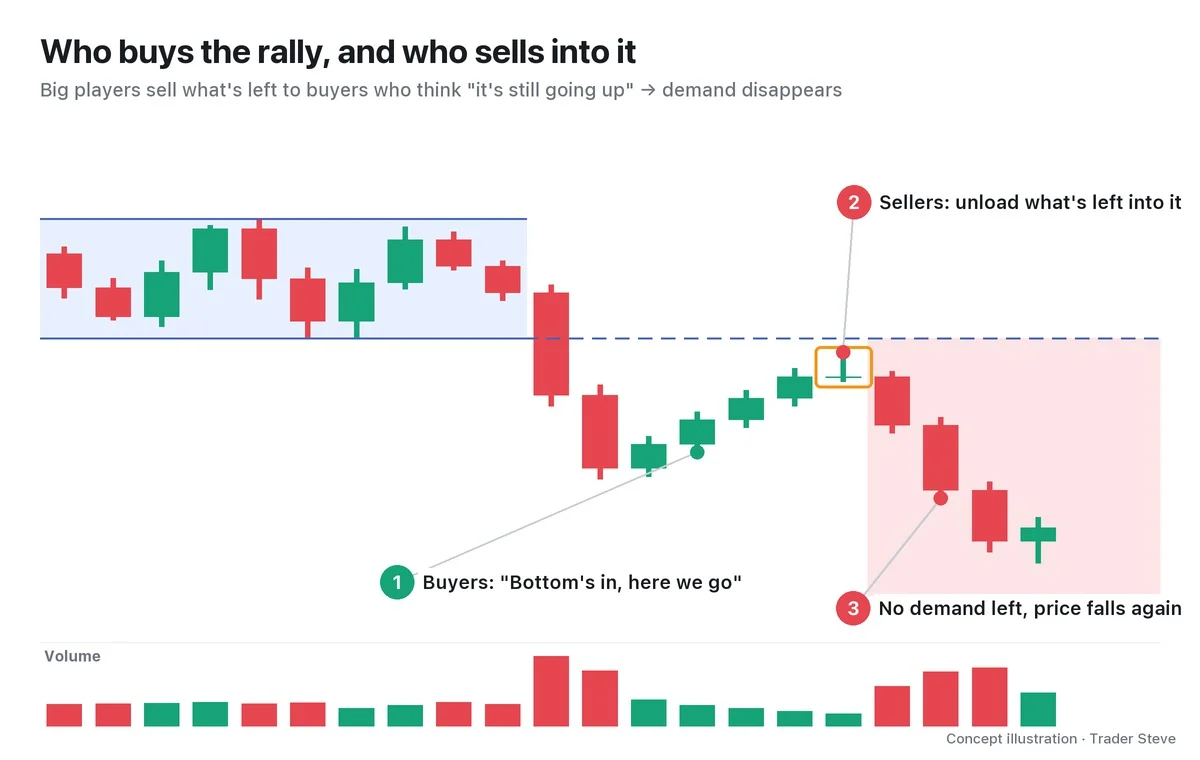
Even after the big picture has already turned into a downtrend structure, some people buy every rally, convinced that "it's still going up" or "the bottom is in." For big players who haven't finished distributing, that buying is a chance to hand off the size they still hold.
On a live stream, I explained the principle of reading the structure first like this.
"When you trade, you have to work out properly whether, in the big picture, you're inside an uptrend structure like this, or inside a downtrend structure like this … In a bull market, when a drop comes and everyone says it's all over, you buy it from down below. In a bear market, when a strong rally comes along that tempts you and gets your heart racing, that's when you hit the short. If you don't understand this, then — sorry to say it — you just become one of the small traders whose job is to supply the market with liquidity." — Trader Steve, live stream, Oct 12, 2026 (translated from Korean) · ▶ Watch the stream highlights (Korean audio)
The point is that a rally inside a downtrend structure looks like an opportunity to the people buying it, but to the big players it is a place to sell. The next quote came the day after the weekly candle of SOXL, a 3x leveraged US semiconductor exchange-traded fund (ETF), closed at the very bottom of its range, as I watched it bounce. It is included not to call the direction of that ticker, but because it shows what a rally means to each side.
"Of course you can get a rally like today's, pushing price up. … Plenty of you guys are going to go, 'See, semiconductors aren't dead,' with your hearts on fire, and start soaking up size again right here — I'm sure there are people like that. Sorry, but size is being dumped on you guys right now. While you're soaking it up, they're busy throwing size right at you." — Trader Steve, live stream, Oct 19, 2026, on SOXL (translated from Korean) · ▶ Watch this moment (Short, Korean audio)
Once the people buying the rally have finished buying, there is no one left to buy more. The top where the rally stops at that point is the LPSY, and Wyckoff reads it as evidence that "demand has run out."
5. Real ETH, 2025: Three LPSY Candidates Stepping Down Like Stairs
On a real chart, this kind of rally can show up several times instead of just once. Let's read the Ethereum daily chart from fall 2025 as one interpretation.
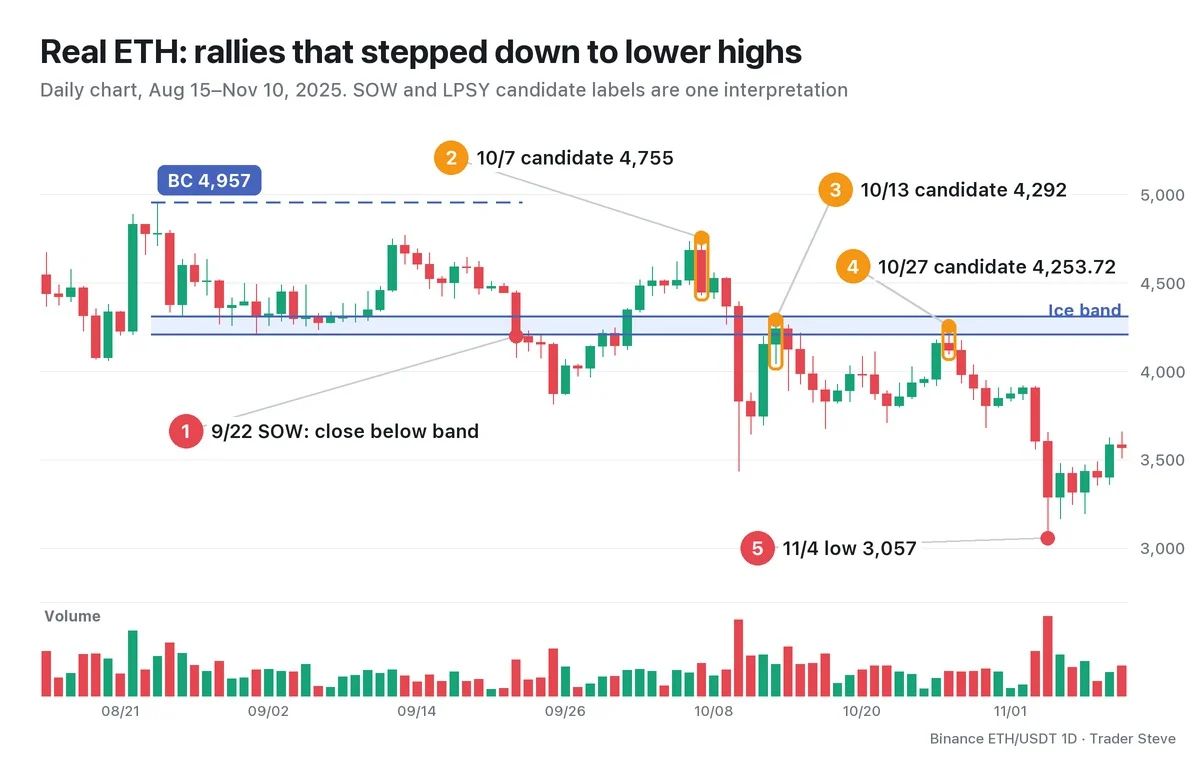
I take the Aug 24 high of 4,956.78 as the BC, and the zone between the Aug 26 low of 4,311.04 and the Sep 1 low of 4,210.61 as the ice band.
- Sep 22 SOW: The candle closed below the band at 4,199.08. Its range was 8.5%, and volume was 1.90x the previous 20-day average. The Sep 22–25 down leg averaged 1.55x, and the Sep 25 low was 3,815.
- Oct 7 candidate (inside the range): A rally on average volume of 1.03x carried price back inside the range, but the 4,755 high was lower than the ST and the BC, and the candle closed almost at its very low. Three days later, on Oct 10, the low was 3,435.
- Oct 13 candidate (inside the band): The high of 4,292 was capped inside the ice band.
- Oct 27 candidate (inside the band): The rally's average volume was the driest at 0.61x, the candle range was 3.8%, and the close was in the lower part of the candle. This is the closest to the textbook picture.
- Nov 4: A decline on 3.29x volume took price down to 3,057, below the Oct 10 low. That is 28.1% below the Oct 27 high.
From Oct 10 through Nov 10, the highest close was 4,240.85; price never once closed above the top of the ice band. This is broken support turning into resistance.
6. "Last" Is a Name Given in Hindsight
On the chart above, you could not have said "this is the last point of supply" on Oct 7, or on Oct 13, because an even lower rally came after each of them. The name "last" only applies once price has gone on to fall below the prior low.
So in real time, you call it an "LPSY candidate" and, at the same time, set the criteria that would prove you wrong. If price reclaims the ice on a closing basis with wide candles and heavy volume, drop the supply-side reading. That's because there is always another reading of the same candles as an accumulation-side event.
Key Takeaways
- An LPSY is the top of a weak rally that comes after an SOW.
- It looks like narrow candles, shrinking volume and a high capped below the ice (or the middle of the range).
- It is where big players hand off their remaining size to buyers who believe "it's still going up."
- "Last" is a name given in hindsight, so in real time you keep a candidate label together with invalidation criteria.
In Part 2, we'll cover the two places an LPSY forms (inside the range and below the ice) and a checklist for identifying it.
This lesson adapts the text, figures and live-stream quotes of the Trader Steve TA series for the web, translated from the original Korean. Check the text and figure captions for the timing and interpretation of each real example, and read conceptual diagrams and real charts separately.
Corrections: support@omnisight.report


