The Wyckoff Market Cycle: Accumulation, Markup, Distribution, Markdown
Historical examples for learning · not current prices or trade recommendations.
Contents
Zoom out on any chart and you see the same rhythm: price drifts sideways for a while, makes a big move one way, drifts sideways again, then moves the other way. Wyckoff organized that repetition into a four-phase cycle. This lesson uses charts to show what each of the four phases is, why the cycle repeats, and how one full turn played out on the real Bitcoin (BTC) weekly chart.
All dates and times are Korea Standard Time (KST, UTC+9). A daily candle is dated by its 09:00 KST open, and intraday extremes are identified by their KST date and time.
1. The One-Line Definition: Two Ranges, Two Trends
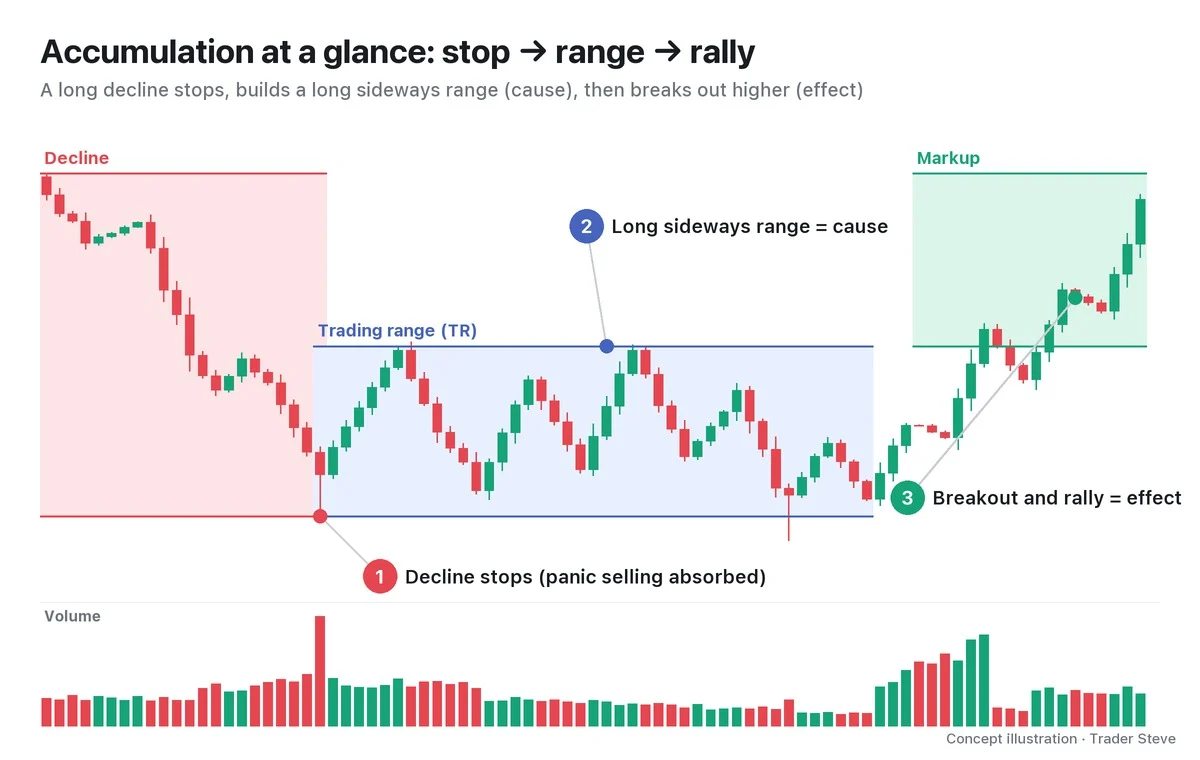
The Wyckoff price cycle (also called the market cycle) is Wyckoff's big-picture view that price repeats accumulation → markup → distribution → markdown.

- Accumulation: a range that moves sideways at the bottom after a long decline
- Markup: the stretch after price leaves the accumulation range to the upside, with highs and lows both rising
- Distribution: a range that moves sideways at the top after a long rally
- Markdown: the stretch after price leaves the distribution range to the downside, with highs and lows both falling
In other words, two sideways ranges alternate with two trends. A period of building up sideways is followed by a period of moving in one direction.
Note that Wyckoff's "Phases A–E" are something else: they are the detailed steps by which an accumulation or distribution range forms and leads into the trend outside the range. Phase E is the markup or markdown that has already left the range. To keep the two apart, this series uses "phase" on its own for the four parts of the cycle, and always writes the lettered steps with their letter (Phase A, Phase B and so on).
2. The Four Phases at a Glance
| Phase | Where | Price action | Volume | Who buys, who sells |
|---|---|---|---|---|
| Accumulation | At the bottom after a long decline | Moves up and down inside a range | Heavy during the panic selling early in the range, then shrinks | Big players absorb the selling from exhausted holders |
| Markup | Above the accumulation range | Highs and lows both rise | Comes on the rising candles | Big players hold on; the crowd piles in late |
| Distribution | At the top after a long rally | Moves up and down inside a range | Heavy, yet price goes nowhere | Big players hand their position to the crowd that followed |
| Markdown | Below the distribution range | Highs and lows both fall | Comes on the falling candles | Fewer buyers are left to absorb selling, so price falls |
Look at the volume panel in the first chart: in the distribution range the bars are tall, yet price can't make progress. A lot of buying and selling with no result to show for it is the classic look of a range at the top.
Ranges that pause in the middle of a trend are called reaccumulation and redistribution; Part 2 looks at them. How to define a trend with highs and lows is covered in Basics Swings and Trend.
3. Why It Repeats: Someone Who Buys Low and Sells High
Wyckoff asked traders to imagine all the big players in the market as a single person. This imaginary figure is called the Composite Man. His goal is simple: accumulate cheaply and hand off at high prices.
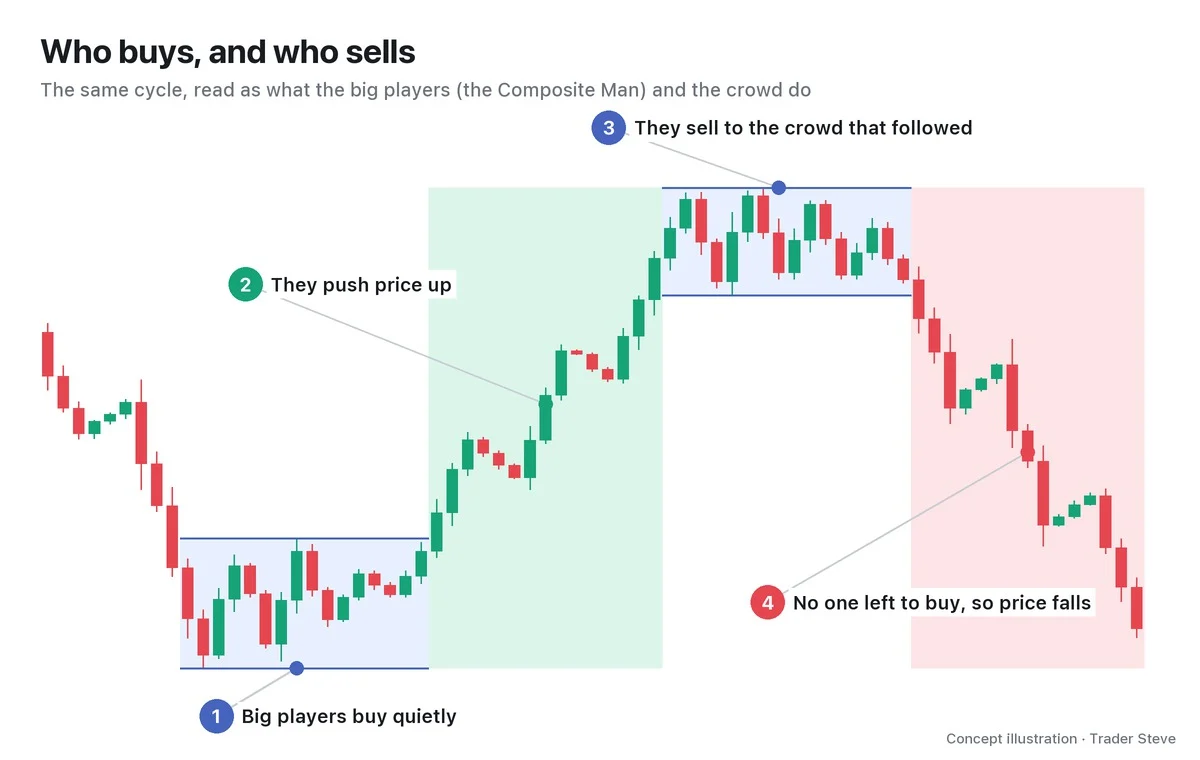
The problem is that his size is enormous. Buy all at once and his own orders send price jumping; sell all at once and there is no one to absorb it, so price collapses. So at the bottom and at the top alike, he buys and sells in pieces while price moves sideways for a long time. That time is the range. On a live stream, I sketched a hypothetical path over a Bitcoin chart and explained the whole process in one go.
"Around here, these guys started buying, so you got a bounce, and now everyone who was going to buy here has bought. The big players, that is. Then they pushed the price up. … If they approached it as 'buy here, sell here,' then up here they'd build a distribution structure like this and come back down. Why? They bought here and sold it all. They'd need to buy again, right? But would they buy again at this expensive price? No, they wouldn't." — Trader Steve, live stream, Sep 21, 2026 (translated from Korean) · ▶ Watch the stream highlights (Korean audio)
Someone who has sold everything has no reason to buy back at a high price, so a range at the top is followed by a phase of falling prices. And price has to fall far enough before there is a reason to accumulate again.
You can also tell the same story in terms of the money in the market as a whole.
"Once an asset's price rises past a certain level, the market's liquidity inevitably dries up. Then it can't be pushed any higher, and selling comes in to raise liquidity. And once selling goes past a certain level, the market is flush with liquidity again, so price uses that money to go back up. That's why every asset's chart moves in a cycle like this." — Trader Steve, live stream, Oct 20, 2026 (translated from Korean) · ▶ Watch the stream highlights (Korean audio)
Whether you frame it as the big players or as the market's money, the conclusion is the same: before direction changes, there has to be time for the position to change hands.
4. The Range Is the Cause, the Trend Is the Effect
One point matters here. You cannot tell an accumulation range from a distribution range by its shape alone. Both are just sideways action moving up and down within a fixed band.
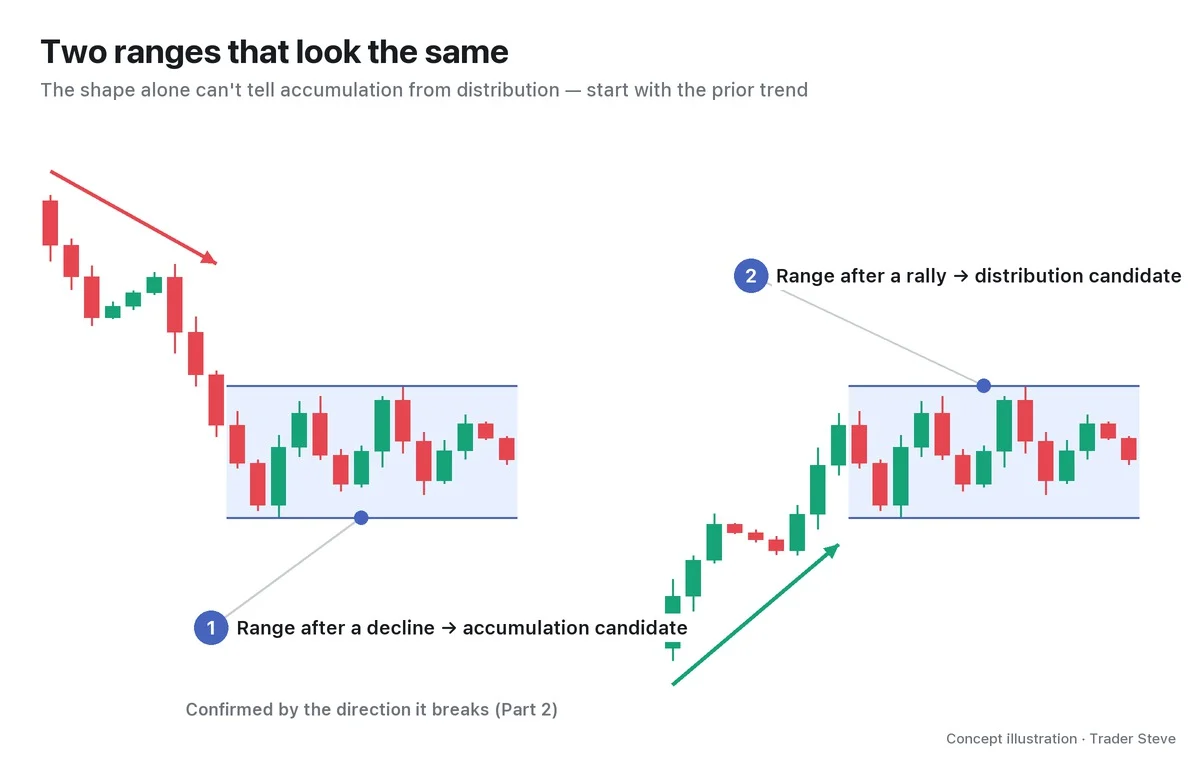
So you name a range not by the range itself but by what comes before and after it. A range after a long decline is an accumulation candidate; a range after a long rally is a distribution candidate. Whether the candidate was right is confirmed by which way price leaves the range. If a range after a decline breaks to the downside, it was not accumulation but a pause in the middle of the decline (redistribution). Part 2 turns the identification criteria into a checklist.
Wyckoff explains this relationship with the law of cause and effect. The time spent building a position inside the range is the cause, and the trend that follows is the effect. The longer and larger the range, the larger the next trend tends to be. But it is a "tendency," not an exact proportion. Cause and effect is covered in Wyckoff Three Laws, and measuring targets from a range in Wyckoff Point-and-Figure Count.
5. One Full Turn on the Real Bitcoin Weekly Chart
On the Bitcoin weekly chart from late 2021 to early 2026, you can see the four phases complete one full turn. The phase boundaries below are one interpretation, drawn by me from the range highs and lows and the first close outside each range.
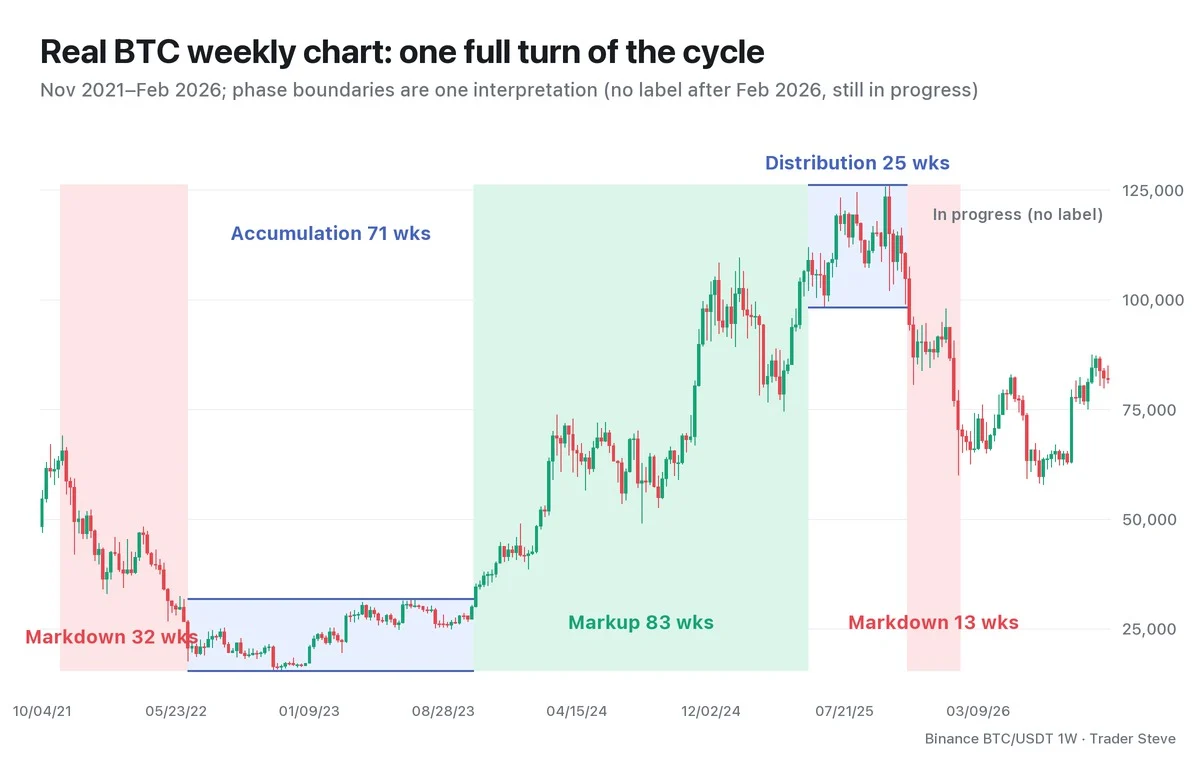
- Markdown, 32 weeks (week of Nov 8, 2021 to week of Jun 13, 2022): price fell from 69,000 to 17,622.
- Accumulation, 71 weeks (week of Jun 13, 2022 to week of Oct 16, 2023): the bottom of the range was 15,476 in the week of Nov 21, 2022, and the top was 31,804 in the week of Jul 10, 2023. Every weekly close in this period stayed inside the range.
- Markup, 83 weeks (week of Oct 23, 2023 to week of May 19, 2025): starting with the first week that closed above the top of the range, price made higher highs and higher lows up to 111,980. The ranges where it paused along the way (reaccumulation) are covered in Part 2.
- Distribution, 25 weeks (week of May 19, 2025 to week of Nov 3, 2025): the bottom of the range was 98,200 on Jun 22, 2025, and the top was 126,200 in the week of Oct 6, 2025. Price made one more higher high but could not carry on above the range.
- Markdown, 13 weeks (week of Nov 10, 2025 to week of Feb 2, 2026): after the Nov 14, 2025 daily candle closed below the bottom of the range at 94,594, price fell to 60,000 on Feb 6, 2026.
The weeks that printed a high or a low were counted in both adjacent phases. What stands out is that the lengths are not symmetrical. Accumulation lasted 71 weeks; distribution lasted 25. The order of the cycle repeats, but the length and shape of each phase do not.
And all of these labels were applied after the fact. Inside the range in the summer of 2025, there was no way to confirm whether it was distribution or reaccumulation until the bottom broke. Treat the current phase as a ranking of possibilities.
BTC Weekly 2025: Shared Reference Table
| Interpretation · period | Selling climax (SC) / buying climax (BC) · automatic rally (AR) | Bottom–top · updates | Downtrend confirmation |
|---|---|---|---|
| Large cycle range: weeks of 5/19–11/3 | The whole phase instead of individual BC/AR events | Extended to 6/22 98,200–week of 10/6 126,200 | Breakdown below the bottom in the week of 11/10 |
| The Composite Man's small top range: Jul–Oct | A supply zone instead of individual BC/AR events | Updated to 10/10 102,000–week of 10/6 126,200 | Read as turning lower from the week of 11/3 |
Because the period and the bottom differ, the week the decline starts also reads differently. These are alternative readings: the large cycle is the one used in this lesson, and the small top range is the one used in Wyckoff Composite Man Part 1.
BTC June 2025: Shared Range Cross-Check
| Period · timeframe · interpretation | SC/BC · AR | Bottom–top · updates | Confirmation |
|---|---|---|---|
| Jun–Jul reaccumulation after the May high; small range on the daily chart | Mid-uptrend range with no separate SC; a boundary high is used instead of an AR | 6/5 100,372–6/9 110,530 | 6/22 98,200 spring candidate, then a 7/9 close above the top |
| Large cycle range, weeks of 5/19–11/3 | The whole phase, not individual SC/AR events | Extended to 6/22 98,200–week of 10/6 126,200 | Decline confirmed in the week of 11/10 |
The same 6/22 low is a reaccumulation spring in the small range and the bottom of the distribution range in the large one (Wyckoff Spring Part 1, Wyckoff Reaccumulation Part 1). The SC → AR → secondary test (ST) accumulation sequence that ends a downtrend is not applied as a requirement for this small range.
Key Takeaways
- The Wyckoff four-phase cycle is the repetition of accumulation → markup → distribution → markdown. Two sideways ranges alternate with two trends.
- Big players can't buy or sell all at once, so they exchange size at the bottom and the top while price moves sideways for a long time.
- Accumulation and distribution ranges look the same. Name them by the prior trend and the direction price leaves the range.
- The longer the range (cause), the larger the next trend (effect) tends to be, but the phases are not symmetrical in length.
- Phase names are usually confirmed after the fact. Treat the current phase as a ranking of possibilities.
In Part 2, we'll cover four questions and a checklist for identifying which phase the chart in front of you is in, and how to draw the phases.
This lesson adapts the text, figures and live-stream quotes of the Trader Steve TA series for the web, translated from the original Korean. Check the text and figure captions for the timing and interpretation of each real example, and read conceptual diagrams and real charts separately.
Corrections: support@omnisight.report