
What Is a P&F Count? Measuring Targets with Wyckoff Cause and Effect
Historical examples for learning · not current prices or trade recommendations.
Contents
When a range drags on, you often hear, "It's been building for so long, it'll move big when it breaks." Wyckoff left a way to turn that vague feeling into a number: the P&F count, which measures the horizontal width of a range on a point-and-figure (P&F) chart. This lesson uses charts to show how Wyckoff measured the size of a range (the cause) to estimate the size of the trend that follows (the effect).
All dates and times are Korea Standard Time (KST, UTC+9). A daily candle is dated by its 09:00 KST open; intraday extremes are identified by their KST date and time.
1. The P&F Chart: Erase Time, Keep Only Box-Sized Moves
On the candlestick chart you look at every day, the horizontal axis is time. Each day adds a candle, even if price barely moves. A P&F chart does the opposite: it erases time and records price only when it moves by a set amount.
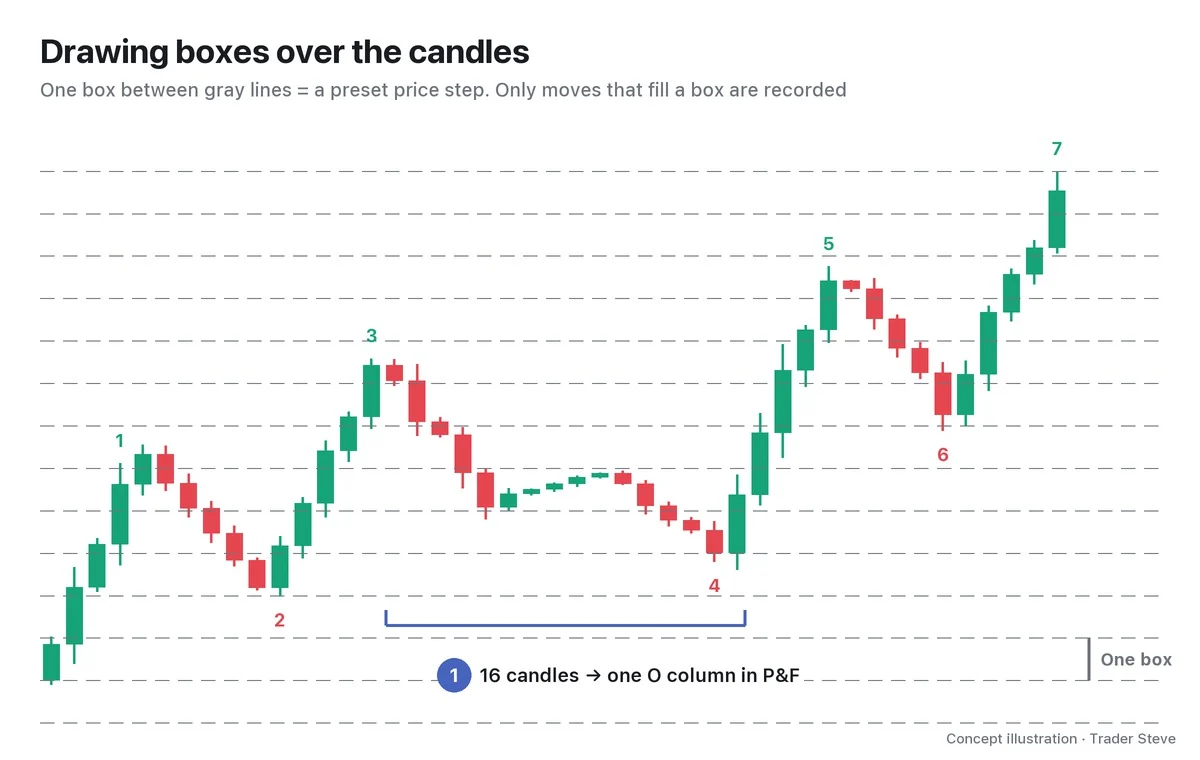
You need three terms.
- Box size: the price step of one box. The Bitcoin (BTC) charts in this series use a box of $2,000.
- X column and O column: each time price rises one box, you stack an X; each time it falls one box, you stack an O. One column is one move in one direction.
- 3-box reversal: price has to move 3 boxes or more the other way before you open a new column to the side. Wiggles of 1–2 boxes are not recorded.
This series fills boxes using the daily candle's high and low, the high-low method.
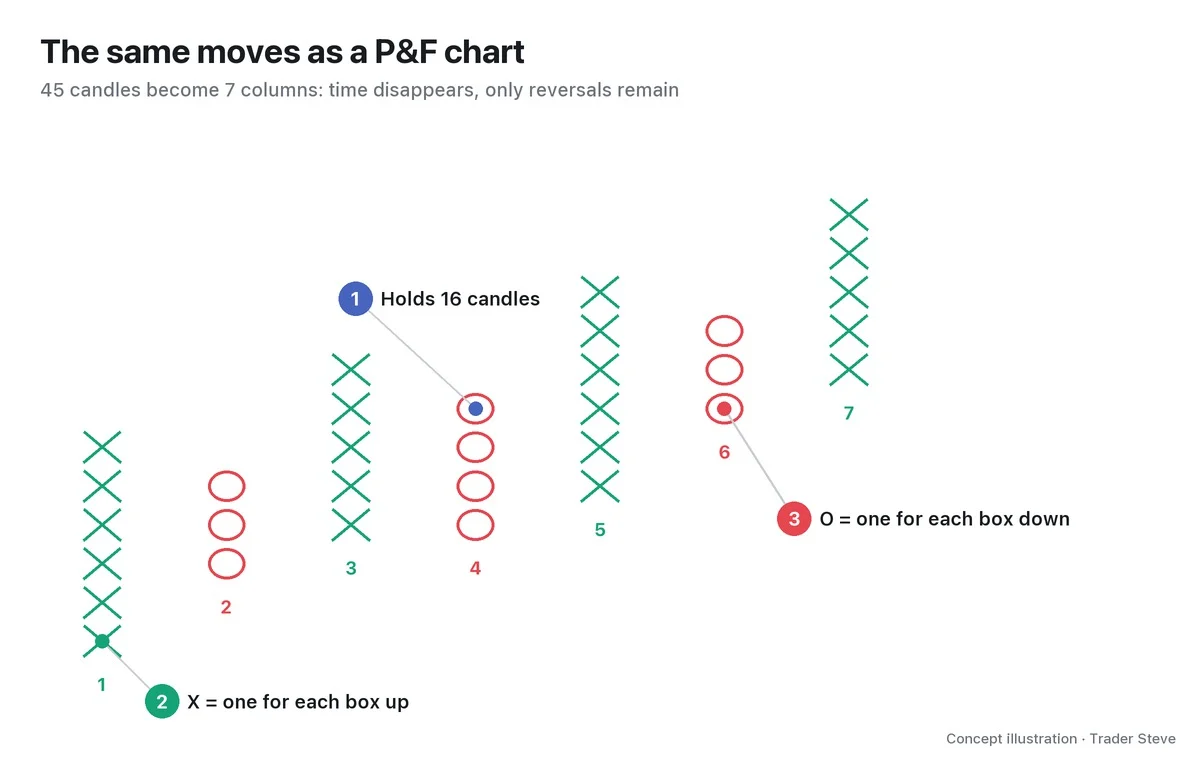
Put the two images side by side and the nature of P&F becomes clear. A tedious range and decline that spans 16 candles folds into one O column. Time disappears, and only how many times the direction changed remains. That "number of reversals" becomes the ruler used later to measure the size of the cause.
2. Why Wyckoff Measured the Cause with P&F
At the core of Wyckoff theory is the law of cause and effect. A trading range (TR) such as accumulation or distribution, in other words a sideways stretch, is the cause; the trend that follows is the effect. The law itself is covered in Wyckoff Three Laws.
But how do you measure the "size" of a cause? Wyckoff's answer was the horizontal width of the range. While big players accumulate or hand off size, price swings up and down and changes direction many times. The longer and fiercer that tug-of-war, the longer the cluster of columns it leaves on a P&F chart. On a candlestick chart, horizontal length is simply the number of days that passed. On a P&F chart, it is the number of reversals that actually happened, which is why Wyckoff saw it as the better ruler for the size of a cause.
3. The Horizontal Count in One Line
The horizontal count turns this principle into a number. It is what people usually mean by the Wyckoff P&F count.
Expected move = number of columns in the range × box size × reversal amount (3)
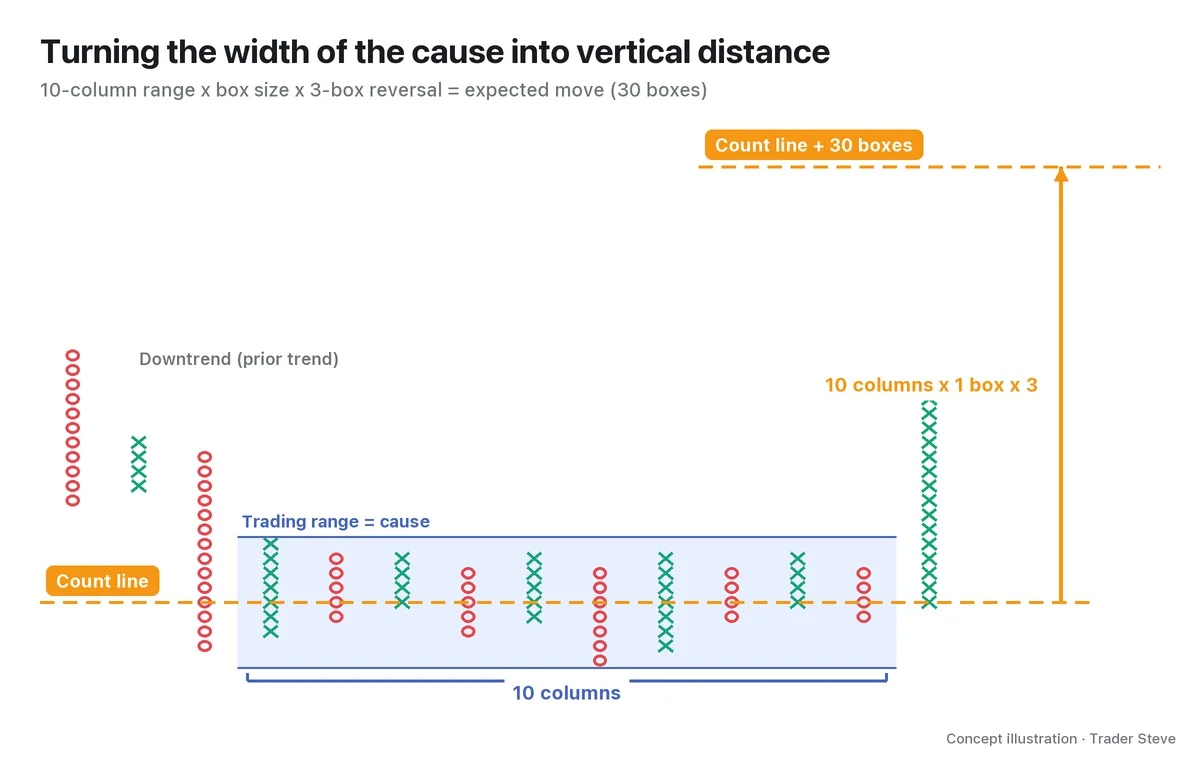
The steps in the image:
- Define the range (blue) and count the columns inside it. Here there are 10.
- Pick the count line, the horizontal row inside the range along which you count columns (dashed orange line).
- Calculate 10 columns × box size × 3 and project that distance upward.
You multiply the column count by 3 because on a 3-box reversal chart, each column represents a move of at least 3 boxes. In practice you use two reference points and calculate both a conservative target (the lowest box of the range + the count) and an aggressive target (the count line + the count). Where to set the left and right ends of the range and how to choose the count line are laid out step by step in Part 2.
4. A Small Cause Means a Small Effect
Read the formula backward and you get a statement that is even more useful in practice: after a short, shallow range, don't expect a big trend.
I don't use the term P&F, but I expressed the same idea on a live stream while talking about Korean semiconductor stocks.
"For it to rise only this far and then come back down — I don't think enough size has built up yet." — Trader Steve, live stream, Aug 25, 2026 (translated from Korean) · ▶ Watch the stream highlights (Korean audio)
The judgment is that if little size has built up (the cause), a large move (the effect) is hard to get. The P&F count is a tool for checking "has enough built up?" with a column count instead of by eye.
This is a tendency, though, not a calculation that works like a law of physics. Change the box size and the column count changes; the number also moves a lot depending on which column you start counting from. A count is a ruler for gauging the range of "how far it could go," not a promise that price will get there.
5. Real BTC: Seven Months of Cause, and the Effect That Followed
Let's check the shape on a past Bitcoin chart.
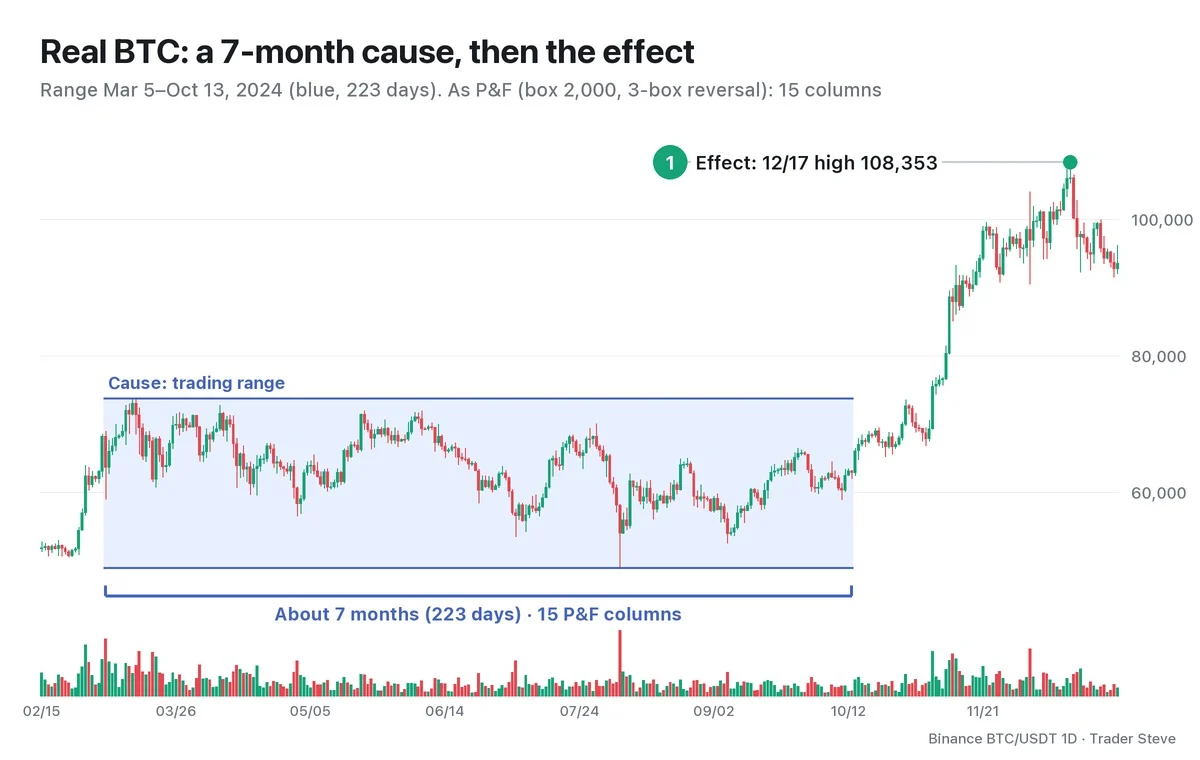
In 2024, Bitcoin was stuck in a wide range for 223 days, about seven months, from the Mar 5 daily candle to the Oct 13 daily candle. The high in that period was 73,777 on Mar 14 and the low was 49,000 on Aug 5, a range height of 24,777. Convert the same stretch to a P&F chart with a 2,000 box and 3-box reversal and you get 15 columns. The tug-of-war of reversing up and down left its trace as fifteen columns.
After the range ended, the rally that started from the Oct 14 daily open of 62,870 ran to a high of 108,353 on Dec 17. That is a 72.3% gain in about two months, the effect. A cause that built up horizontally over a long stretch was followed by a large vertical effect. How to split up and count these 15 columns, and where the numbers actually landed, is tested in Part 4. This is a reading of a past chart; the same shape does not guarantee the same result.
This is a different calculation from a range height projection. In Wyckoff Reaccumulation, I took the same 2024 range's height of 24,777 and stacked it once more on top of the 73,777 high to estimate 98,554. That is a simple range height projection: it carries over the range's vertical height as it is.
The P&F count converts the range's horizontal width, meaning how many times price reversed during the tug-of-war, into vertical distance. The two numbers start from different places and come out differently. You use them together: when both calculations point to a similar price area, you give that area more weight (Part 5).
The ranges where the cause builds up are covered in detail in Wyckoff Accumulation Phases and Wyckoff Distribution Phases.
Key Takeaways
- A P&F chart erases time and records an X (up) or O (down) only when price moves by the box size. A new column opens only after price moves 3 boxes or more the other way.
- Wyckoff measured the size of a range (the cause) by its horizontal width on a P&F chart (the number of columns).
- Horizontal count = columns × box size × 3, projected from a reference point upward (or downward).
- A small cause tends to produce a small effect, but that is only a tendency; a count is not a confirmed price target.
- A simple projection that carries over the range height and a P&F count that measures the horizontal width are different calculations.
In Part 2, we'll cover the rules for drawing a P&F chart yourself and the step-by-step order for counting columns.
Doing this calculation by hand for every market takes a lot of time. The Omnisight Report lays it out for each market.
This lesson adapts the text, figures and live-stream quotes of the Trader Steve TA series for the web, translated from the original Korean. Check the text and figure captions for the timing and interpretation of each real example, and read conceptual diagrams and real charts separately.
Corrections: support@omnisight.report


