
What Is Preliminary Support (PS) in Wyckoff? Meaning and How It Forms
Historical examples for learning · not current prices or trade recommendations.
Contents
After a long slide, one day volume suddenly surges and a candle prints with a long lower wick. The first thought is usually "Is this the bottom?" Wyckoff theory calls this spot preliminary support (PS), and reads it not as the bottom but as the first warning that the decline is nearing its end. This lesson uses diagrams and a real Bitcoin (BTC) weekly chart to show what PS is, why the first brake appears near the end of a decline, and why that spot is often not the bottom.
All dates and times are Korea Standard Time (KST, UTC+9). A daily candle is dated by its 09:00 KST open; intraday extremes are identified by their KST date and time.
1. The One-Line Definition: The First "Meaningful Buying" After a Long Decline
PS is the spot near the end of a long decline (markdown) where meaningful buying comes in for the first time and puts a brake on the fall.
Two words matter here.
- First: small bounces keep appearing even during a decline. PS is the first spot where volume and candle shape say "this time is different."
- Brake: it means slowing down, not stopping. The decline loses speed or bounces briefly, but there is no confirmation yet that it is over.
For reference, the mirror image — the spot near the end of a rally where heavy selling comes in for the first time and puts a brake on the advance — is preliminary supply (PSY). Only the direction is reversed; you read it the same way. PSY is covered in its own topic.
2. Its Place in Accumulation Phase A: PS → SC → AR → ST
Wyckoff calls the process of halting a decline and building a base accumulation, and its first stage Phase A (the stage that stops the decline). PS is the opening scene of Phase A.
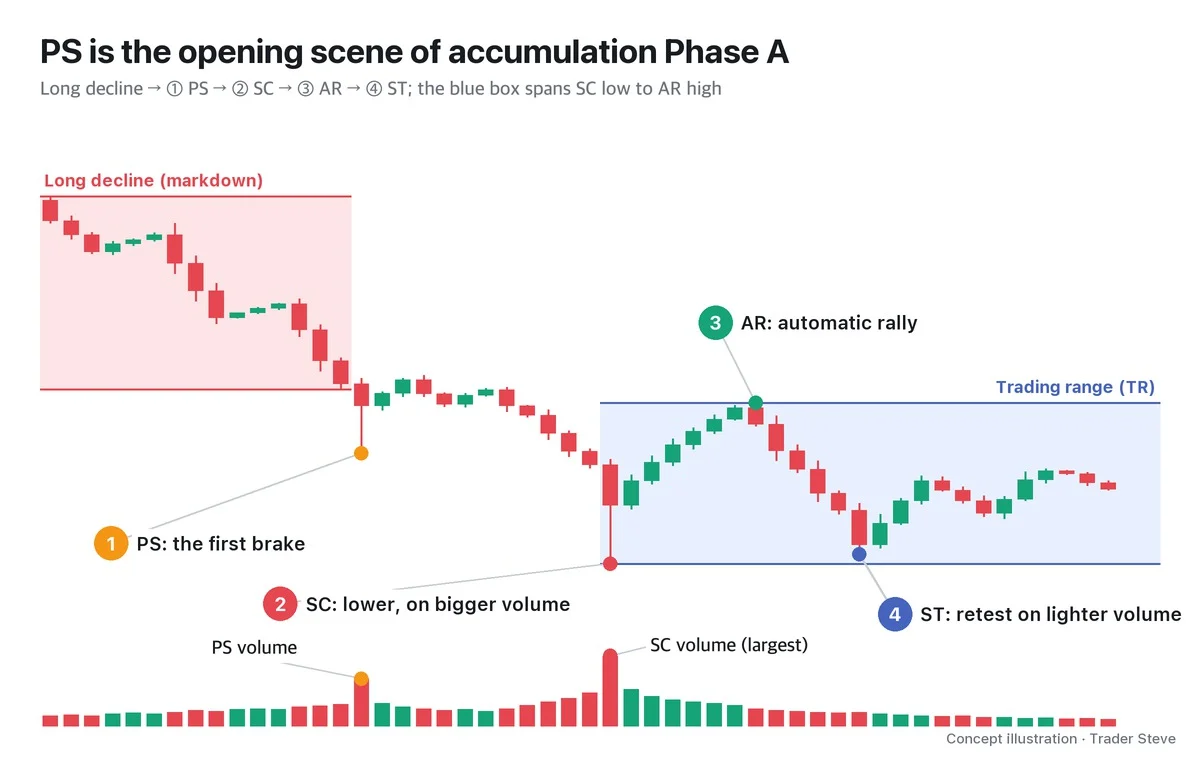
- ① PS (preliminary support): the first brake. Volume rises and the decline slows for a while.
- ② SC (selling climax): the remaining selling pours out all at once in panic. It usually comes at a lower price and on bigger volume than PS.
- ③ AR (automatic rally): the bounce that follows once the panic selling ends and selling dries up.
- ④ ST (secondary test): price revisits the SC area on reduced volume.
The SC low and the AR high later become the frame of the trading range (TR). The SC, AR and ST each have their own topics; for this lesson it is enough to remember their roles. PS is "warning and preparation"; the SC is "panic selling and absorption."
3. Why It Forms: Buying Catches Up With Selling for the First Time
In the end, price moves on supply and demand. A continuing decline means more size is being sold than bought, and that keeps happening.
"Even when the macro picture is bad, price goes up if a lot of people buy. Bad news breaks, people see it as a chance to buy the dip and pile in, and price goes up. Price goes down because there's more selling than buying." — Trader Steve, live stream, Oct 21, 2026 (translated from Korean) · ▶ Watch this moment (Short, Korean audio)
PS is where that balance tips for the first time. The moment the market feels price has fallen far enough, three kinds of buying rush in at once.
- Short covering: traders who bet on the decline buy back to lock in profits.
- Dip buying: fresh buying from people who decide "this is cheap enough."
- The big players' first absorption: large capital starts soaking up the selling that is pouring out.
Because this buying collides head-on with the selling, volume surges, the candle's range widens, and price that stabbed lower gets dragged back up, leaving a lower wick.
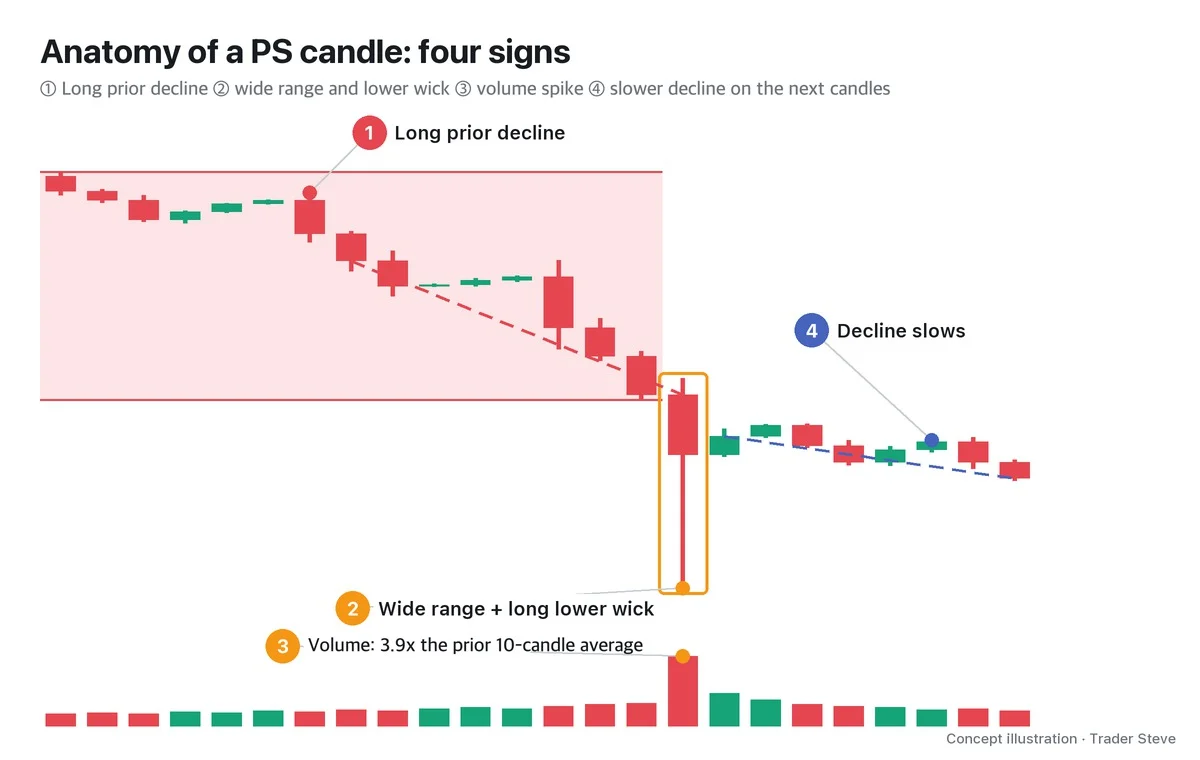
It is rare for all four to show up textbook-perfect. Even so, whether the prior decline was long and whether volume was clearly above normal are conditions that almost never go missing. Part 2 sets out numeric criteria for picking candidates.
4. Why It Isn't the Bottom: Buyers at PS Become Overhead Supply
If buying came in at PS, it would be nice if price rallied right from there. In practice, price often makes one more push lower. The reason is the size bought at PS itself.
"With just two bounces like this, it's likely that you guys who got in here are averaging down and sitting on big positions. Put yourselves in the big players' shoes. If I'm going to push price up from here, it only rises easily if nobody above is dumping on me. But the more people who are hanging on here (trapped at this price and holding on), the more they'll keep taking partial profits every time price goes up. … Then on the way up, you have to keep lifting the rocks you carried from below over your head and drag them up with you." — Trader Steve, live stream, Aug 31, 2026 (translated from Korean) · ▶ Watch the stream highlights (Korean audio)
Most of the buying at PS comes from the hope that "this must be the bottom." As long as that size is still around, it becomes overhead supply that gets sold at breakeven or a small profit every time price rises. For whoever intends to lift the market, it is easier to push price down once more and shake that size out than to carry it all the way up.
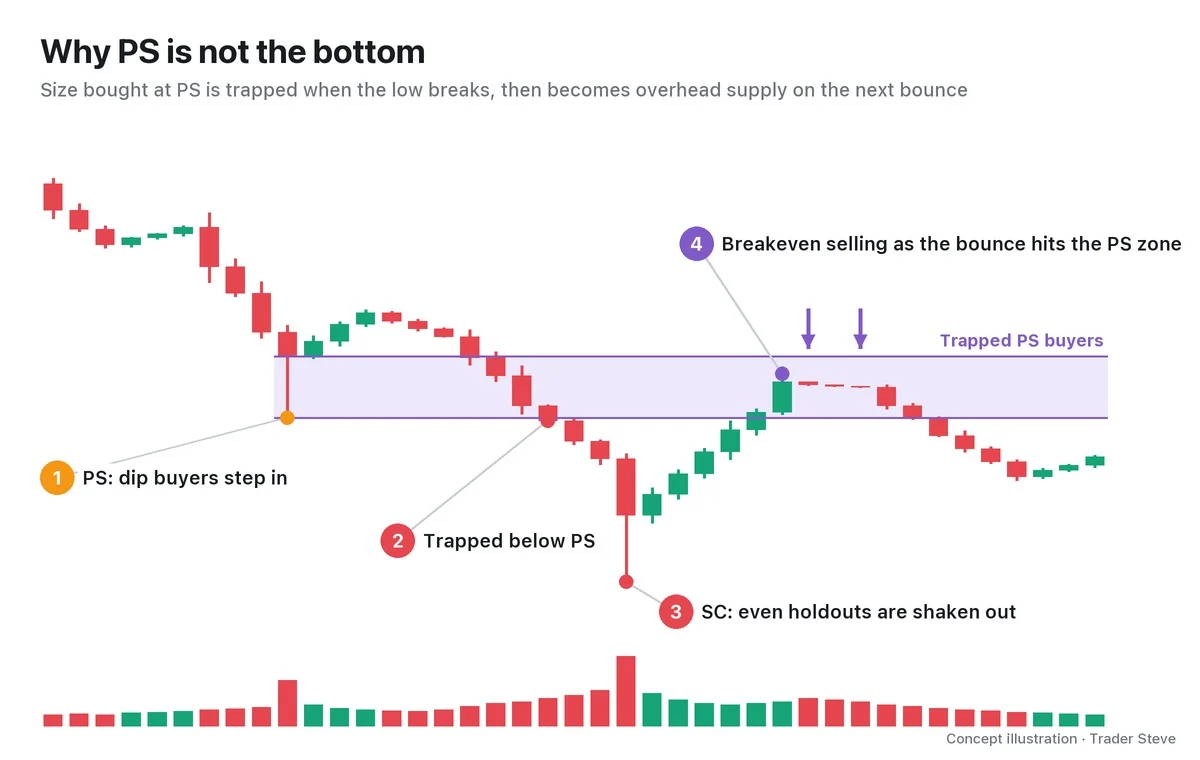
So the job after you spot a PS is not to buy but to take notes. Write down the PS low and its volume, and you have a baseline for judging whether later panic selling comes at a lower price and on bigger volume than PS — that is, whether it is an SC candidate. Part 3 covers what to prepare once you see a PS.
5. A Real BTC Weekly Chart: The Nov 2025 PS and the Feb 2026 Capitulation
Let's check this on a real Bitcoin weekly chart. The PS and SC labels below are an interpretation — a reading of a past chart in Wyckoff's sequence.
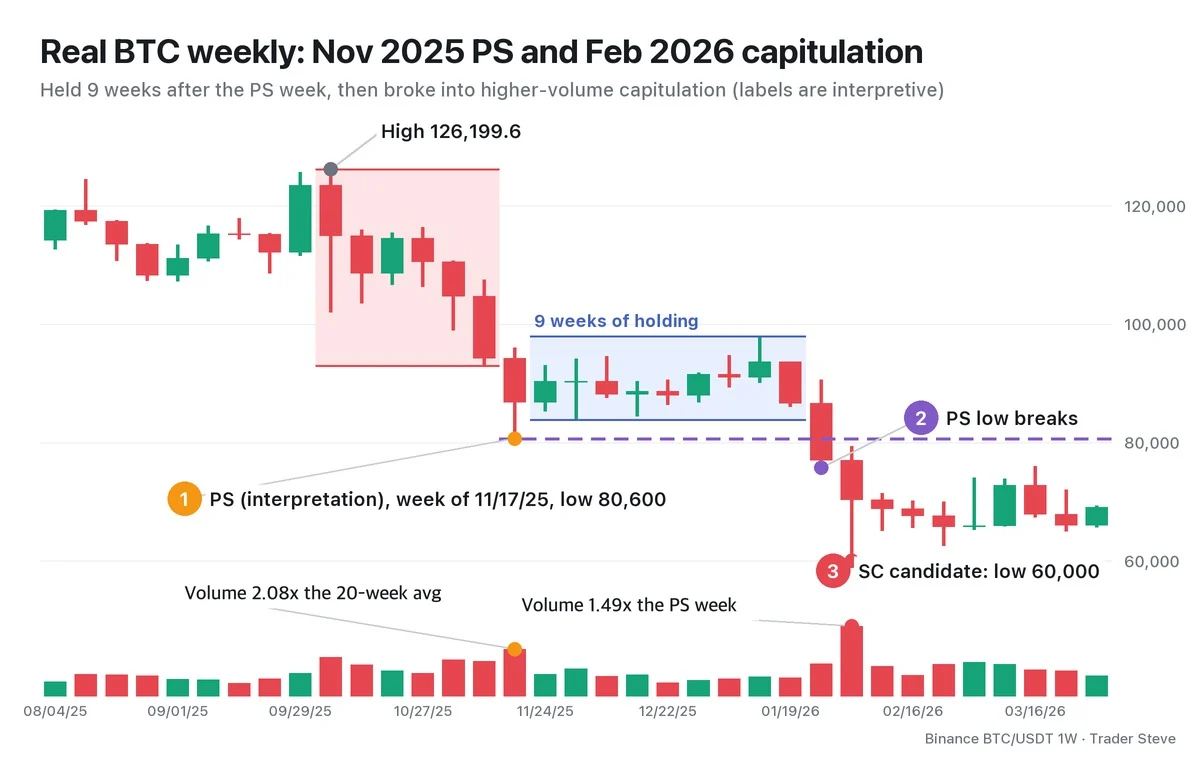
- Prior decline: the decline that started from the 126,199.6 high in the week of Oct 6, 2025 ran for 6 weeks.
- ① The week that can be read as PS (week of Nov 17, 2025): price dropped to a low of 80,600 and closed at 86,830. That was -36.1% from the high, and volume was 2.08x the average of the previous 20 weeks, the largest since the high.
- 9 weeks of holding: for the next 9 weeks (week of Nov 24 to week of Jan 19, 2026), price moved between 83,822.8 and 97,924.5 and held the PS low. Up to this point, it is easy to feel that "the bottom is in."
- ② PS low breaks (week of Jan 26, 2026): a low of 75,700 broke the PS low for the first time.
- ③ SC candidate (week of Feb 2, 2026): a low of 60,000, -25.6% from the PS low. Volume was 1.49x the PS week, the largest in the period shown. A lower price on bigger volume — the SC shape from Section 2.
Through the end of March, the highest weekly high was only 76,000, so price never once got back to the PS low (80,600). As in the diagram in Section 4, the PS price zone has become overhead supply. Even a PS that held for 9 weeks was not the bottom; only after higher-volume capitulation could the next stage be assessed.
For the same 2026 BTC, the larger range is read from the 2/6 SC and the smaller range from the 6/5 SC. For the periods, boundaries, update rules and confirmation conditions, see the shared range reference table in Wyckoff Accumulation Phases Part 4.
Key Takeaways
- PS (preliminary support) is the spot near the end of a long decline where meaningful buying comes in for the first time and puts on the brakes.
- The order of accumulation Phase A is PS → SC → AR → ST, and PS is the opening scene.
- Its signs are a long prior decline, a wide range and a lower wick, a volume spike, and a slower decline afterward.
- Size bought at PS easily turns into overhead supply, so an SC at a lower price on bigger volume often follows.
- PS is not a bottom signal; it is a warning and a baseline to record. On a real chart, the labels are confirmed only after the SC and AR appear.
In Part 2, we'll cover five numeric conditions for picking PS candidates on a chart, and how to tell PS from the SC by volume.
Comparing volume by hand every time to decide which candle in a decline is a PS candidate takes time. A comprehensive analysis for each market, including its Wyckoff phase, is available in the Omnisight Report below.
This lesson adapts the text, figures and live-stream quotes of the Trader Steve TA series for the web, translated from the original Korean. Check the text and figure captions for the timing and interpretation of each real example, and read conceptual diagrams and real charts separately.
Corrections: support@omnisight.report


