
What Is Preliminary Supply (PSY) in Wyckoff? Meaning and Why It Forms
Historical examples for learning · not current prices or trade recommendations.
Contents
When a long-running rally suddenly prints a candle with a volume spike and a long upper wick, it is tempting to ask, "Is this the top?" Wyckoff theory calls this spot preliminary supply (PSY) and reads it not as the top but as the first warning that the rally is nearing its end. This lesson uses diagrams and a real Bitcoin (BTC) daily chart to show what a PSY is, why it forms, and why it often isn't the top.
All dates and times are Korea Standard Time (KST, UTC+9). A daily candle is dated by its 09:00 KST open; intraday extremes are identified by their KST date and time.
1. The One-Line Definition: The First Meaningful Selling After a Long Rally
A PSY is the spot near the end of a long rally (markup) where meaningful selling (supply) comes in for the first time and puts the brakes on the advance.
Two words matter here.
- First: small pullbacks happen all the time in a rally. The PSY is the first spot where volume and candle shape say, "This time the sellers are serious."
- Brake: it is a slowdown, not a stop. The rally loses speed or dips briefly; there is no confirmation yet that the rally is over.
2. Where It Sits in Distribution Phase A: PSY → BC → AR → ST
Wyckoff calls the process of halting a rally and handing off supply near the top distribution, and its first stage Phase A (the stage that stops the rally). The PSY is the opening scene of Phase A (for the full overview, see Wyckoff Distribution Phases, wyckoff/distribution-phases).
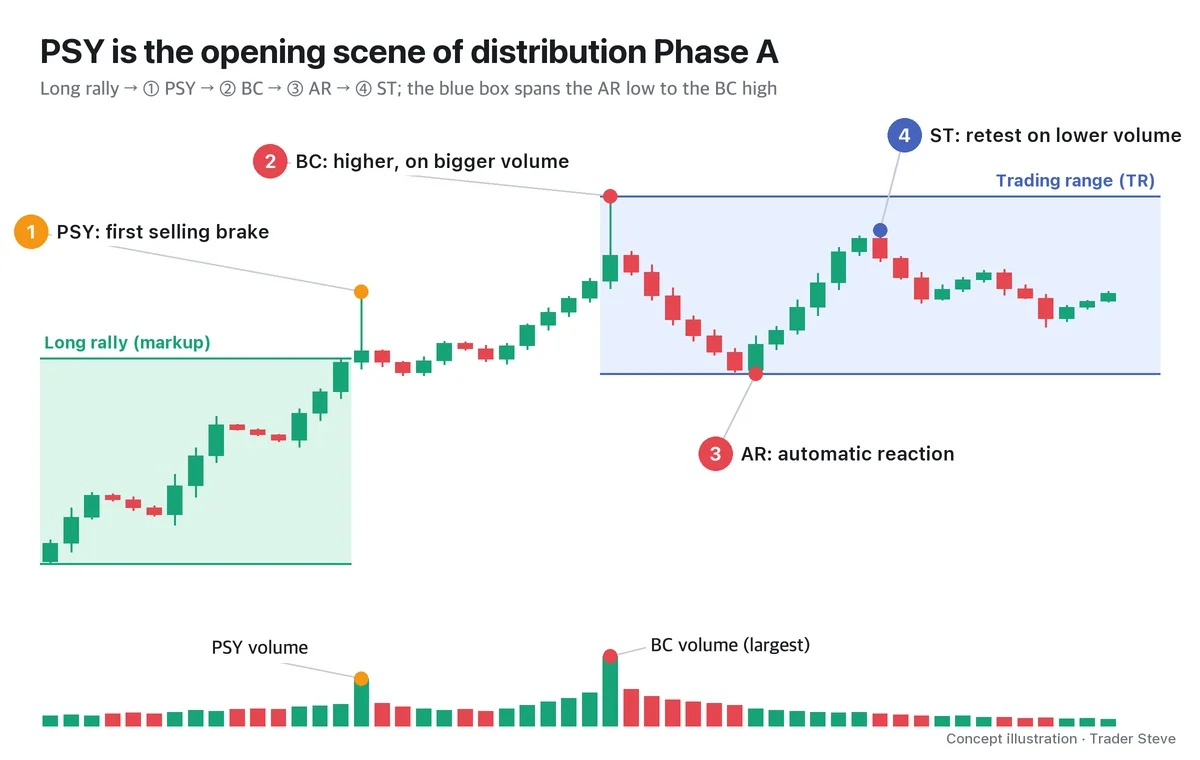
- ① PSY (preliminary supply): the first brake. Volume rises and the rally slows for a while.
- ② BC (buying climax): the peak of chase buying. It usually prints higher than the PSY (see Wyckoff Buying Climax, wyckoff/bc).
- ③ AR (automatic reaction): the sharp drop that comes as buying dries up (see Wyckoff Automatic Rally, wyckoff/ar).
- ④ ST (secondary test): a retest near the BC on lower volume (see Wyckoff Secondary Test, wyckoff/st).
The BC high and the AR low go on to frame the trading range (TR). By role, the PSY is "warning and setup," and the BC is "climax and handoff."
3. Why It Forms: Early Buyers Take Profits and Big Players Start Distributing
A rally means buyers keep outnumbering sellers (see Wyckoff Three Laws, wyckoff/laws), and the PSY is where that balance tips the other way for the first time. I described this moment while explaining the Relative Strength Index (RSI):
"If RSI is falling, it means that on the way up everybody was buying together, but as price keeps grinding higher, people are slowly starting to sell. It's saying the number of sellers is growing, so the ratio of buyers to sellers is coming down toward the middle." — Trader Steve, live stream, Aug 28, 2026 (translated from Korean) · ▶ Watch the stream highlights (Korean audio)
At the moment the market feels it has rallied enough, two kinds of supply show up on the sell side together for the first time.
- Early buyers taking profits: people who bought lower start "slowly" selling to lock in gains.
- Big players' first distribution: large money starts handing off size, a little at a time, at high prices (see Wyckoff Composite Man, wyckoff/composite-man).
Because this selling still runs into strong buying, volume spikes, the candle's range widens, and price that poked higher gets pushed back down, leaving an upper wick and a low close.
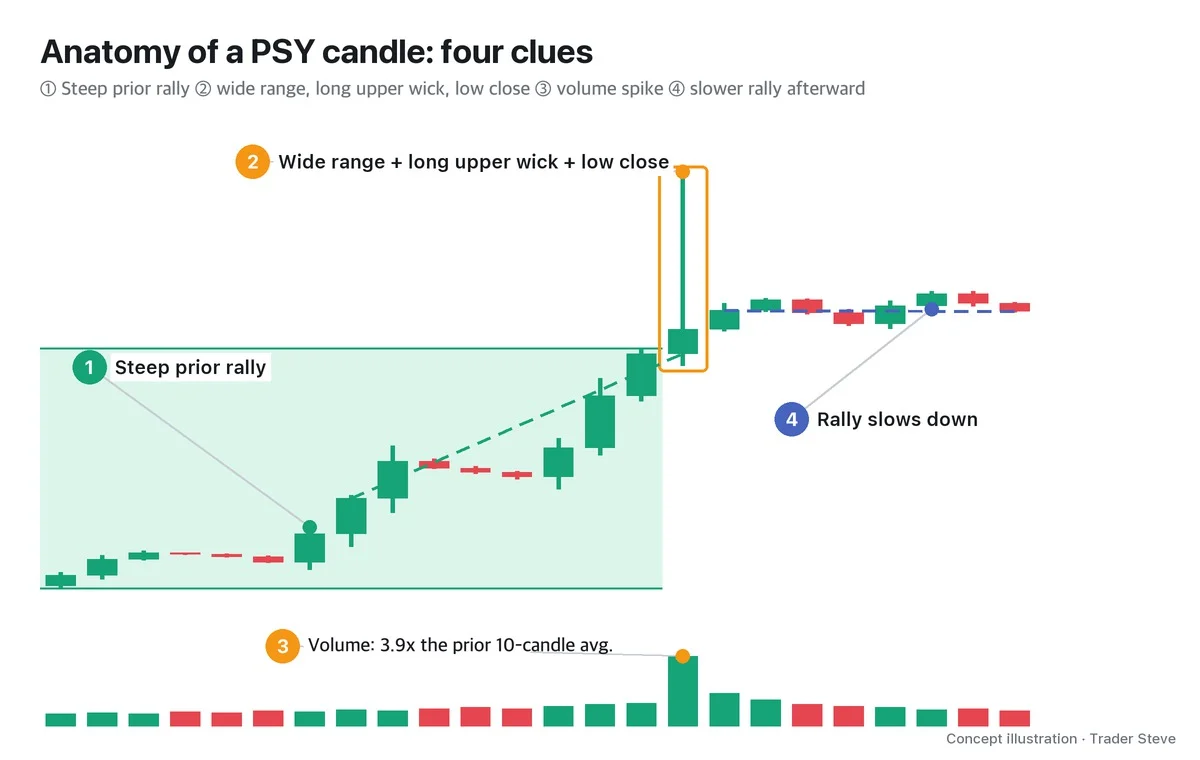
All four rarely show up at once, but a sufficient prior rally and a clear rise in volume are almost always there (see Basics Volume, basics/volume-basics). Part 2 sets out the numeric criteria.
4. Why It Isn't the Top: Remaining Demand Gets Absorbed Once More at the BC
For big players to hand off their size, there has to be buying to take it. Dumping it all at once would crash the price, and they couldn't sell high.
"Because the big players need to dump more size on more small traders and get out safely, you can get a structure where they hand off all their size at a spot like this, where price has risen more than expected, and then the market goes down." — Trader Steve, live stream, Aug 22, 2026 (translated from Korean) · ▶ Watch the stream highlights (Korean audio)
I was talking about the Korean stock market, but it is the principle of distribution exactly. Distribution happens slowly at high prices, and the PSY is only its first trace. At the time of the PSY, two kinds of buying are still around.
- Remaining demand: people who trust the uptrend and buy every pullback
- Late chasing buyers: people who see price rising and jump in late
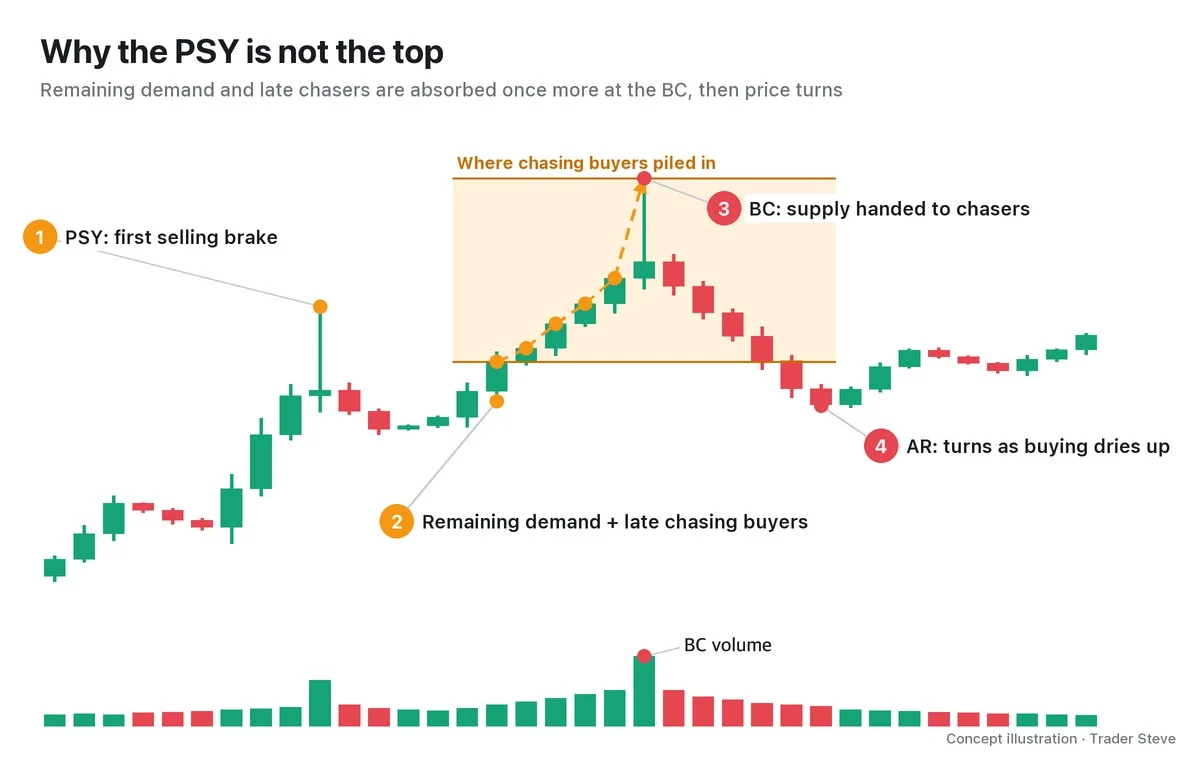
That's why a higher BC often follows the PSY, and calling the PSY the top makes it easy to get caught in that final leg up. What to do after spotting a PSY is record it. Writing down the PSY's high, low and volume gives you a baseline for judging whether a later surge is a BC candidate (how to respond is covered in Part 3).
5. Real BTC Daily Chart: July 2025, the Pace of the Rally After the PSY
Here is a real Bitcoin daily chart. The PSY label below is an interpretation: a past chart read in Wyckoff sequence.
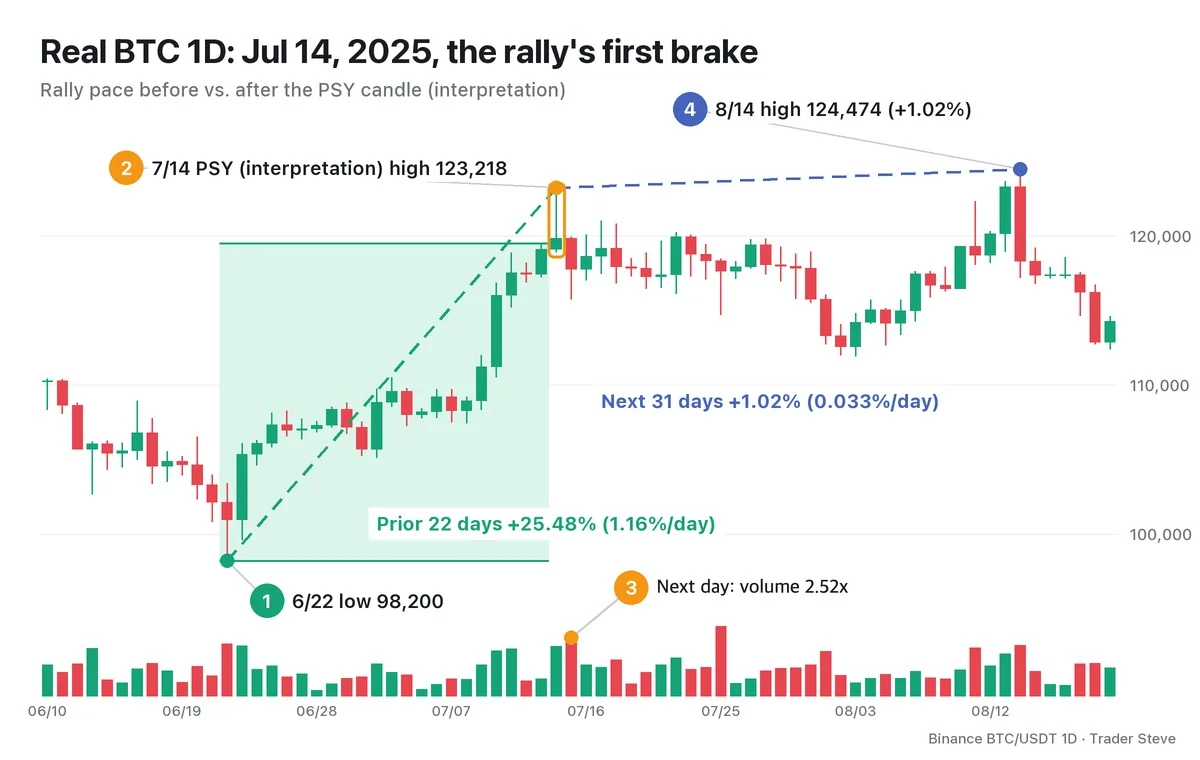
- ① Prior rally: from the Jun 22 low of 98,200 to the Jul 14 high of 123,218, +25.48% over 22 days, an average of 1.16% per day.
- ② The candle that can be read as the PSY (Jul 14): it spiked to a high of 123,218 and closed at 119,841.2. Its close location was 0.22 (22% of the way up from the candle's low), volume was 2.25x the prior 20-day average, and RSI(14) was 76.0.
- ③ The next day (Jul 15): volume grew further to 2.52x, and price was pushed down to a low of 115,736.9.
- ④ The 31 days that followed: the highest price in that period was 124,474 on Aug 14, only 1.02% above the PSY high, an average of 0.033% per day. Along the way, the Aug 1 close of 113,297.9 broke the Jul 15 low, and price fell to an Aug 3 low of 111,920 (-9.17% from the PSY high).
Jul 14 was not the top, but the pace of the rally broke sharply from that day on. That is exactly the "brake" a PSY describes. The general criteria for telling a BC candidate like this apart are covered in Wyckoff Buying Climax (related lesson).
6. The Mirror Image of PS
The PSY is the mirror image of preliminary support (PS) on the accumulation side (see Wyckoff Preliminary Support, wyckoff/ps).
| Aspect | PS (preliminary support) | PSY (preliminary supply) |
|---|---|---|
| Where it appears | End of a long decline | End of a long rally |
| What comes in first | Meaningful buying | Meaningful selling |
| Candle clue | Lower wick, close near the top of the candle | Upper wick, close near the bottom of the candle |
| Next event | Selling climax (SC), usually lower | Buying climax (BC), usually higher |
| Stage | Accumulation Phase A | Distribution Phase A |
| Meaning | First warning that the decline is nearing its end | First warning that the rally is nearing its end |
The 7/14 PSY and 8/14 BC candidate in this lesson are an alternative interpretation of how the top formed. Wyckoff Distribution Phases Part 4, Wyckoff Upthrust Part 1 and Wyckoff UTAD Part 4 read the same daily chart as a 7/14 BC and an 8/14 upthrust (UT). The 7/14 relative volume (RVOL) of 2.25x falls short of the 2.5x mechanical daily filter in Wyckoff Buying Climax Part 2. For each interpretation's period, range top and bottom, and confirmation conditions, see the Wyckoff Distribution Phases Part 4 shared reference table.
Key Takeaways
- A PSY (preliminary supply) is the spot near the end of a long rally where meaningful selling comes in for the first time and puts on the brakes.
- The sequence in distribution Phase A is PSY → BC → AR → ST, and the PSY is its opening scene.
- Its clues are a steep prior rally, a wide range with an upper wick and a low close, a volume spike, and a slower rally afterward.
- Because demand and chasing buyers remain, a higher BC often follows.
- A PSY is not a top signal but a warning and a baseline to record. On a real chart, the label is confirmed only after the BC and AR have printed.
In Part 2, we'll cover five numeric conditions for picking PSY candidates on a chart, and how to tell a demand candle, a PSY and a UT apart.
Comparing candles by hand every time to find a PSY candidate takes time. For a combined analysis of each market, including its Wyckoff phase, see the Omnisight Report below.
This lesson adapts the text, figures and live-stream quotes of the Trader Steve TA series for the web, translated from the original Korean. Check the text and figure captions for the timing and interpretation of each real example, and read conceptual diagrams and real charts separately.
Corrections: support@omnisight.report


