
What Is Reaccumulation in Wyckoff? Why an Uptrend Pauses in a Range
Historical examples for learning · not current prices or trade recommendations.
Contents
When a chart that was rallying nicely suddenly starts crawling sideways, it's easy to get anxious and wonder, "Is this the top?" Yet it's not unusual for price to break out of that range a few weeks later and climb again. Wyckoff calls a range like this, formed partway through an uptrend, reaccumulation. This lesson uses diagrams and a real Ethereum (ETH) chart to explain what reaccumulation is, how it differs from the accumulation that forms at a bottom, and why it happens.
All dates and times are Korea Standard Time (KST, UTC+9). A daily candle is dated by its 09:00 KST open; intraday extremes are identified by their KST date and time.
1. The One-Line Definition: A Sideways Range Mid-Uptrend, a Landing on the Staircase
Reaccumulation is a long sideways range that forms in the middle of an uptrend. It's where the market digests the prior rally and builds up the size (the cause) needed for the next one.
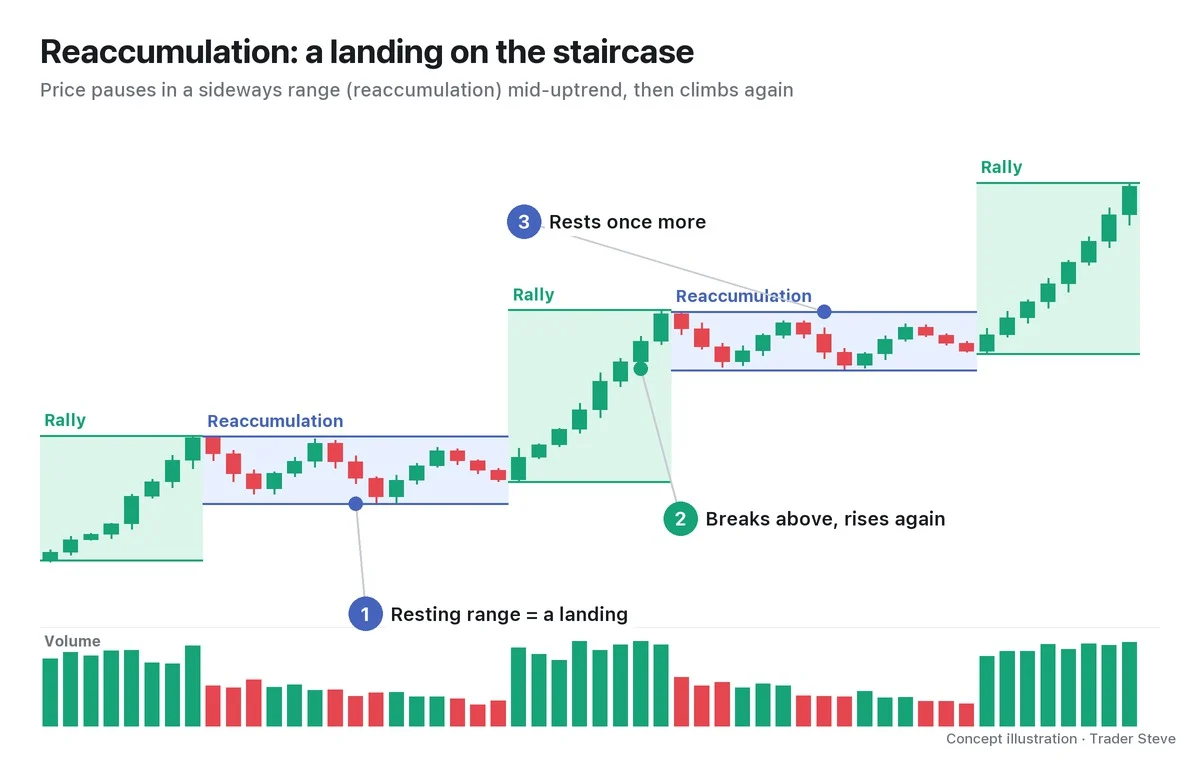
A staircase makes this easy to picture. No staircase climbs forever without a break; there are flat landings along the way. Reaccumulation is that landing. As in the diagram, when the pattern repeats — ① price rests in a range, ② breaks above it and climbs again, ③ rests once more — the chart rises like a staircase.
The key point is that a range appearing does not, on its own, tell you the uptrend is over. A sideways stretch in an uptrend can be a resting place, or it can be the top (distribution). Part 2 covers how to tell the two apart.
2. How It Differs From Accumulation: The Range Looks Alike, the Location Doesn't
In Wyckoff, accumulation is a range that forms at the bottom of a long decline. Reaccumulation uses the same phase names (Phase A–E) as accumulation, and the range looks similar. What differs is where it forms.
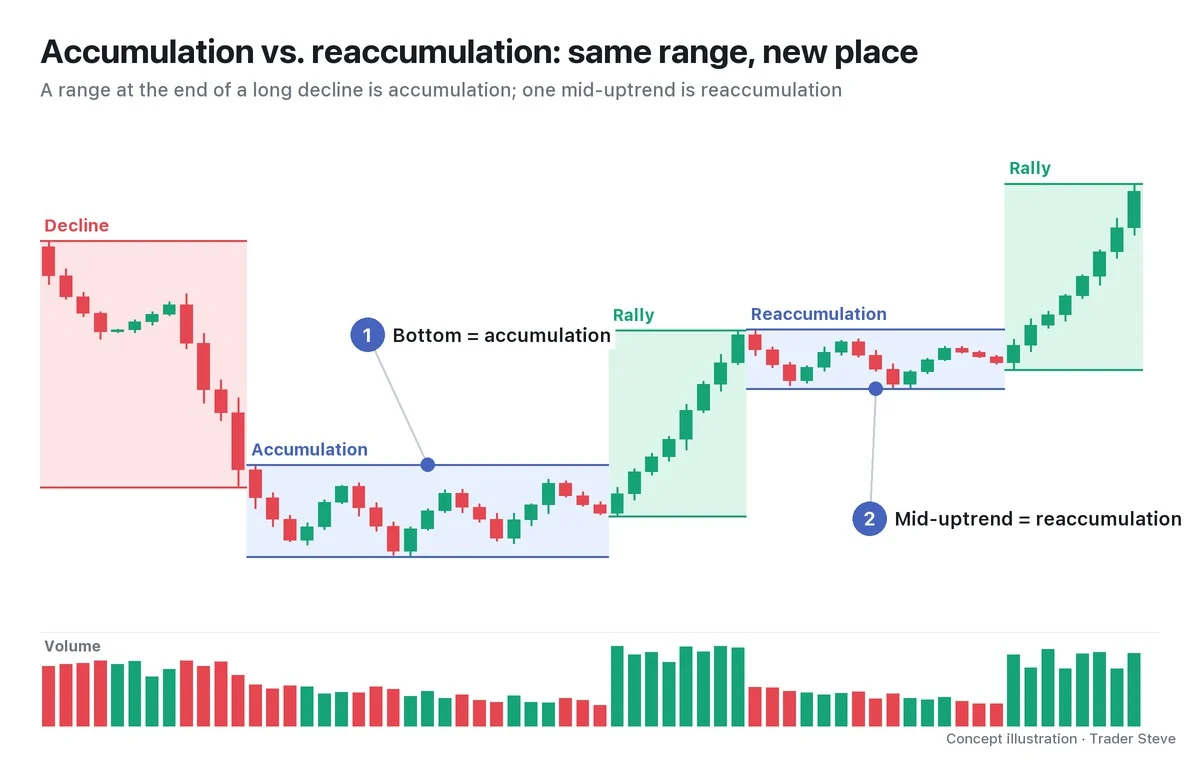
| Accumulation | Reaccumulation | |
|---|---|---|
| Location | End of a long decline (the bottom) | Middle of an uptrend |
| Prior move | Decline | Rally |
| Supply absorbed in the range | Exhausted selling and panic selling | Profit-taking from the prior rally |
| Size (cause) | Usually longer and wider | Usually shorter and shallower (many exceptions) |
| Phases | Phase A–E | The same Phase A–E, with two possible starting shapes |
| Afterward | The markup begins | The markup continues |
In Wyckoff's four-phase cycle (accumulation–markup–distribution–markdown), reaccumulation is a pause inside the markup. The first bottoming range after a long decline is accumulation; a range that forms later, on the way up, is reaccumulation. The Wyckoff Accumulation Phases lessons covered Phase A–E themselves; Part 2 shows how those phases change in reaccumulation.
3. Why It Forms: Digesting the Prior Rally and Rebuilding the Cause
After a big rally, some of the people who rode it want to lock in their gains. Where the rally stalls, profit-taking hits the market all at once, and price can't go higher — it gets pushed sideways.
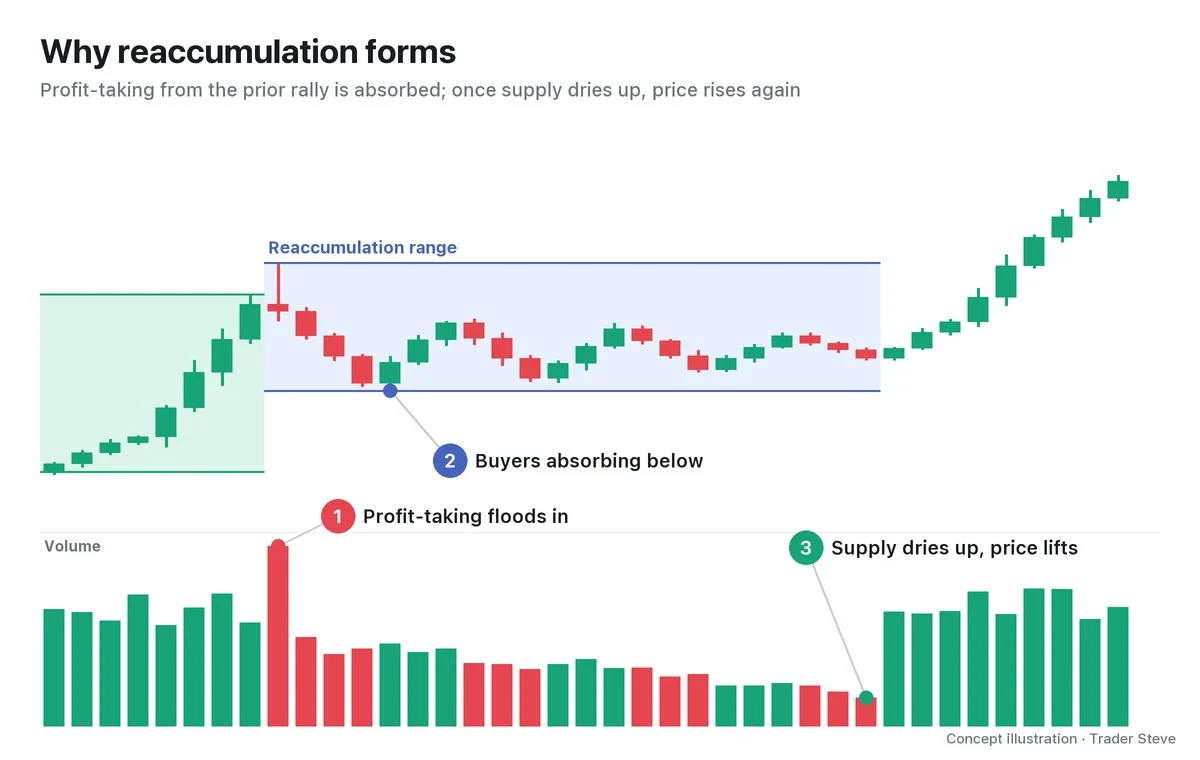
Reaccumulation is read as someone absorbing that supply inside the range. If they kept buying price higher, they would only raise their own average entry price, so they build size while price swings up and down inside the range. Once there are fewer sellers left, volume dries up, and at that point even modest buying can lift price out of the top of the range.
On a live stream, I explained this flow while looking at the Ethereum daily chart:
"The ones who were going to accumulate down here have already finished. … The ones accumulating down here are already done, and they've broken above the baseline, come up, and are stacking up here while building a high-volume zone, so…" — Trader Steve, live stream, Oct 21, 2026, looking at the Ethereum daily chart (translated from Korean) · ▶ Watch the stream highlights (Korean audio)
"Accumulate below → break out → build again higher up" — that is reaccumulation in its shortest form. Through Wyckoff's law of cause and effect, the range is the cause and the move after price leaves the range is the effect. The idea is that the longer and wider the range, the bigger the next move tends to be.
4. What a Reaccumulation Range Looks Like
In textbook diagrams and on real charts, a reaccumulation range usually unfolds in this order:
- The rally stalls: the rally stops on heavy volume and the first pullback appears.
- The range forms: price swings between the first pullback low and the high where the rally stalled.
- Volume dries up: volume shrinks in the later part of the range. That's read as evidence that supply is running out.
- Price breaks out to the upside: volume picks up again and price closes above the top of the range.
The most important clue here is volume. If volume inside the range doesn't shrink and instead grows on every drop, the evidence is shifting toward distribution rather than reaccumulation. Sometimes there's also a brief break below the bottom of the range that comes back (a spring or shakeout); Part 2 covers this as part of the structure.
5. A Real Chart: Ethereum's Staircase in 2025
The Ethereum daily chart from spring 2025 shows one step of the staircase. The labels below are one interpretation, applying Wyckoff to a past chart.
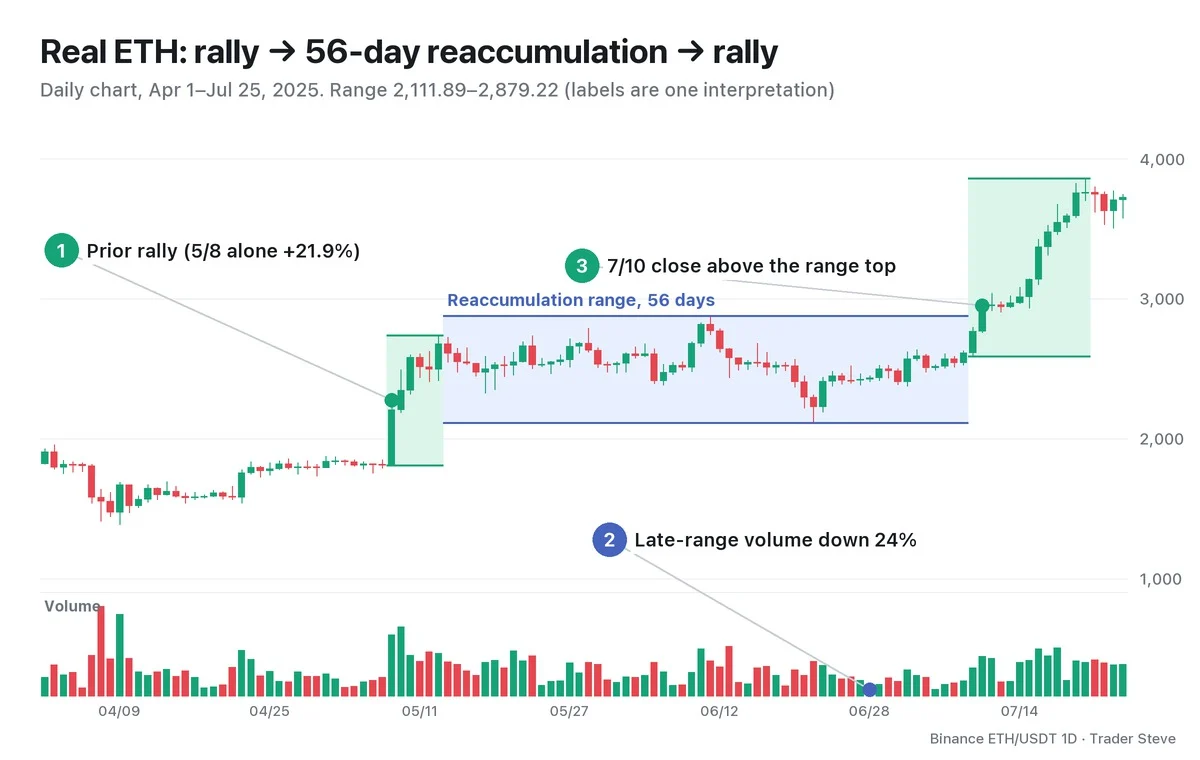
- ① Prior rally: price rose about 98%, from a low of 1,385.05 on Apr 9 to a high of 2,738.50 on May 13. On May 8 alone it gained 21.88%, on 3.17x normal volume (the average of the previous 20 days).
- ② Reaccumulation range (May 14–Jul 8, 56 days): the first pullback reached a low of 2,323.21 on May 18, and the top of the range was the Jun 11 high of 2,879.22. On Jun 22, price stabbed deep to 2,111.89, 9.1% below the May 18 low, then made a higher low again at 2,386.52 on Jul 1. Average daily volume fell from 1,175,194 ETH in the rally (5/8–5/13) to 638,285 ETH in the first half of the range (5/14–6/11) and 486,047 ETH in the second half (6/12–7/8). The second half was 24% lighter than the first.
- ③ Rally again: the Jul 10 close of 2,951.29 was the first close above the top of the range, and volume picked up again to 2.09x normal. The Jul 21 high was 3,860.00.
As a taste of cause and effect: adding the range height (2,879.22 − 2,111.89) on top of the range gives 3,646.55, and price reached it on Jul 18. But this is a simple projection, not a point-and-figure (P&F) count, and it doesn't always work out like this. The Bitcoin (BTC) case in Part 4 had not reached the same calculated level as of this writing.
One more thing to remember: on the day of the Jun 22 low, nobody could confirm that this range was reaccumulation. The name could only be applied after price broke out above the range in July.
BTC June 2025: Shared Range Cross-Check
| Period · timeframe · interpretation | Selling/buying climax (SC/BC) · automatic rally (AR) | Bottom–top · updates | Confirmation |
|---|---|---|---|
| Jun–Jul reaccumulation after the May high; small range on the daily chart | Mid-uptrend range with no separate SC; a boundary high is used instead of an AR | 6/5 100,372–6/9 110,530 | 6/22 98,200 spring candidate, then a 7/9 close above the top |
| Large cycle range, weeks of 5/19–11/3 | The whole phase, not individual SC/AR events | Extended to 6/22 98,200–week of 10/6 126,200 | Decline confirmed in the week of 11/10 |
The same 6/22 low is a reaccumulation spring in the small range and the bottom of the distribution range in the large one (Wyckoff Spring Part 1, Wyckoff Market Cycle Part 1). The SC → AR → secondary test (ST) accumulation sequence that ends a downtrend is not applied as a requirement for this small range.
Key Takeaways
- Reaccumulation is a sideways range that forms in the middle of an uptrend — a landing on the way up the staircase.
- It uses the same Phase A–E as accumulation, but its location (end of a decline vs. middle of an uptrend) and size differ.
- It's where profit-taking from the prior rally is absorbed inside the range and the cause for the next rally is rebuilt.
- The typical shape: volume dries up inside the range, then picks up again as price breaks out to the upside.
- In the middle of the range, you can't yet know whether it's reaccumulation or distribution. The name is only confirmed in hindsight.
In Part 2, we'll cover the structure of reaccumulation, from the range forming to the rally out of it (Phase A–E, Schematic #1 with a spring and #2 without one), plus a checklist for telling it apart from distribution.
This lesson adapts the text, figures and live-stream quotes of the Trader Steve TA series for the web, translated from the original Korean. Check the text and figure captions for the timing and interpretation of each real example, and read conceptual diagrams and real charts separately.
Corrections: support@omnisight.report


