
What Is Wyckoff Redistribution? The Range in the Middle of a Downtrend
Historical examples for learning · not current prices or trade recommendations.
Contents
When a chart drops hard and then starts crawling sideways, the first thought is usually "Is this the bottom?" Wyckoff, however, saw that a range in the middle of a decline may not be a bottom at all — it can be a pause that sets up the next leg down. This lesson explains what that range, redistribution, is, why it forms partway through a decline, and how it differs from accumulation, reaccumulation and distribution, all on a single map.
All dates and times are Korea Standard Time (KST, UTC+9). A daily candle is dated by its 09:00 KST open; intraday extremes are identified by their KST date and time.
1. The One-Line Definition: Decline → Range → Decline
Redistribution is a long sideways range that forms when a downtrend (markdown) pauses. That range is called a trading range (TR). The prior decline stops for a while, big players (the Composite Man, in Wyckoff's terms) hand off the size they haven't finished selling into the bounces, and then price breaks below the range and the decline continues. If the downtrend is a staircase going down, redistribution is the landing halfway down.
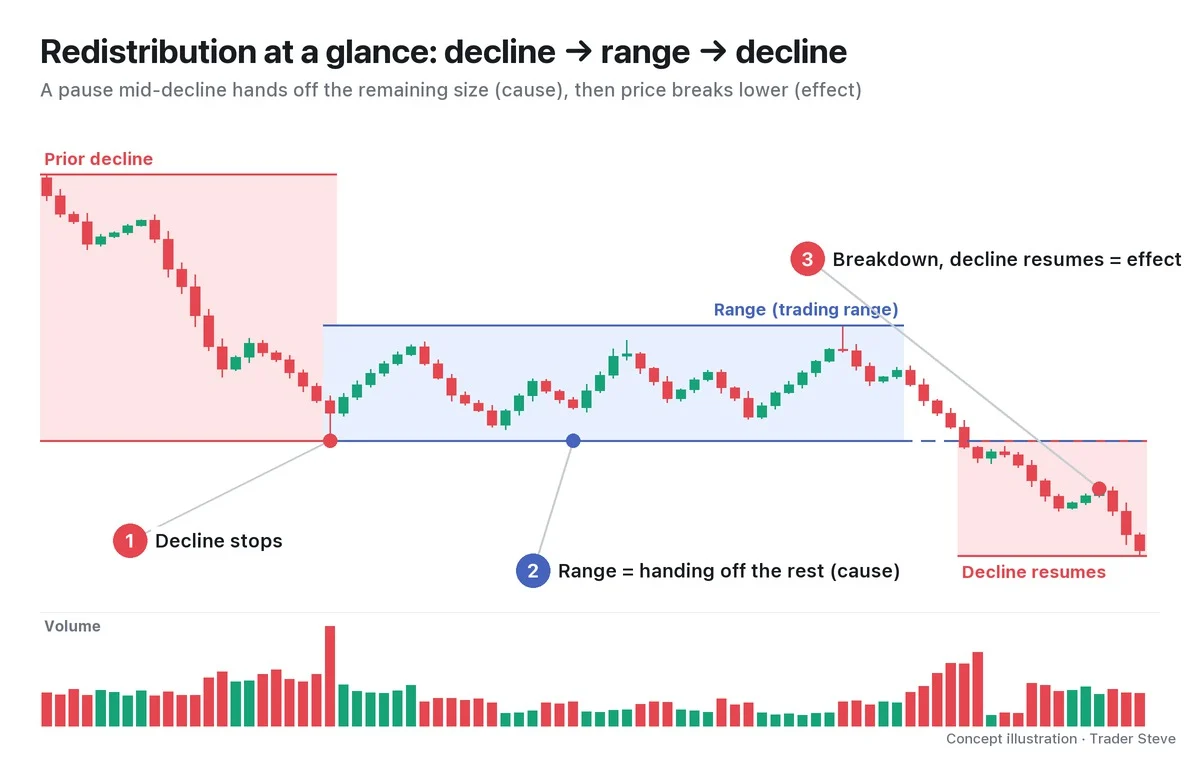
Wyckoff called the range the cause and the move after price leaves it the effect. Something I said while looking at a short-timeframe Bitcoin (BTC) chart captures this definition exactly.
"Either way, it's put in a high and it's heading into a structure of lower highs like this, and it is coiling. But this coiling structure … it isn't coiling here after pushing hard up — it's coiling after getting slammed down, right? In a case like that, the odds of a continuation of the existing bearish structure are overwhelmingly high." — Trader Steve, live stream, Oct 12, 2026 (translated from Korean) · ▶ Watch this moment (Short, Korean audio)
Still, this is an observation that something is likely, not a certainty. In the middle of the range you can't yet tell whether it is redistribution or a bottom (accumulation), so throughout this topic I treat redistribution as a hypothesis.
2. Why It Forms: Big Size Only Sells If Someone Is There to Buy It
Big players hold far more than they can sell in one go. If they dumped it all at once in a falling market, the buy orders able to absorb it would quickly run out, and they would drive the price down further themselves. So they wait for bargain hunters to step in and hand off the remaining size into those bounces a little at a time. While that repeats, price stays trapped inside a range.
I said this about supply and demand in the KOSPI (Korea's benchmark stock index), but the core idea is the same.
"On the way up there are plenty of buyers, so holders can hand their size to foreign institutions and give up the upside as price rises. But now the foreigners have all sold and left, right? If the National Pension Service, or whichever pension fund, sells the enormous size it's holding right now, who's going to buy it? Who buys? Nobody does." — Trader Steve, live stream, Oct 13, 2026 (translated from Korean) · ▶ Watch the stream highlights (Korean audio)
In a decline, a bounce is not a signal to big players that price will go higher — it is a chance to hand off the size they still hold. The big players' side of the story is covered in Wyckoff Composite Man (related lesson).
3. Four Kinds of Range: The Name Comes From the Location
Wyckoff has four kinds of range. Their insides often look similar, so you name a range first by where it sits in the trend.
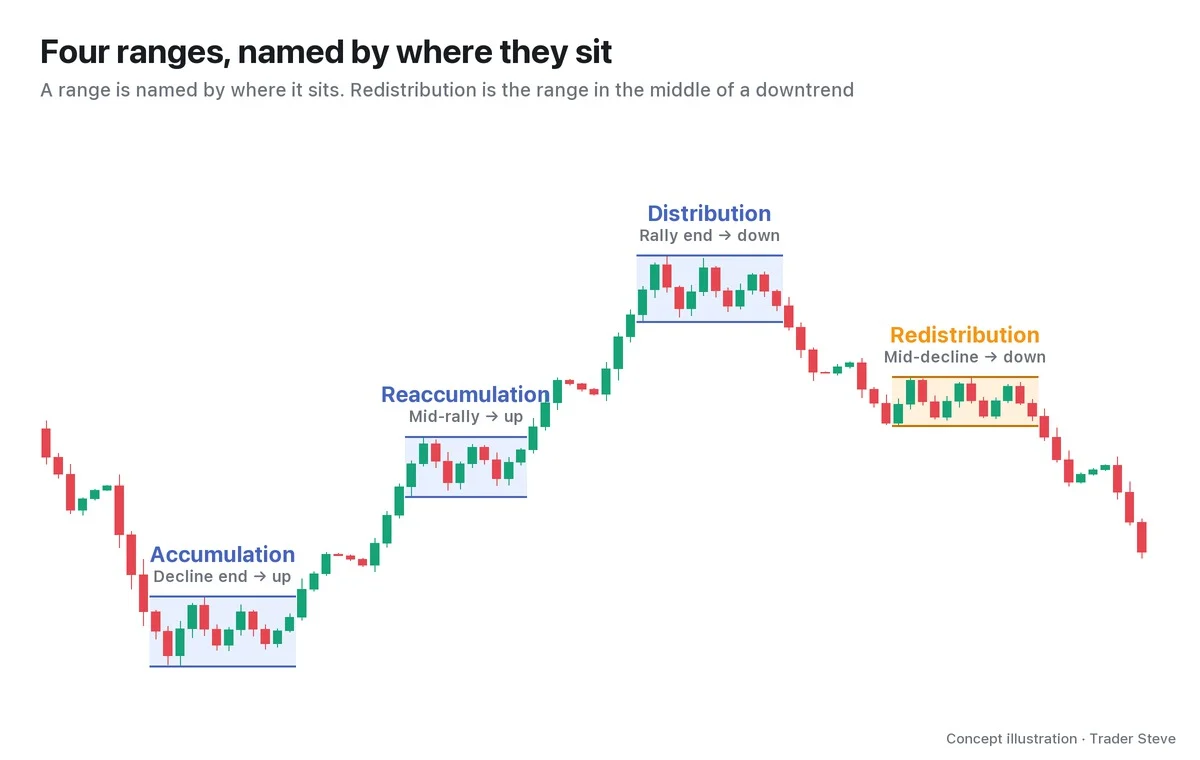
| Range | Prior trend | After the range | What it is |
|---|---|---|---|
| Accumulation | End of a long decline | Rally begins | Buying cheap |
| Reaccumulation | Middle of a rally | Rally continues | Pausing on the way up to buy more |
| Distribution | End of a long rally | Decline begins | Selling high |
| Redistribution | Middle of a decline | Decline continues | Pausing on the way down to hand off the remaining size |
Redistribution uses the same event names as distribution. But distribution forms at the end of a long rally, while redistribution forms partway down, and it is usually described as a shorter, smaller range. Its mirror image, reaccumulation, is covered in Wyckoff Reaccumulation (related lesson).
Also, because a redistribution range begins with a decline coming to a stop, its start looks exactly like the start of accumulation. That trap, and the criteria for telling the two apart, are covered in Part 2.
4. Shape and Volume
A redistribution range usually shows the following three features.
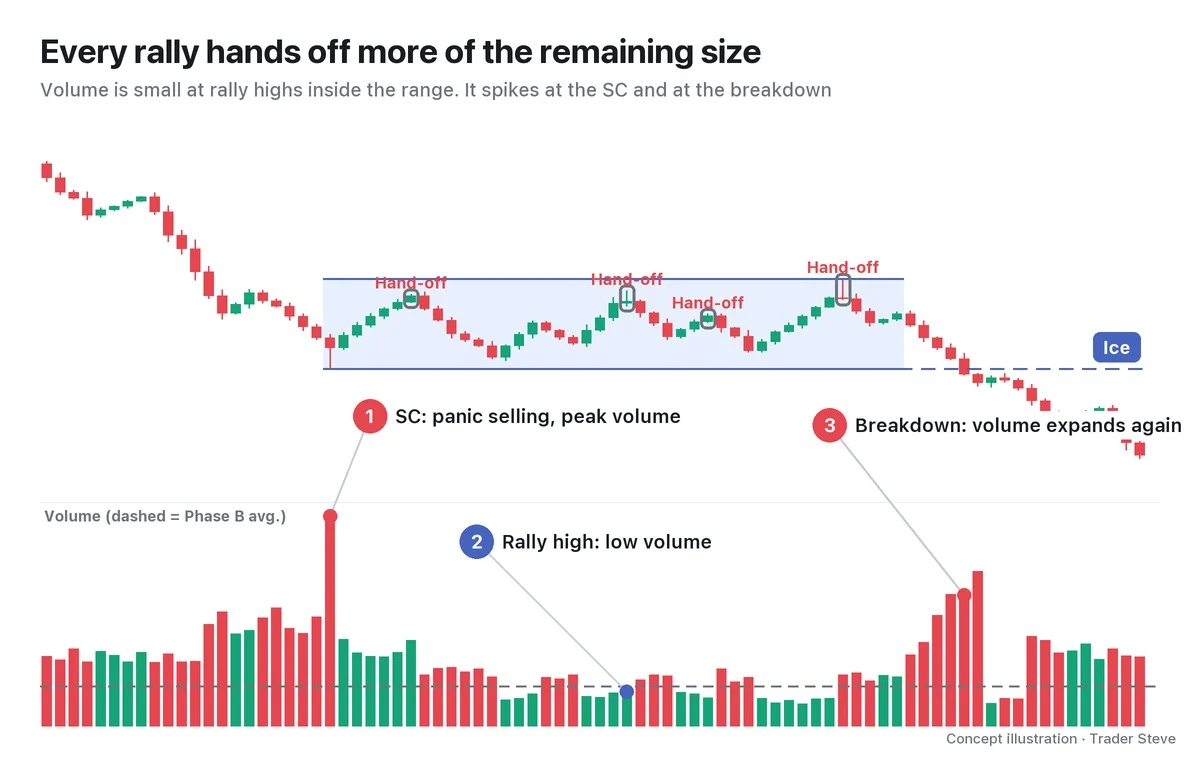
- The floor is the end of the prior decline: the low of the panic selling that stopped the decline — the selling climax (SC) — becomes the floor of the range. Wyckoff compared this floor to a sheet of ice and called it the ice. Volume spikes the most here (①).
- The bounces have no strength: volume at the rally highs inside the range is not large (②). These are the spots where big players pile size onto rallies with weak demand — marked "Hand-off" in the chart.
- One poke above, then a break below: near the end of the range, price often pushes briefly above the ceiling and comes back, and after that, volume expands again on the decline that breaks the ice on a closing basis (③). Event names such as the upthrust after distribution (UTAD), sign of weakness (SOW) and last point of supply (LPSY) are sorted out in Part 2.
Rather than generalizing that "bounces always have low volume," it is more accurate to compare the panic selling, the rally highs and the breakdown point one by one.
On the live stream, I usually call this setup a "bear flag" or "a continuation of the bearish structure." A bear flag is a short, upward-sloping bounce channel, while redistribution is a horizontal range with events in it, but the idea is the same: "a pause in a decline → the decline continues."
5. Real BTC, 2022: Decline → 105-Day Range → Breakdown
Let's look at a range on the real Bitcoin daily chart that resembles redistribution, by shape only and without event names (Binance daily candles open at 09:00 KST).
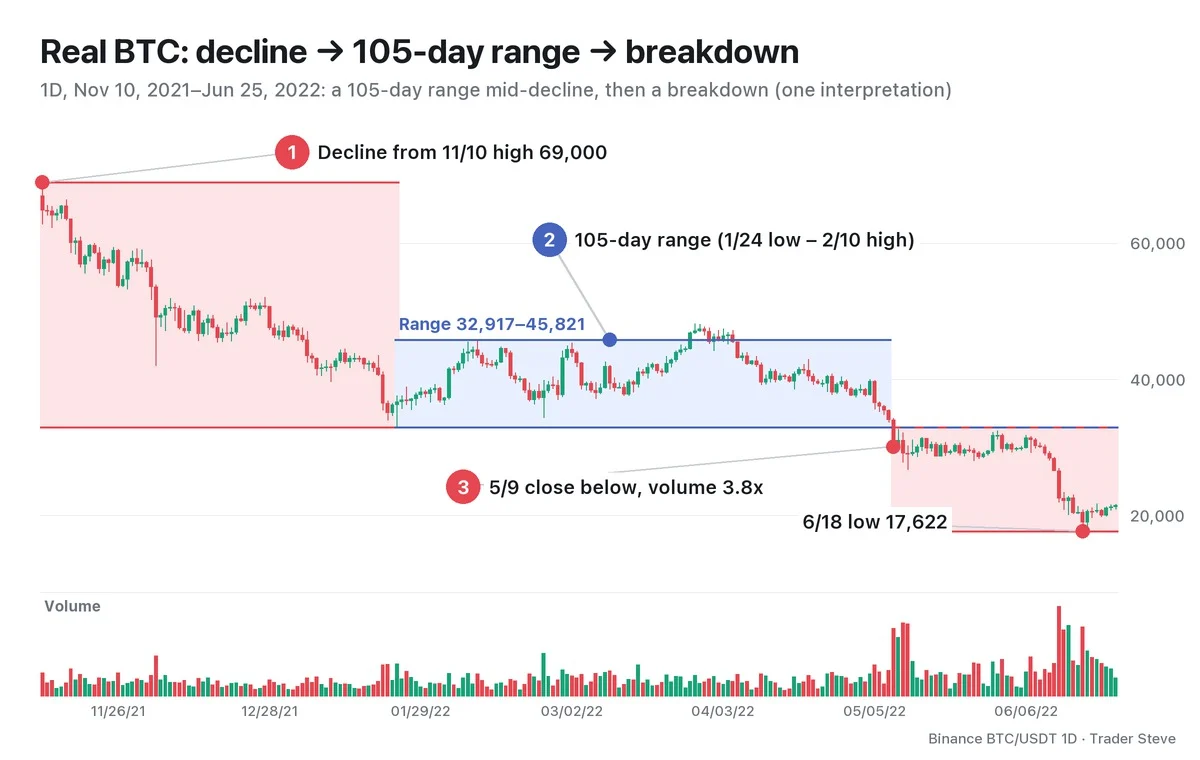
The decline that started from the Nov 10, 2021 high of 69,000 stopped at the Jan 24, 2022 low of 32,917, -52.3% from the high. After that, price moved up and down inside a range whose ceiling was the Feb 10 high of 45,821 (+39.2% from the floor). In late March, price rose above the ceiling to a high of 48,190 on Mar 28, but it couldn't hold, and from Apr 5 the closes were back inside the range (the "one poke above" from Section 4).
Then on May 9, price closed at 30,076 — its first close below the floor of the range (32,917). Volume that day was 3.8x the previous 20-day average. The range had lasted 105 days, and through Jun 25 no close made it back above the floor. The Jun 18 low was 17,622, -46.5% from the floor of the range. That said, the May crash coincided with the Terra (LUNA) collapse, so an outside event may have amplified the size of the breakdown.
The sequence matches the chart in Section 1, but it is one interpretation made in hindsight. While the range was still forming, it could also have been read as accumulation. Event names are added in Part 4.
Where this sits in the larger cycle is covered in Wyckoff Market Cycle (related lesson), and the phase map in Wyckoff Distribution Phases (related lesson).
Key Takeaways
- Redistribution is a range that forms when a downtrend pauses partway — the landing in decline → range → decline.
- In a falling market few traders are there to absorb big size, so big players wait for bounces to hand off the size they still hold. The range is the cause; the decline after the breakdown is the effect.
- Accumulation, reaccumulation, distribution and redistribution are told apart first by their location in the trend, not by the shape of the range.
- Check whether volume is large at the panic selling, small at the rally highs, and large again at the breakdown of the floor.
- Inside the range it is a hypothesis. It is confirmed when price leaves below the ice on a closing basis and holds below it.
In Part 2, we'll cover Phases A–E and the order of events from the formation of redistribution to the decline outside the range, along with a checklist for telling it apart from accumulation.
Laying out both hypotheses — redistribution and accumulation — for every range in a decline and checking them by hand each time takes real time. If you want an analysis that pulls several theories together in one place, see the report below.
This lesson adapts the text, figures and live-stream quotes of the Trader Steve TA series for the web, translated from the original Korean. Check the text and figure captions for the timing and interpretation of each real example, and read conceptual diagrams and real charts separately.
Corrections: support@omnisight.report


