
What Is a Selling Climax (SC)? How a Capitulation Bottom Works
Historical examples for learning · not current prices or trade recommendations.
Contents
When a decline drags on long enough, a day comes when everyone gives up at once ("I can't take this anymore") and dumps. Wyckoff treats that very day as a bottom candidate and calls it a selling climax (SC). This lesson uses diagrams to show what an SC is, who is selling and who is buying, and why the most frightening day turns into the day the decline stops.
All dates and times are Korea Standard Time (KST, UTC+9). A daily candle is dated by its 09:00 KST open; intraday extremes are identified by their KST date and time.
1. The One-Line Definition: The Peak of Selling at the End of a Long Decline
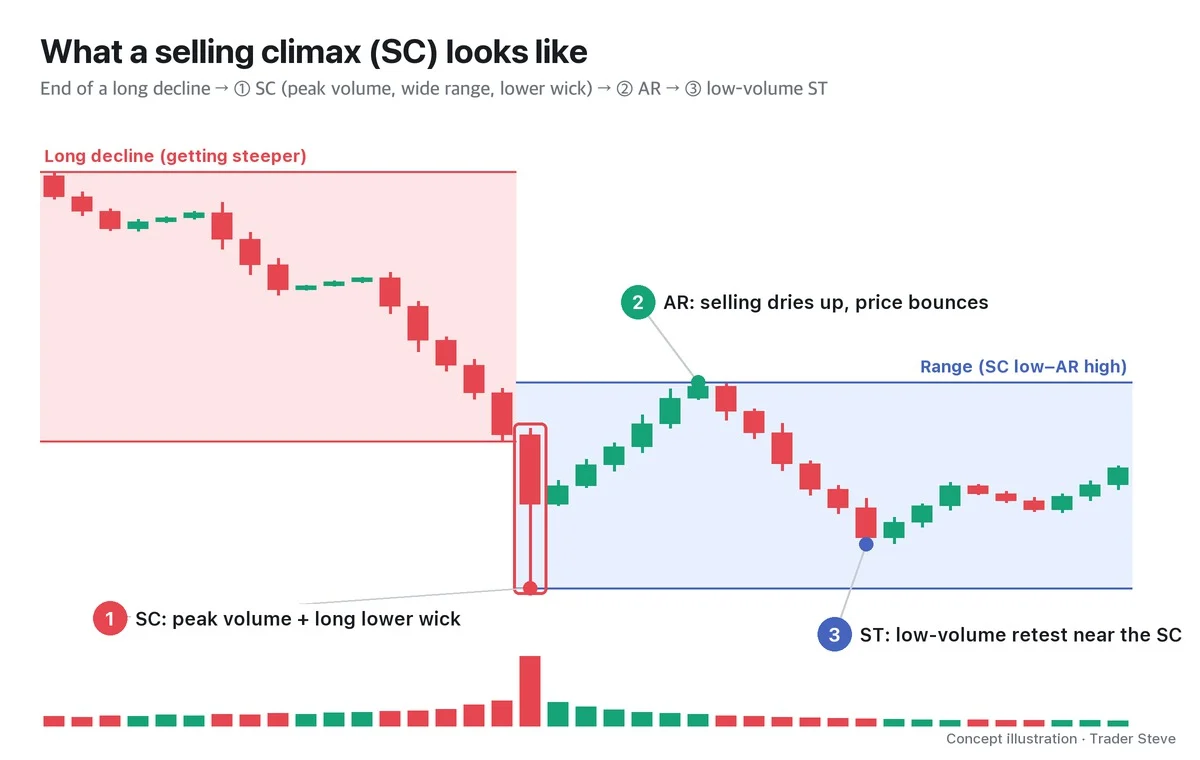
An SC is the spot at the end of a long decline where fear selling, stop-losses and forced liquidations pour out all at once, and someone absorbs that supply so the decline stops. On a chart, four things usually show up together.
- After a long decline: it comes at the end of an extended slide, often just as the decline gets steeper instead of easing.
- The largest volume: the biggest of the last few dozen candles, several times the average.
- The widest candle range and a new low: the distance between high and low is far wider than usual, and the candle prints the lowest price of that stretch.
- Signs of a bounce: it leaves a long lower wick, or the next candle recovers quickly.
Here is a moment from a live stream where the SC was explained on a chart of a different market (SOXL). The key is how much volume came in.
"Volume exploded at this point. The volume here was about as big as all the volume before it combined. This is where the so-called selling climax, the climax of selling, got printed. … It marked the peak of the decline very clearly, right here." — Trader Steve, live stream, Sep 4, 2026 (translated from Korean) · ▶ Watch the stream highlights (Korean audio)
2. Who Sells and Who Buys: Panic Selling and Absorption
A trade only fills when there is a buyer for every seller. Record-breaking volume means someone bought just as much.
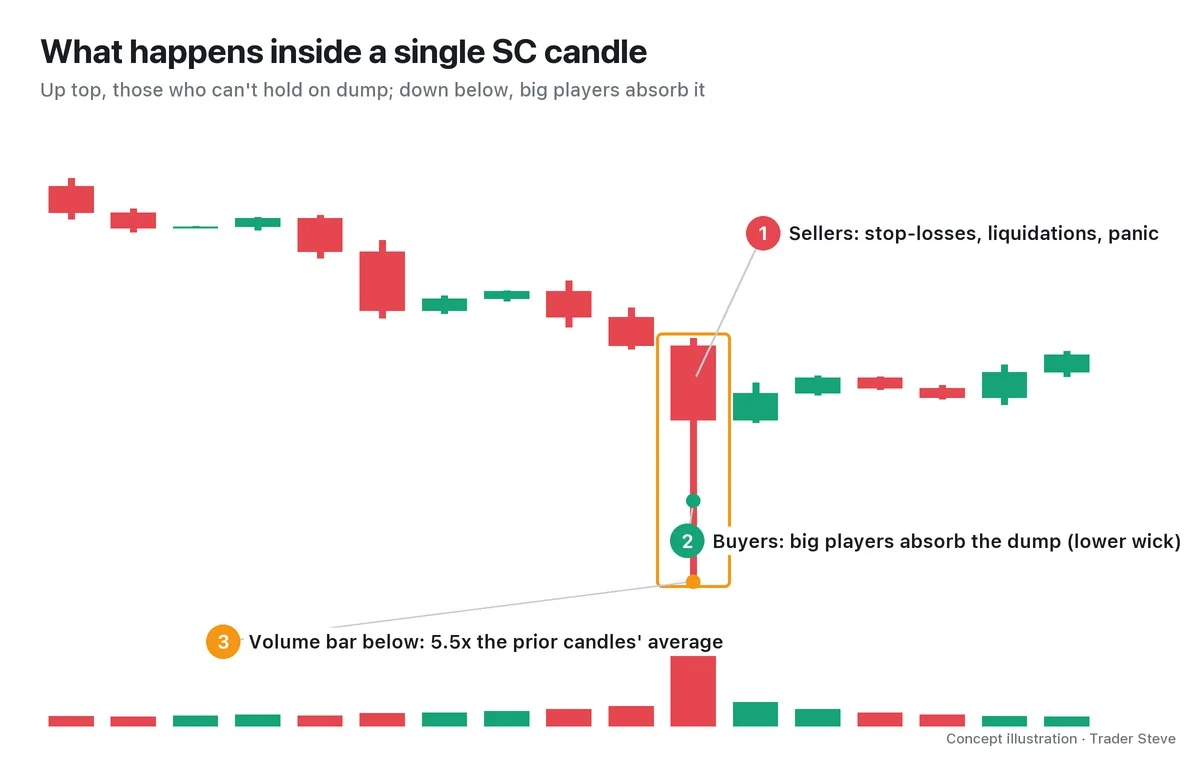
- The sellers: people whose stop-loss levels broke, people being force-liquidated, and people gripped by fear who think "sell now, ask questions later." This supply comes from emotion and compulsion.
- The buyers: big players (Wyckoff's Composite Man) who have been waiting to pick up that supply cheaply. Taking it in like this is called absorption.
"Volume exploding like this means people couldn't hold on here and hit the sell button, so stop-losses and forced liquidations went off in huge numbers. … When price broke through here and dropped hard, massive selling came out, and the small traders got completely shaken out here." — Trader Steve, live stream, Sep 4, 2026 (translated from Korean) · ▶ Watch the stream highlights (Korean audio)
Wyckoff's first law, the law of supply and demand, applies directly here. While sellers remain, price goes down; once they have sold everything, nothing is left to push it lower. So, paradoxically, a bottom only forms when everyone dumps. The following was said while explaining a support-line breakdown in a different market.
"If everyone dumps when it's time to dump, someone actually soaks that up and you get a bounce. But if nobody dumps and everyone holds on? Then it goes all the way down to here. … If everyone dumps, it goes up." — Trader Steve, live stream, Oct 16, 2026 (translated from Korean) · ▶ Watch this moment (Short, Korean audio)
3. Through the Lens of Effort vs. Result: Selling Harder, Falling Less
Another way to recognize an SC is Wyckoff's law of effort vs. result. Volume is the "effort," and the distance price moves is the "result."
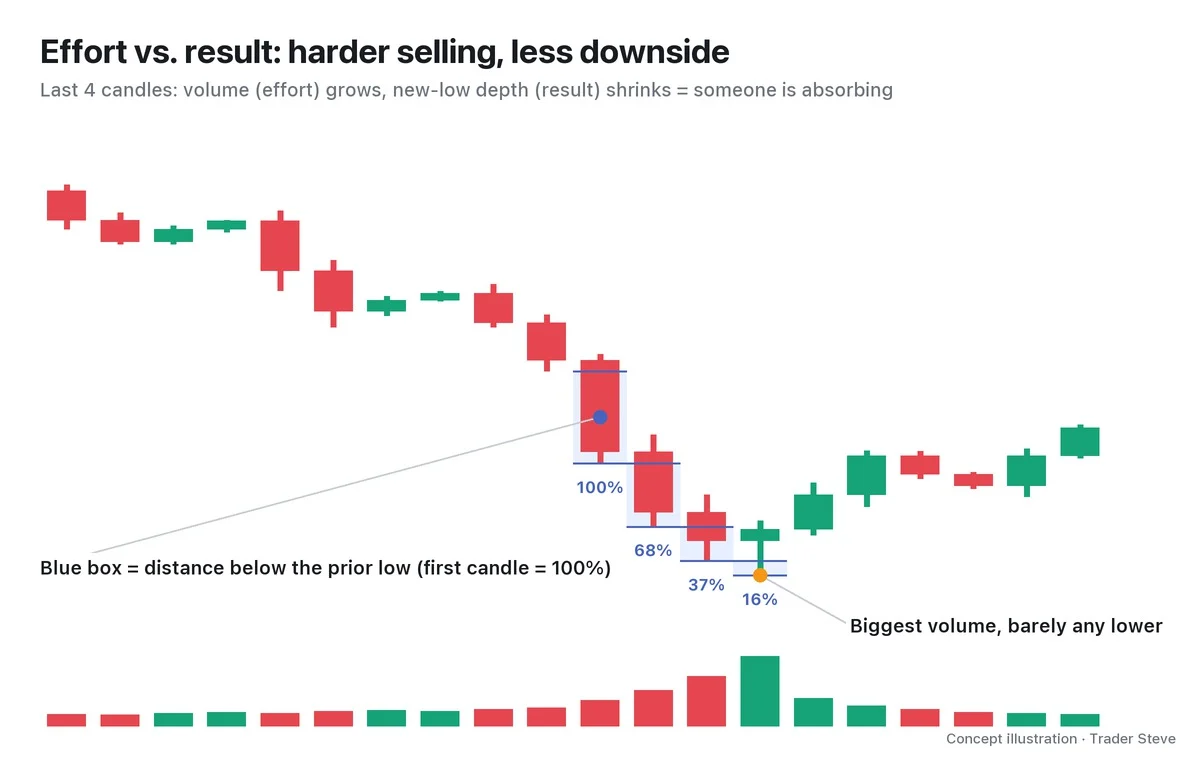
In a normal decline, more selling should mean more downside. If volume keeps growing while each new low gets shallower, someone is absorbing the selling from below. Maximum effort with a shrinking result: that is the footprint of absorption.
4. What Comes After the SC: AR, ST and Confirmation in Hindsight
There is one thing to remember about the SC. An SC is not confirmed on the spot. At the moment volume spikes, it is hard to tell apart from "the start of a bigger decline." That's why you only say "that was the SC" after you see the two things that follow.
- Automatic rally (AR): once selling dries up, price springs up on its own. The high of this bounce becomes the top of the range.
- Secondary test (ST): price comes back down near the SC price area to check it. If volume this time is much smaller than at the SC and price stops near the SC low, that confirms "there isn't much supply left to sell."
The SC low (bottom) and the AR high (top) form the first frame of the accumulation range. So you don't declare "this is the bottom" the moment you see an SC candle. It signals that the decline has stopped, not that price will go up. How to tell the SC apart from preliminary support (PS), the heavy volume that appears before it, is covered in Part 2.
5. Its Place in the Cycle: The End of the Decline Is the Start of Accumulation
The market cycles through accumulation → markup → distribution → markdown. In that cycle, the SC sits on the boundary where the decline ends and accumulation begins. In terms of the Wyckoff accumulation structure, it is the central event of Phase A (the stage that stops the decline), which is made up of PS, the SC, the AR and the ST.
"In a word, the selling climax has happened, and from here they accumulate, then push price up, and up here they're selling the size. The ones who bought down here are selling up here." — Trader Steve, live stream, Sep 21, 2026 (translated from Korean) · ▶ Watch the stream highlights (Korean audio)
As this explanation of an Ethereum chart shows, the side that picked up supply cheaply at the SC finishes accumulating, lifts price, and hands that size off higher up. The mirror image at the end of that rally is the buying climax (BC): a peak of greed rather than fear.
6. On a Real BTC Chart: The February 2026 Capitulation
This is a real Bitcoin (BTC) daily chart. The SC and AR labels are an interpretation from a Wyckoff perspective.
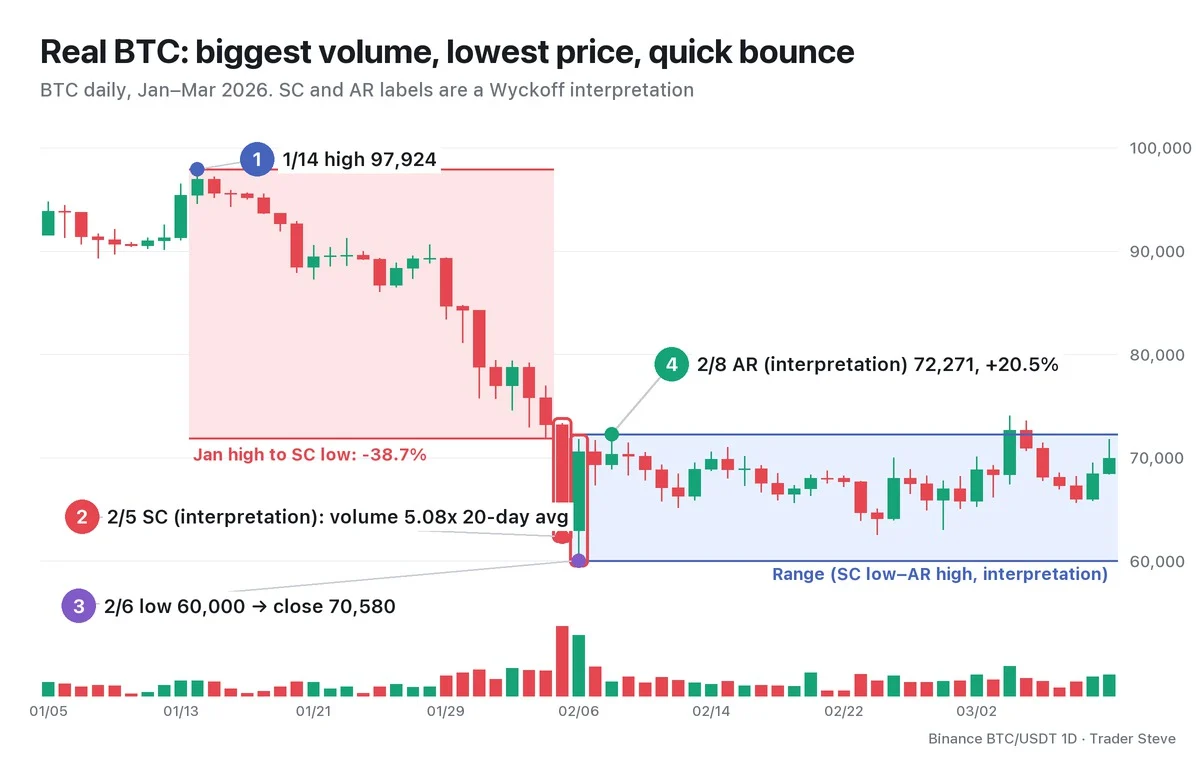
- Long decline: price started down from the 97,924 high on Jan 14, and the decline steepened from late January.
- Feb 5: low 62,345, close 62,910, so it closed almost at the low. Volume was 106,299 BTC, 5.08x the previous 20-day average and the largest of the previous 60 days. The candle's range was 2.92x the average true range (ATR 14), and the Relative Strength Index (RSI 14) fell to 15.8.
- Feb 6: price printed a low of 60,000 and closed at 70,580. It finished at 90% of the day's range, on volume 3.61x the average. The decline stopped at -38.7% from the January high.
- AR: price sprang up on its own to a 72,271 high on Feb 8, 20.5% above the SC low.
"Largest volume, lowest price, immediate bounce" all showed up across two days. The ST that followed and the trade plan are covered in Part 3.
For the same 2026 BTC, the larger range is read from the 2/6 SC and the smaller range from the 6/5 SC. For the periods, boundaries, update rules and confirmation conditions, see the shared range reference table in Wyckoff Accumulation Phases Part 4.
Key Takeaways
- An SC is the spot at the end of a long decline where panic selling pours out and big players absorb that supply, so the decline stops.
- The largest volume, the widest range, a new low, and either a lower wick or a fast recovery appear together.
- Maximum volume (effort) with little further downside (result) is the footprint of absorption.
- An SC is not confirmed on the spot. You only say "that was the SC" after the AR and a low-volume ST appear, and an SC label on a real chart is always an interpretation.
In Part 2, we'll put numbers on an SC checklist (volume multiple, candle range, close location) and on how to tell PS from the SC. The law of supply and demand continues in Wyckoff Three Laws, the big players' point of view in Wyckoff Composite Man, and the signal that comes before the SC in Wyckoff Preliminary Support.
If running these checks by hand every time is a chore, the report linked below lays out the Wyckoff structure for each market.
This lesson adapts the text, figures and live-stream quotes of the Trader Steve TA series for the web, translated from the original Korean. Check the text and figure captions for the timing and interpretation of each real example, and read conceptual diagrams and real charts separately.
Corrections: support@omnisight.report


