
What Is a Shakeout? Shaking Out Retail Traders and Why It Happens
Historical examples for learning · not current prices or trade recommendations.
Contents
A support line that held for weeks breaks on heavy volume, stop-losses fire one after another — and less than a day later, price is back where it started. Wyckoff theory calls this a shakeout, and on my live streams I call the same scene "shaking out the retail traders." This lesson uses diagrams and a real Bitcoin (BTC) chart to cover what a shakeout is, why price bothers to break support only to come back up, and where shakeouts appear.
All dates and times are Korea Standard Time (KST, UTC+9). A daily candle is dated by its 09:00 KST open; intraday extremes are identified by their KST date and time.
1. One-Line Definition: A Fast Push Below Support, Then a Quick Return
A shakeout is a move that pushes price quickly below support (the bottom of a range, a prior low or a round number) on wide candles and heavy volume, forces out stop-loss and liquidation supply (the supply of weak holders), and then closes back above support within 1–3 candles.
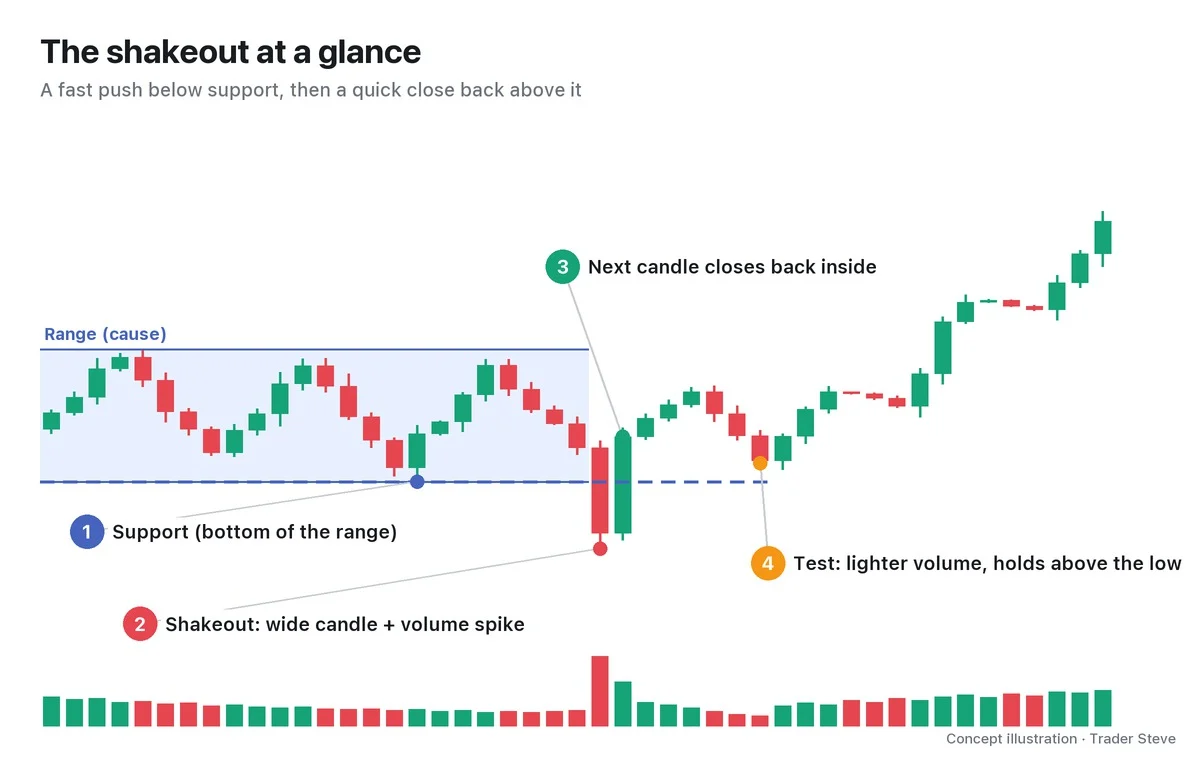
- ① Support: a range (the cause) came first, and many traders treat its bottom as support.
- ② Shakeout: a wide candle prints below the bottom and volume explodes. What defines it is speed and volume, more than depth.
- ③ Return: the close comes straight back above support. You judge it by the close, not the wick.
- ④ Test: when price comes back down, it stops above the shakeout low on lighter volume.
The key point: a shakeout only earns its name after the fact. At the moment support breaks, you cannot tell a shakeout from a real decline (a breakdown). Part 2 covers a 5-step rule for judging it with numbers.
2. Why It Happens, Reason 1: Absorbing Stop-Loss and Liquidation Supply Cheaply
For big money to build a position, someone has to sell it to them in matching size. Inside a range, selling trickles out a little at a time, but there is one place where it pours out all at once: just below the low everyone is watching.
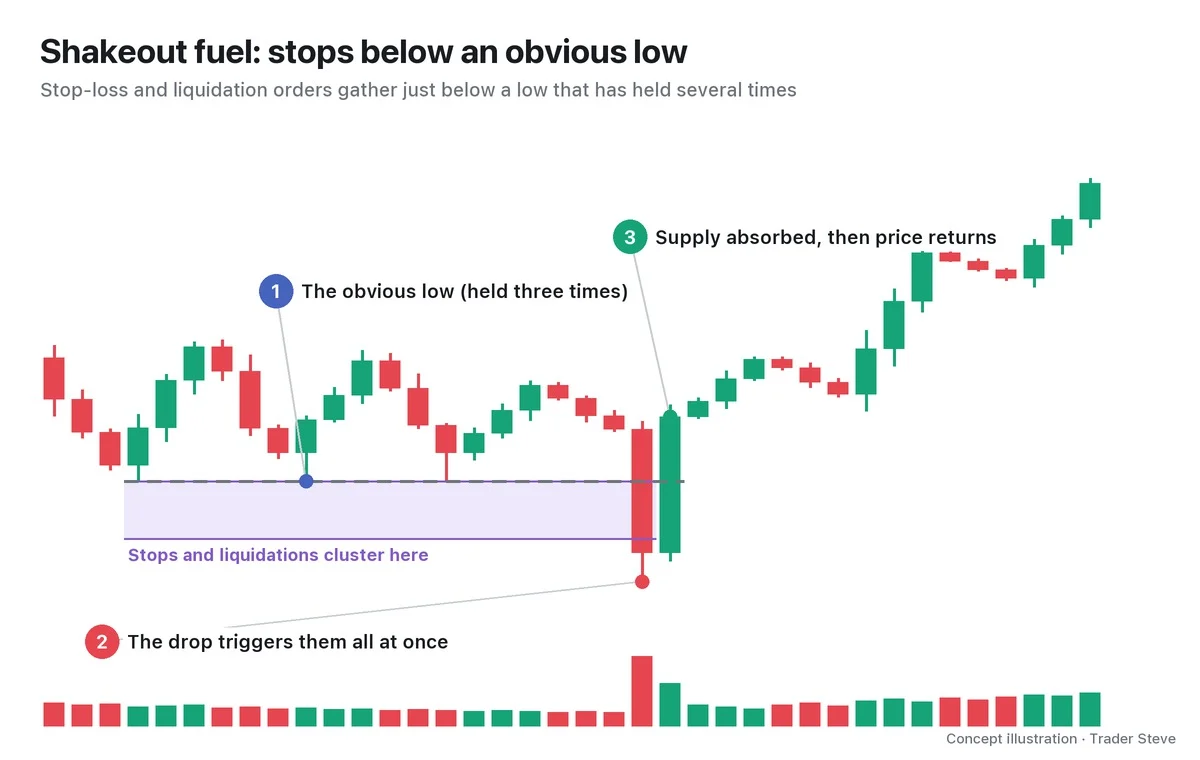
Just below a low that has held several times, stop-loss orders from long positions and the liquidation prices of leveraged positions pile up. When price is pushed into that zone, these orders turn into a chain of market sell orders. For whoever is ready to take the other side, it is a moment to buy large size at a low price. In ICT, this cluster of orders is called sell-side liquidity (SSL) (see ICT Liquidity).
"You could also build a scenario like this: they bring this down, slam the price they forced up back down, shake out everyone who bought up here, scoop up all the stop-loss supply that gets dumped here, and then push it up." — Trader Steve, live stream, Aug 26, 2026 (translated from Korean) · ▶ Watch the stream highlights (Korean audio)
The key word is "absorb." A volume explosion means that someone took the other side of all that selling in equal size. Who does the absorbing was covered in Wyckoff Composite Man.
3. Why It Happens, Reason 2: Price Rises More Easily Once the Riders Are Off Its Back
The second reason is the cost of going up. If many buyers got in early, even a small rise brings out profit-taking and get-me-out-at-breakeven selling. Whoever is pushing price up has to absorb all of that, which costs more money. I describe this as "heavy shoulders." Here is what I said while looking at the Bitcoin chart on the Aug 25 live stream.
"Say I'm the big player, and right now these guys have climbed up on my shoulders. I'm supposed to just carry on without shaking them off? That's going to be heavy, isn't it? Why would I pick the method that costs more money?" — Trader Steve, live stream, Aug 25, 2026 (translated from Korean) · ▶ Watch the stream highlights (Korean audio)
Once the shakeout is done, the road gets lighter. The next explanation came while looking at a different market's chart (XRP); in this scene, bad news was the trigger for the shakeout.
"If this breaks, retail traders all get off here. Anyone would have to get off. … It goes up and then just dumps. Everyone gets shaken out here. They shook them out with the hacking news. Then it takes off. So the reason this could climb so easily, up and up and up … is that in this move … they shook out all the retail traders, right?" — Trader Steve, live stream, Oct 14, 2026 (translated from Korean) · ▶ Watch this moment (Korean audio)
To sum up, a shakeout absorbs stop-loss and liquidation supply cheaply on the way down, and lightens the load of riders on the way up. Keep in mind that this is an interpretation for reading charts, not proof; confirmation always comes from price and volume.
4. Where It Appears: Accumulation Ranges After a Decline and Reaccumulation Ranges in an Uptrend
Not every sharp drop deserves the name shakeout. A range (the cause) has to come first. There are two typical places.
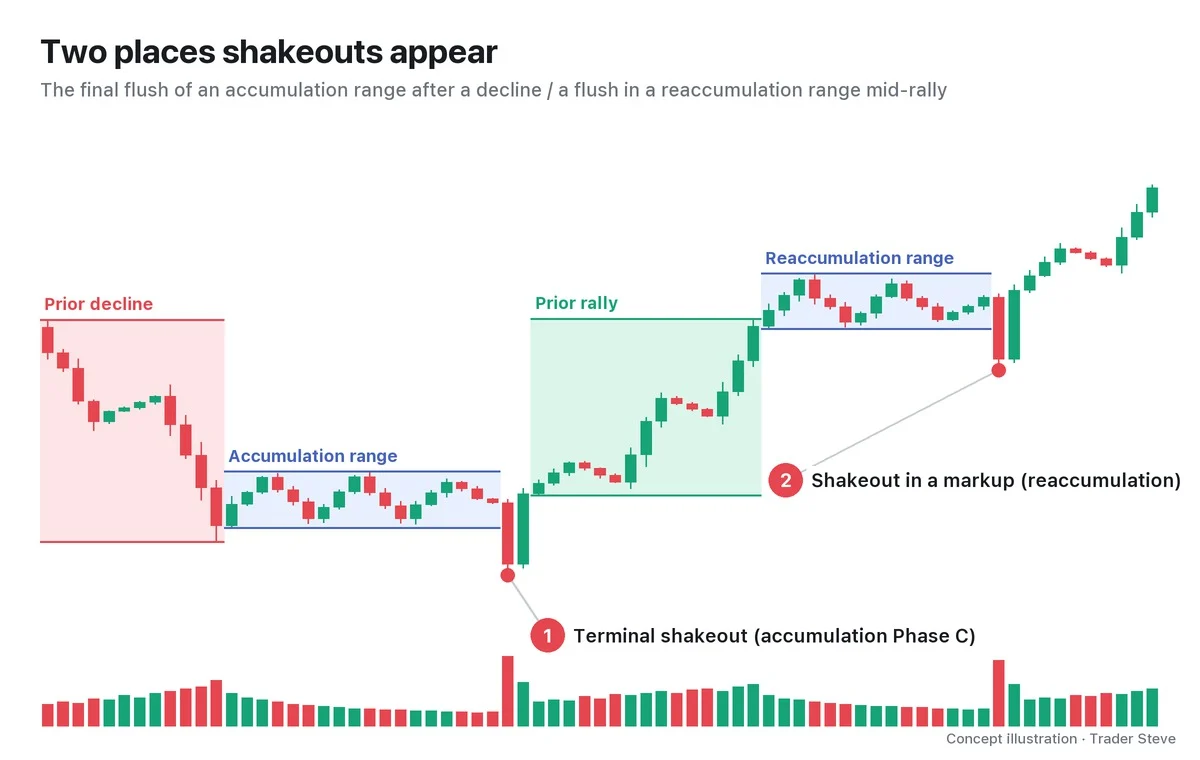
① is the terminal shakeout, which appears in the final testing stage (Phase C) of an accumulation range at the end of a long decline. It sits in the same place as the spring. Textbooks name these differently; some single out the high-volume, violent springs (Type 1) and call them terminal shakeouts. The spring types are laid out in Wyckoff Spring.
② is the shakeout in a markup: in a reaccumulation range partway through an uptrend, price breaks the bottom sharply and then recovers right away. When the bottom breaks, many traders dump their positions, convinced "the rally is over," so this is a spot where shakeouts work well (see Wyckoff Reaccumulation).
5. Real BTC, January 2025: The Day Price Flushed the Bottom of a Mid-Rally Range and Came Back
Let's look at spot ② on a real Bitcoin daily chart. The numbers were calculated from Binance prices; the range and the labels are interpretation.
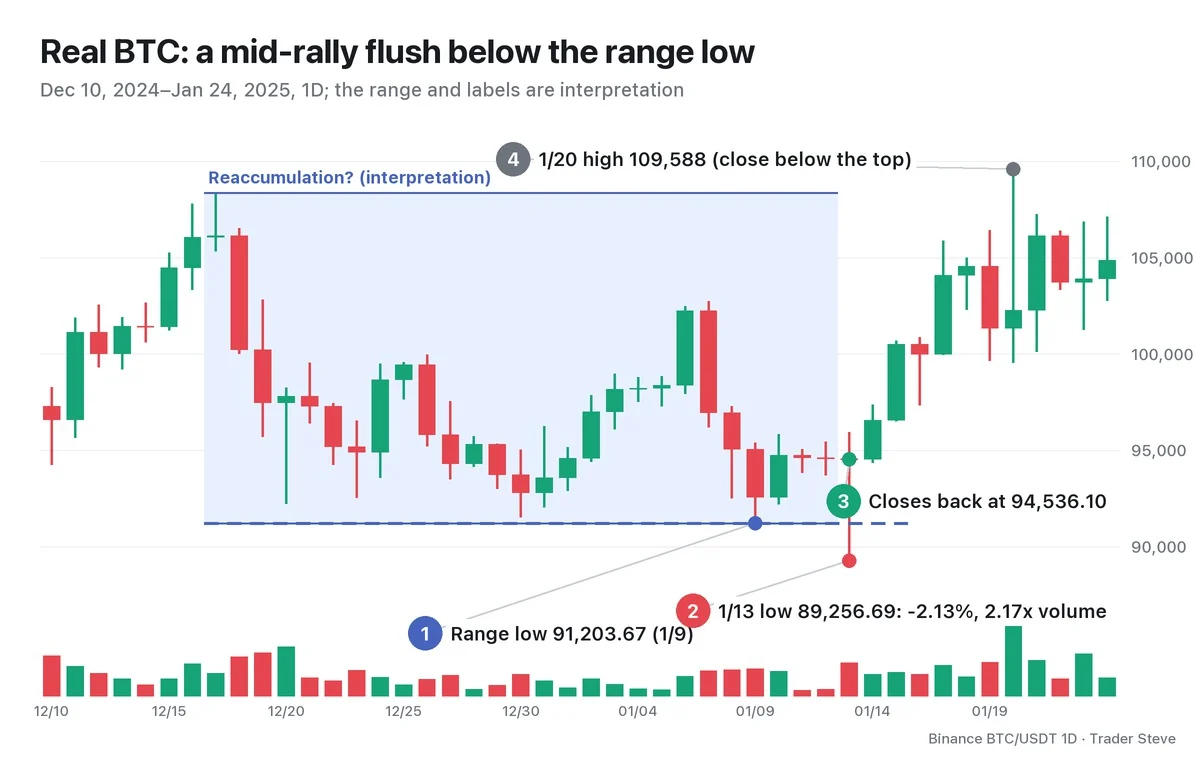
- Prior rally: from the Nov 5, 2024 open of 67,850.01 to the Dec 17 high of 108,353, a gain of 59.7%.
- Reaccumulation range (interpretation): price then swung between 108,353 and the Jan 9 low of 91,203.67 (a height of 18.8%). Price also held near the bottom on Dec 20 (92,232.54) and Dec 30 (91,530.45), which made this the low everyone was watching.
- ① → ② Shakeout: on Jan 13, the low dropped to 89,256.69, breaking the bottom of the range by -2.13%. That day's volume was 2.17x the average of the previous 20 candles (rv20, the relative volume multiple), and the candle's high–low range was 2.01x the previous 20-candle average.
- ③ Return: the same candle closed at 94,536.10, above the bottom of the range (at the 79% point of that day's range).
- Afterward: Jan 15 closed at 100,497.35, and on Jan 20 the high of 109,588 went 1.14% above the top of the range, but the close (102,260.01) was below the top.
One caveat: this range did break in the end, with a close of 88,680.40 on Feb 25, 2025, below the shakeout low. There is no guarantee that the rally after a shakeout will last, which is why you need confirmation such as a test and a break above the top of the range. Part 5 comes back to this.
Key Takeaways
- A shakeout pushes price quickly below support on wide candles and heavy volume, then closes back above it within 1–3 candles. I call it "shaking out the retail traders."
- There are two reasons it happens: to absorb stop-loss and liquidation supply cheaply below the low, and to lighten the load of riders before going higher.
- It appears in accumulation ranges after a decline (the terminal shakeout, in the same place as the spring) and in reaccumulation ranges during an uptrend.
- The name comes after the fact. At the moment of the break it looks the same as a breakdown, so you confirm it with the close back inside and the test.
In Part 2, we'll cover the 5-step rule for judging a shakeout with numbers, and how to tell it apart from a spring and a breakdown.
Measuring the range, the volume multiple and the return by hand for every market takes time. The Omnisight Report includes the Wyckoff structure for each market in its full analysis.
This lesson adapts the text, figures and live-stream quotes of the Trader Steve TA series for the web, translated from the original Korean. Check the text and figure captions for the timing and interpretation of each real example, and read conceptual diagrams and real charts separately.
Corrections: support@omnisight.report


