
What Is a Sign of Strength (SOS) in Wyckoff? Meaning and Why It Forms
Historical examples for learning · not current prices or trade recommendations.
Contents
After a long stretch of sideways trading, one day a single wide bullish candle carries heavy volume over the ceiling of the range. Wyckoff calls this a sign of strength (SOS). This lesson uses diagrams and a real Bitcoin (BTC) chart to show what an SOS is, where it appears in the accumulation process, why volume surges with it, and the three criteria for recognizing an SOS candle.
All dates and times are Korea Standard Time (KST, UTC+9). A daily candle is dated by its 09:00 KST open; intraday extremes are identified by their KST date and time.
1. The One-Line Definition: The First Proof That Demand Has Won the Accumulation Range
An SOS is a rally that proves buyers (demand) have beaten sellers (supply) inside an accumulation range. The candle's range (its spread) is wider than usual, volume rises, and price clears resistance at the top of the range on a closing basis.
It is the first moment the chart shows that the tight balance inside the range has tipped toward buyers, and it is the signature event of accumulation Phase D.
Some traders split this into the first strong rally toward the top from inside the range (the minor SOS) and the rally that closes above the top (the major SOS). This lesson focuses on the major SOS; Part 2 covers the distinction.
I use the name on the live stream too. Two days after Bitcoin broke out of its range, I summed it up while reading the Wyckoff section of an Omnisight Report.
"By ICT standards it's a long, and by Wyckoff standards it's a long too. The sign of strength (SOS) criterion has shown up." — Trader Steve, live stream, Aug 21, 2026 (translated from Korean) · ▶ Watch the stream highlights (Korean audio)
"A long" here means I read the structure at that point as bullish. An SOS is a name you give to a structure, not a button that says buy right here.
2. Where the SOS Sits in the Accumulation Process
An SOS doesn't appear out of nowhere. It comes after the footprints of accumulation have piled up one by one.
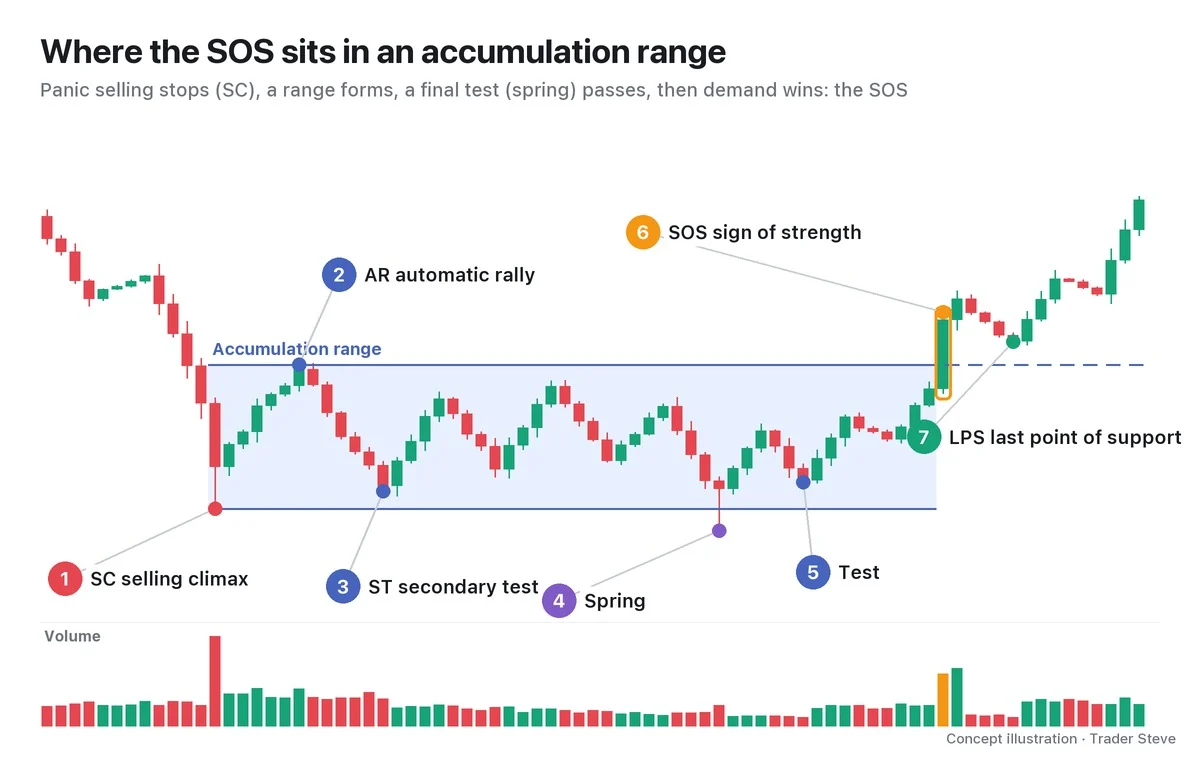
- SC (selling climax): capitulation at the end of a long decline. Volume hits its biggest spike, and the floor of the range forms.
- AR (automatic rally): the bounce after the panic selling has been absorbed. Its high becomes the top of the range.
- ST (secondary test): price tests the area near the floor again.
- Spring: price pokes briefly below the floor of the range and comes back.
- Test: price revisits the spring area on lighter volume to confirm it.
- SOS: a wide candle on heavy volume closes above the top of the range.
- LPS (last point of support): after the SOS, a pullback on lighter volume finds support near the old resistance.
Each event is defined in its own topic, Wyckoff Selling Climax (related lesson) and Wyckoff Spring (related lesson), and the full picture of the phases is in Wyckoff Accumulation Phases (related lesson). One thing to remember here: an SOS only means something if it rests on a prior cause, the footprints of accumulation such as an SC and a spring.
3. Why It Forms: Big Demand Arrives After Supply Has Dried Up
Early in a range, there is a lot of fearful dumping, so volume is heavy. As time passes and most of the people who wanted to sell have sold, volume shrinks in the later part of the range, and pushes lower no longer go as far as they used to.
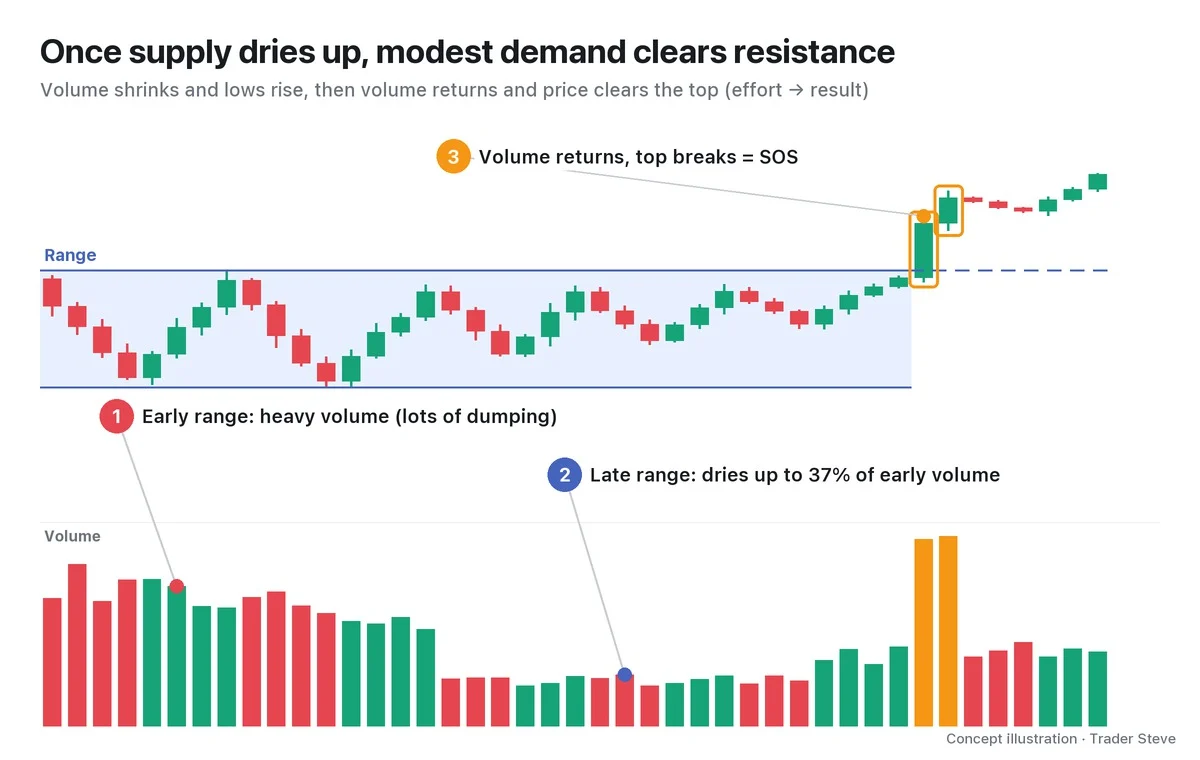
When big demand arrives at that point, the sell orders sitting at resistance are absorbed all at once and price is pushed higher. Wyckoff frames this as effort vs. result. An SOS is the moment when volume (effort) carries straight through into price progress (result). The principle is covered in detail in Wyckoff Effort vs. Result (related lesson) and Wyckoff Three Laws (related lesson).
Who creates that heavy volume? Watching Nvidia (a US stock) break out right after its earnings report, I said this:
"Look at that volume explode. The volume is just insane. The institutional guys are just scooping it up. … This massive volume isn't something retail traders can produce. Volume like this comes from institutions, not retail traders." — Trader Steve, live stream, Aug 27, 2026 (translated from Korean) · ▶ Watch the stream highlights (Korean audio)
That is why I read the volume on an SOS as "a footprint of big-player demand" (Basics Volume, basics/volume-basics).
4. What an SOS Candle Looks Like: Check Three Things Together
For the key candle of an SOS (the SOS candle), check these three things together.
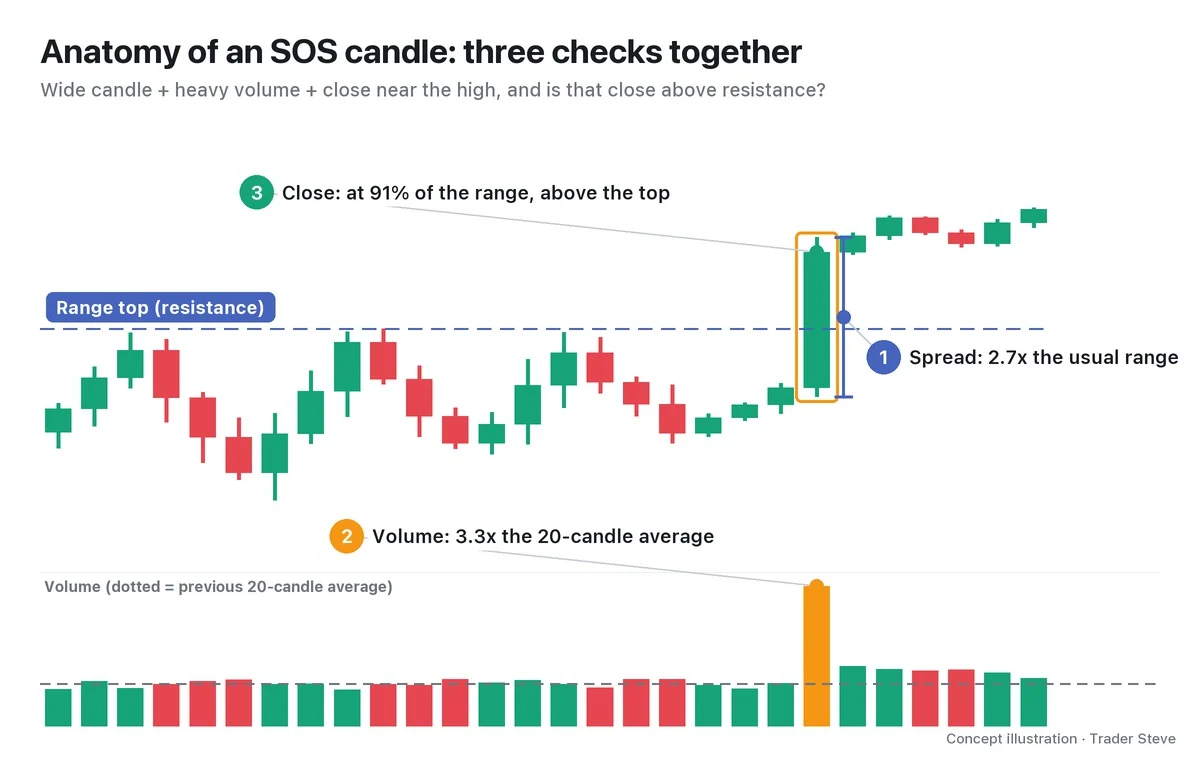
- Wide spread: the distance between the candle's high and low is clearly wider than usual.
- Heavy volume: this series measures it with relative volume (RVOL) = the candle's volume ÷ the average volume of the previous 20 candles. At 1.5x or more, volume counts as rising; at 2x or more, it counts as strong.
- A close near the high: close location = (close − low) ÷ (high − low) must be 0.6 or more, meaning the candle finishes in its upper part. A candle that only ran up with a long upper wick and was pushed back down tells you it ran into selling from above.
And all of this must end with a close above the top of the range. If price pokes through the top intraday but finishes back inside the range, it is not an SOS yet. With just one of these, it may simply be a bounce, or even a trap where size is handed off at the top (an upthrust after distribution (UTAD); Part 5).
5. Real BTC: October 2023, Above a Four-Month Range
Let's look at a scene on the real Bitcoin daily chart that can be read as an SOS. The event names are one interpretation, applied after the fact.
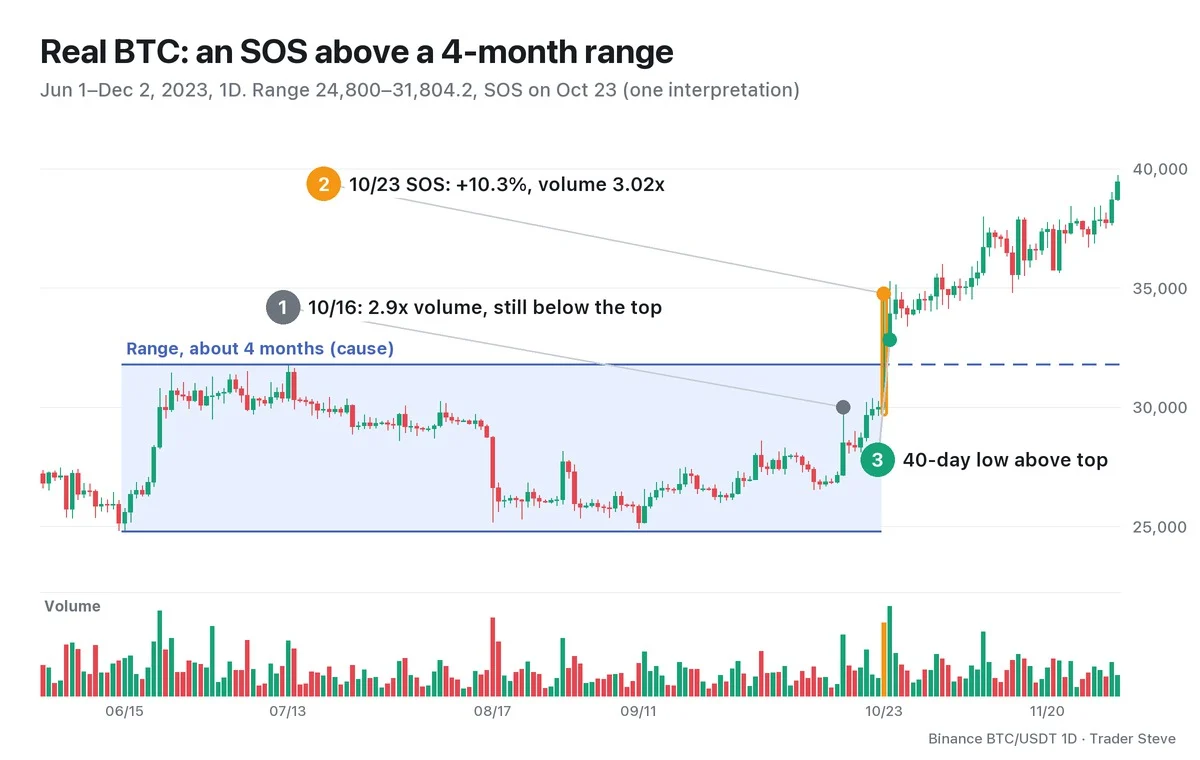
After its decline stopped at the 24,800 daily low on Jun 15, 2023, Bitcoin built a range for about four months (a height of about 28.2%), with the 31,804.2 high on Jul 13 as its ceiling. Volume shrank toward the later part of the range: average daily volume in September was about 58% of June's.
The Oct 16 daily candle reached a high of 30,000 on volume 2.9x the previous 20-day average, but it was pushed back to close at 28,500.8 and never even touched the top of the range (①). It is a small example of why heavy volume alone does not make an SOS.
A week later, the Oct 23 daily candle was different (②). It rose 10.3%, from an open of 29,992.5 to a close of 33,070.0, with a candle range of 16.2% of the open and volume 3.02x the previous 20-day average. Its close location was 0.66, in the upper part of the candle, and it was the first close above the top of the range since the range began.
Over the next 40 days, the lowest price was the 32,832.3 low on Oct 24; price never once came back below the top of the range (③). The absence of any fall back into the range supports this interpretation. Still, this is a look back at a past chart; it does not mean a similar shape will lead to the same result.
Key Takeaways
- An SOS (sign of strength) is a rally that serves as the first proof that demand has beaten supply in an accumulation range.
- It only means something if it rests on a prior cause, such as an SC and a spring.
- It forms when big demand arrives after supply has dried up: volume (effort) carrying through into price progress (result).
- For an SOS candle, check a wide candle + heavy volume (RVOL) + a close near the high, plus a close above the top of the range, all together.
- An SOS is a beginning, not an end. It is confirmed when a lighter-volume pullback (the LPS) holds (Wyckoff Last Point of Support, wyckoff/lps).
In Part 2, we'll cover the criteria that separate a minor SOS from a major SOS, which line price has to clear to count as an SOS, and a checklist for identifying one.
Measuring the range, volume and close location by hand for every market takes real time. If you want an analysis that pulls several theories together in one place, see the report below.
This lesson adapts the text, figures and live-stream quotes of the Trader Steve TA series for the web, translated from the original Korean. Check the text and figure captions for the timing and interpretation of each real example, and read conceptual diagrams and real charts separately.
Corrections: support@omnisight.report


