
What Is a Sign of Weakness (SOW) in Wyckoff? Meaning and Why It Forms
Historical examples for learning · not current prices or trade recommendations.
Contents
At the end of a range, a single wide bearish candle carries heavy volume straight through the floor of the range. Wyckoff calls this a sign of weakness (SOW). This lesson covers what an SOW is, where it appears in the distribution process, why it shows up as a wide, heavy candle, and the four criteria for recognizing an SOW candle.
All dates and times are Korea Standard Time (KST, UTC+9). A daily candle is dated by its 09:00 KST open; intraday extremes are identified by their KST date and time.
1. The One-Line Definition: The First Proof That Supply Has Won the Distribution Range
An SOW is a decline that proves sellers (supply) have beaten buyers (demand) inside a distribution range. The candle's range (its spread) is wider than usual, volume rises, the candle closes in its lower part, and price breaks the support line at the bottom of the range on a closing basis. It is the signature event of distribution Phase D.
Some traders split this into a sharp drop toward the bottom that still closes inside the range (the minor SOW) and a drop that closes below the bottom (the major SOW). The criteria vary slightly from book to book; Part 2 covers how this series draws the line.
An SOW is the upside-down version of the sign of strength (SOS) that appears in accumulation. Side by side, they line up like this.
| Accumulation (preparing to go up) | Distribution (preparing to go down) |
|---|---|
| SOS, sign of strength: closes above the top of the range | SOW, sign of weakness: closes below the bottom of the range |
| Creek: the resistance line price has to clear | Ice: the support line that must not break |
| LPS (last point of support): a lower-volume pullback holds above the old resistance | LPSY (last point of supply): a lower-volume bounce stalls below the old support |
The SOS side is covered in the Wyckoff Sign of Strength topic (related lesson). And an SOW is a name you give to a structure, not a button that says short right here.
2. Where the SOW Sits in the Distribution Process
An SOW comes after the footprints of distribution have piled up one by one.
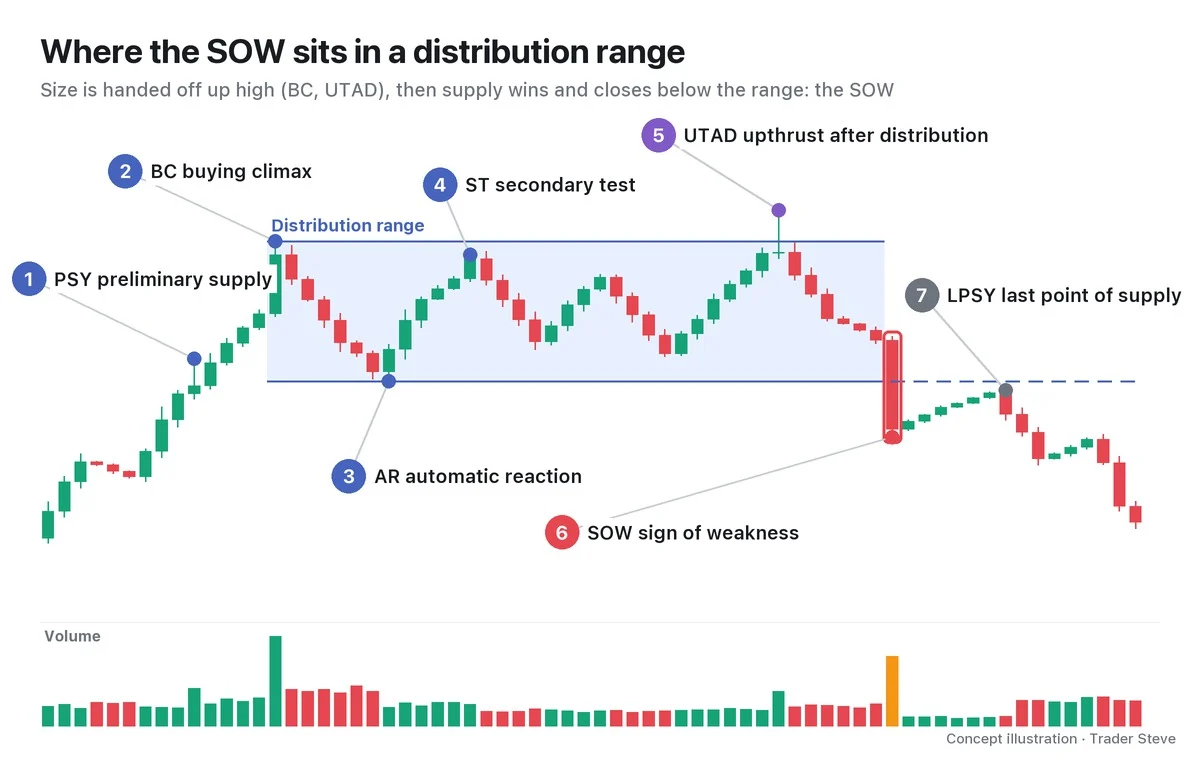
- PSY (preliminary supply): the first noticeable selling during the advance.
- BC (buying climax): the top, where chasing buyers and volume pile in the most.
- AR (automatic reaction): the drop once buying is exhausted. Its low becomes the bottom of the range.
- ST (secondary test): price tests the area near the top again but fails to clear it.
- UTAD (upthrust after distribution): price pokes briefly above the top and comes back.
- SOW: price closes below the bottom of the range.
- LPSY (last point of supply): a weak bounce stalls below the old support.
Each event is defined in its own topic, Wyckoff Buying Climax (related lesson) and Wyckoff UTAD (related lesson), and the full picture of the phases is in Wyckoff Distribution Phases (related lesson). One thing to remember: an SOW only means something if it rests on a prior cause, the footprints of distribution such as a BC and a UTAD. A decline without those footprints may just be a pullback.
3. Why It Forms: Size Has Been Handed Off, and the Demand Holding the Floor Disappears
A distribution range is where the big players hand off their size at high prices. While talking about semiconductor stocks, I described the order in which a downside structure forms.
"If the fundamentals of this market were really weakening over the long term, the picture wouldn't be price getting pushed down below here, like now, and then collapsing from there. The big players have to offload more size onto more retail traders and get out safely, so you can get a structure where they hand off all their size at a level like this, where price has run up more than you'd expect, and only then does the market go down." — Trader Steve, live stream, Aug 22, 2026 (translated from Korean) · ▶ Watch the stream highlights (Korean audio)
Once all that size has been handed off, the big demand that was holding up the bottom of the range is gone. What happens when support breaks in that state?
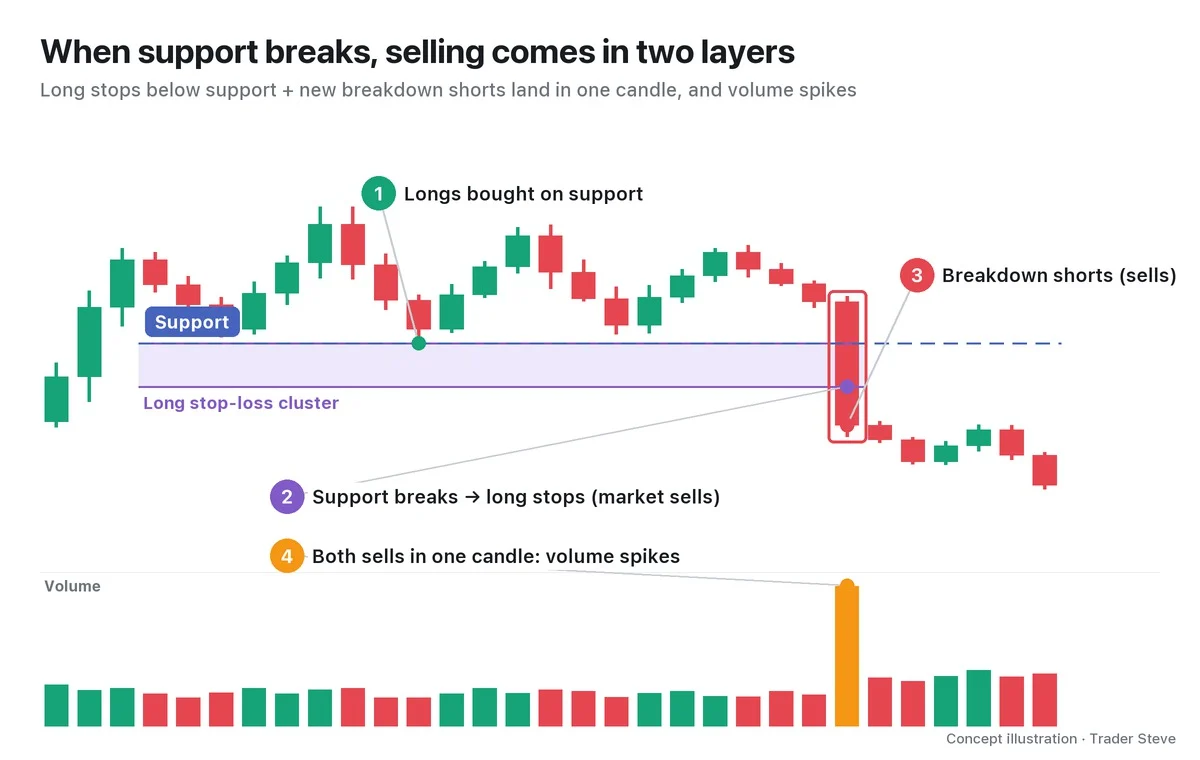
On a day Bitcoin (BTC) was falling sharply, I broke that moment down like this.
"The moment price breaks this and drops, what do you see? Once this breaks, the next thing in view is down here. … So lots of people short here, and lots of people who were long here get stopped out. Add the longs getting stopped out to the people shorting, and the selling pressure to the downside goes up two, three times, right?" — Trader Steve, live stream, Oct 16, 2026 (translated from Korean) · ▶ Watch the stream highlights (Korean audio)
That is why an SOW candle is wide and heavy. In Wyckoff terms, this is effort vs. result: selling volume (effort) carries straight through into a price decline (result) (see Wyckoff Effort vs. Result, wyckoff/effort-result). For reference, I don't use the name SOW on the live stream; I say things like "a break below the reference line" or "broken by a large bearish candle, then a failed retest."
4. What an SOW Candle Looks Like: Check Four Things Together
For the key candle of an SOW (the SOW candle), check these four things together.
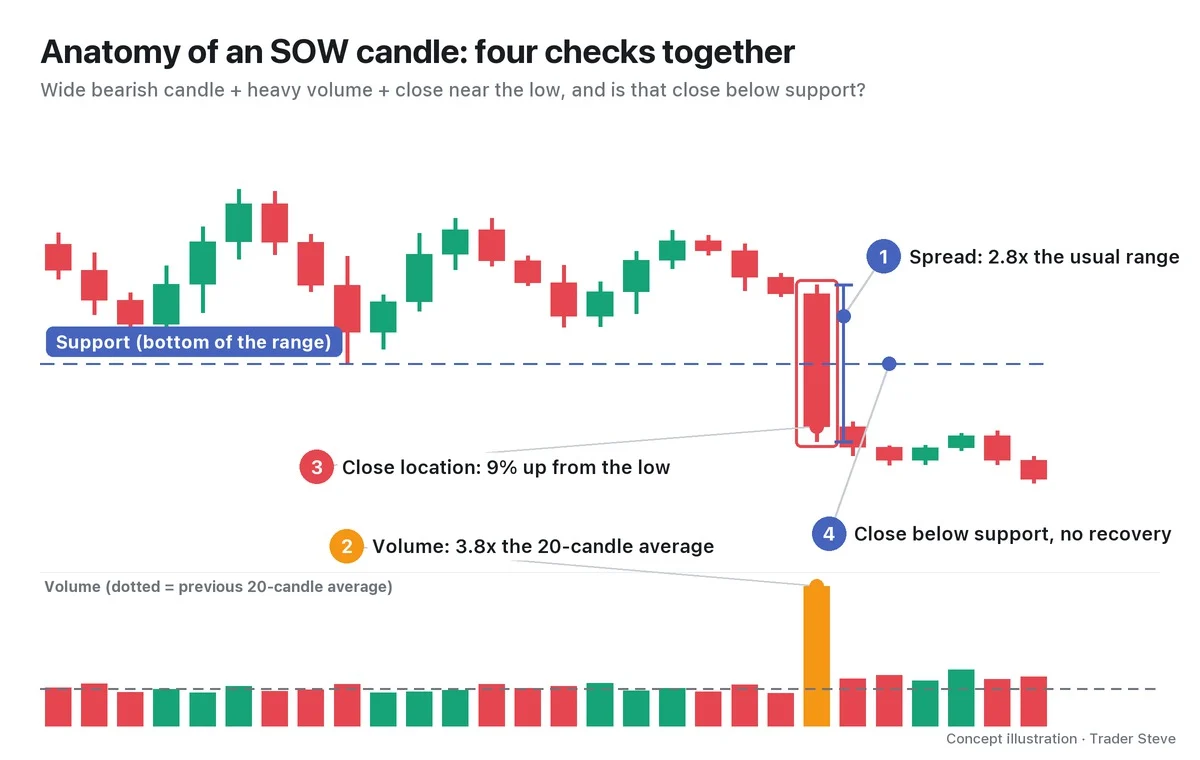
- Wide spread: the distance between the candle's high and low is wider than usual.
- Heavy volume: relative volume (RVOL) = the candle's volume ÷ the average of the previous 20 candles. At 1.5x or more, volume counts as rising; at 2x or more, it counts as strong.
- A close near the low: close location = (close − low) ÷ (high − low) must be 0.4 or less. A long lower wick means some buyers stepped in to absorb the selling.
- A close below support: if price only pokes below intraday and finishes back inside the range, it is not an SOW yet. The close has to be below the line, and price must not return within a few days.
With just one of these, it may simply be a correction, or a trap that shakes out the lows and then rises (a spring) (see Basics Volume, basics/volume-basics).
5. Real BTC: May 2022, the Day Price Closed Below the Range
Here is a scene on the real Bitcoin daily chart that can be read as an SOW. The event names are one interpretation, applied after the fact.
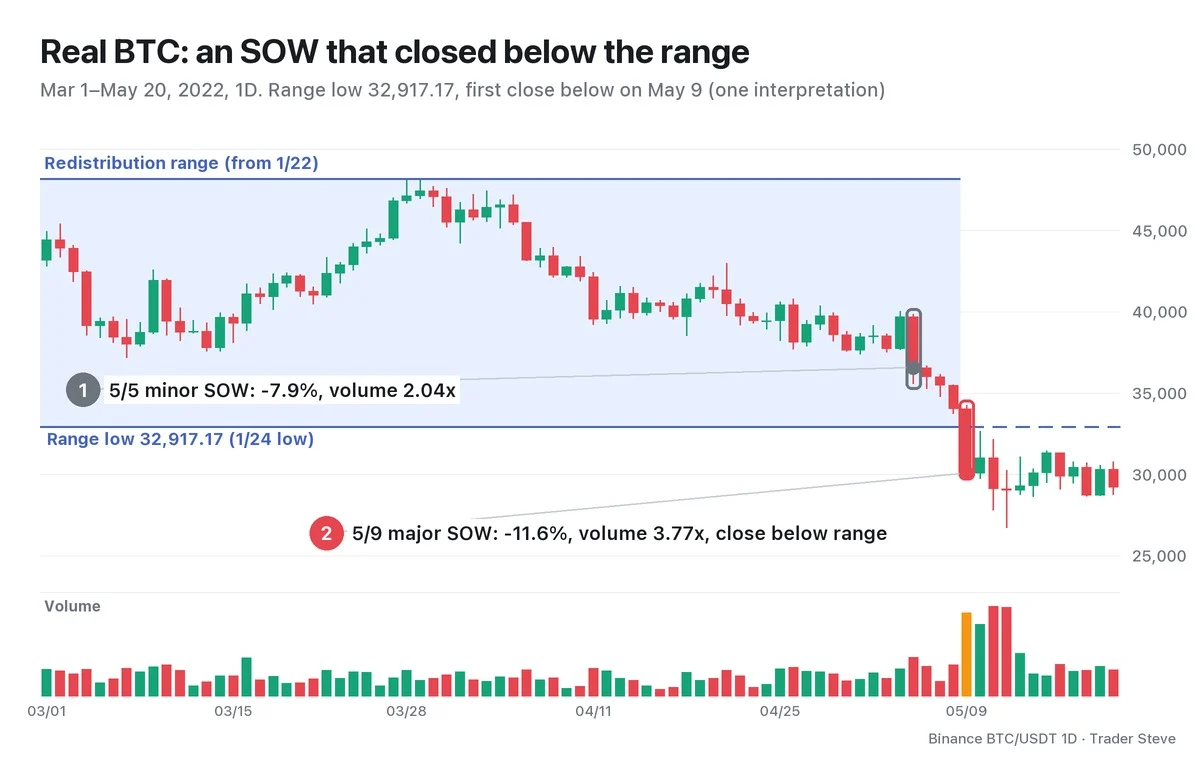
Bitcoin built a range for about three months between the 32,917.17 low on Jan 24, 2022 and the 48,189.84 high on Mar 28. Since a large decline had already come before it, strictly speaking this is a redistribution range, where size is handed off again in the middle of a downtrend (see Wyckoff Redistribution, wyckoff/redistribution).
The May 5 daily candle fell 7.9% on volume 2.04x the previous 20-day average, with a close location of 0.23 (①). But its 36,552.97 close was still inside the range, so I read it as a minor SOW.
The May 9 daily candle was different (②). It fell 11.6%, from an open of 34,038.39 to a close of 30,076.31. Its range was 12.4% of the open, 2.7x the average range of the previous 20 days, and volume was 3.77x. With a close location of 0.01, it finished almost at its low, and the close was 8.63% below the bottom of the range. It was the first day since the range formed that price closed below the bottom.
Over the next 40 days, price never once closed back above the bottom of the range, and the bounce highs, 32,658.99 on May 10 and 32,399.0 on May 31, both stopped below it. This is only a look back at a past chart; a similar shape does not guarantee the same result.
In this series, a minor SOW means weakness inside the range, and a major SOW means a close below a clearly stated ice line, with follow-through confirmed afterward. A single wick below the line, or a close that soon returns inside, is treated separately as a warning or a candidate.
BTC on May 9, 2022 and Ethereum (ETH) on Aug 4, 2024 are shared cases that also appear in the Ice and Redistribution topics. This lesson asks about the candle range, volume and close that confirm weakness; the Ice lessons ask about the retest of broken support; and the Redistribution lessons ask about a range inside a prior downtrend.
Key Takeaways
- An SOW (sign of weakness) is a decline that serves as the first proof that supply has beaten demand in a distribution range.
- It only means something if it rests on a prior cause, such as a BC and a UTAD.
- When support breaks after size has been handed off, long stop-losses and new shorts land in the same candle, so the candle is wide and volume is heavy.
- For an SOW candle, check a wide bearish candle + heavy volume (RVOL) + a close near the low + a close below support, all together.
- An SOW is a beginning, not an end. It is confirmed by an LPSY, a lower-volume bounce that stalls below the old support (see Wyckoff Last Point of Supply, wyckoff/lpsy).
In Part 2, we'll cover the criteria that separate a minor SOW from a major SOW, how to choose the support line, and a checklist for identifying an SOW.
Measuring the range, volume and close location by hand for every market takes real time. If you want an analysis that pulls several theories together in one place, see the report below.
This lesson adapts the text, figures and live-stream quotes of the Trader Steve TA series for the web, translated from the original Korean. Check the text and figure captions for the timing and interpretation of each real example, and read conceptual diagrams and real charts separately.
Corrections: support@omnisight.report


