What Is a Spring in Wyckoff? Meaning and Why It Forms Below Support
Historical examples for learning · not current prices or trade recommendations.
Contents
Price has been crawling sideways at the bottom, then it drops through the floor of the range. You think "so it's finally breaking down" and take your stop-loss — and right after, price is back inside the range. Wyckoff theory calls this move a spring. This lesson covers what a spring is, where it appears, why it forms just below support and why it is read as a strong signal, using diagrams and a real Bitcoin (BTC) chart.
All dates and times are Korea Standard Time (KST, UTC+9). A daily candle is dated by its 09:00 KST open; intraday extremes are identified by their KST date and time.
1. One-Line Definition: A Brief Break Below the Range, Then a Close Back Inside
A spring is a move that briefly breaks the bottom of an accumulation range (support) and quickly returns inside the range. The name comes from a coil spring that bounces back up when you press it down and let go.
Two words matter here.
- Briefly: price comes back within the same candle, or within a few candles at most.
- On a close: a lower wick alone is not enough. Price counts as "back" only when the candle closes above support again.
If candles keep closing below the range, it may be a breakdown, not a spring (Parts 2 and 3).
2. Where It Appears: The Final Test in Phase C of Accumulation
A spring is not a shape that can show up anywhere. It has a set place inside the Wyckoff accumulation structure.
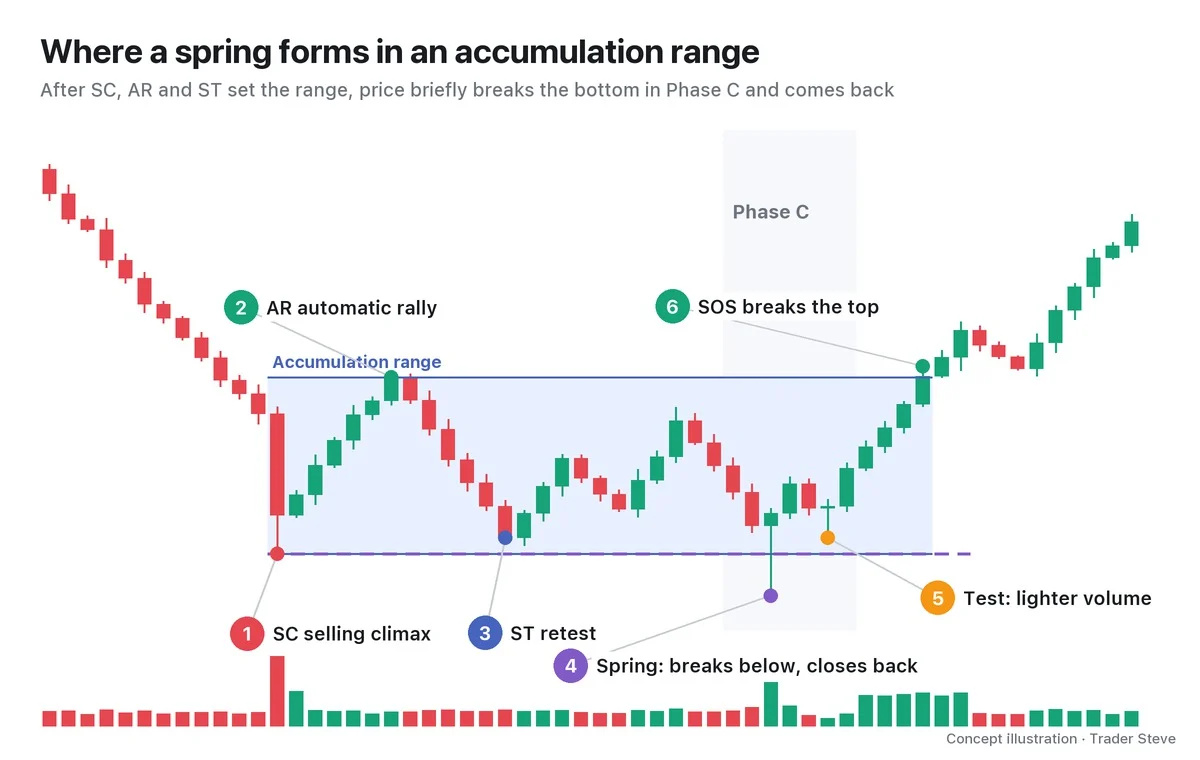
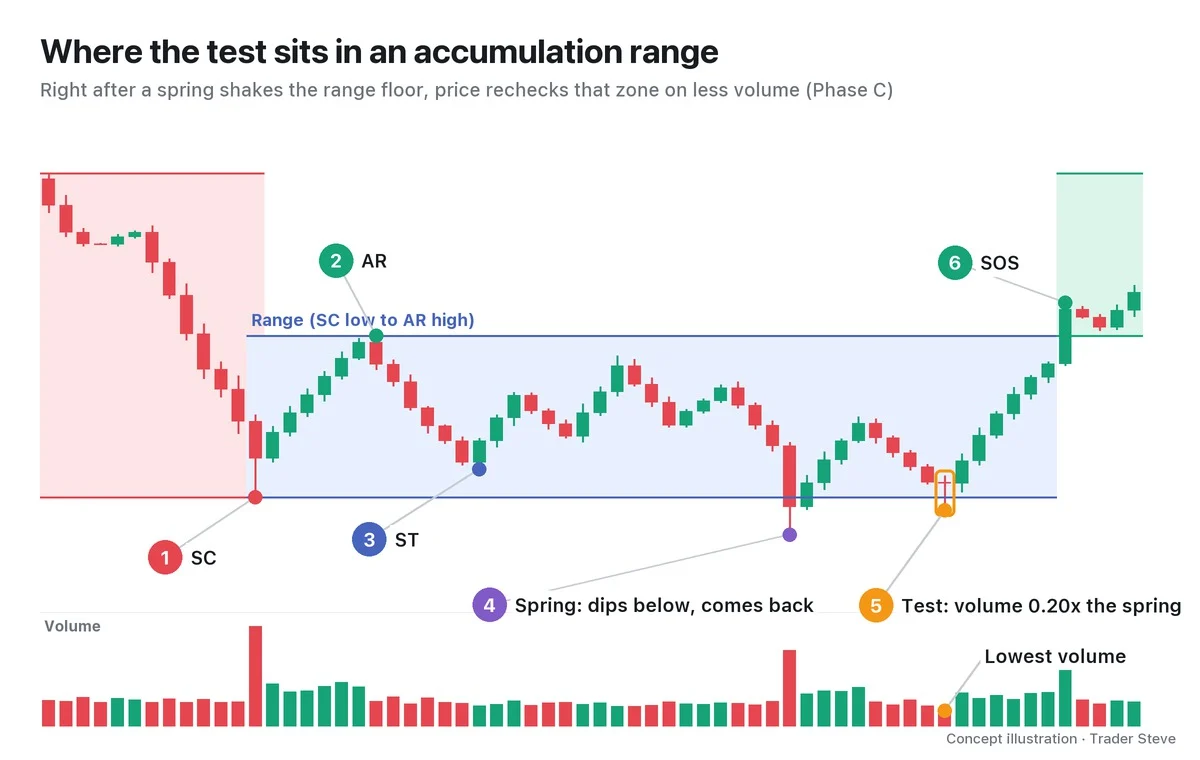
- Selling climax (SC): panic selling on exploding volume. A candidate for the floor of the range.
- Automatic rally (AR): the bounce that happens on its own after the panic selling. It becomes the ceiling of the range.
- Secondary test (ST): price revisits the area near the SC on lighter volume.
Once the range forms (Phase A) and supply changes hands inside it (Phase B), the spring is the one more poke below the bottom in Phase C. It is the final check that tests how much selling supply is left.
Some accumulations finish their test at a higher low without breaking the bottom of the range (Schematic #2; see Wyckoff Accumulation Phases and Wyckoff Last Point of Support).
3. Why Right Below Support?
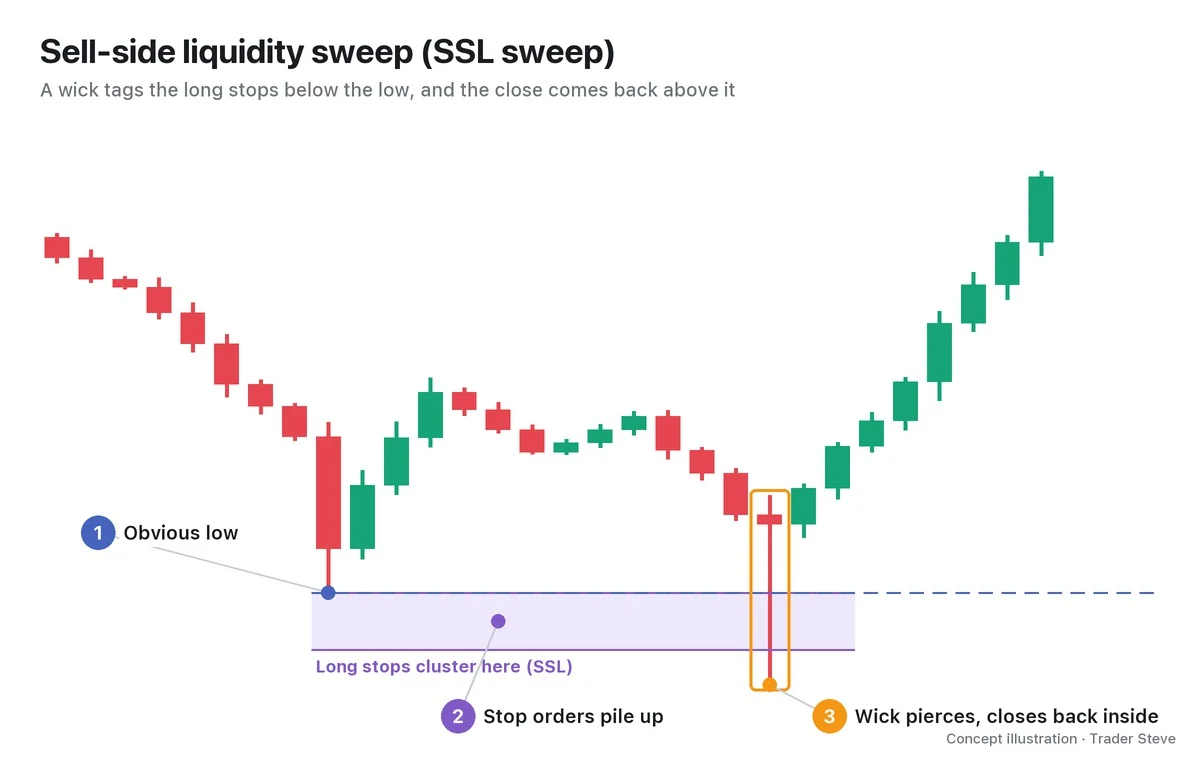
Anyone who looks at charts can see the bottom of a range. That is why two kinds of orders gather just below it.
- Stop-loss orders: sell orders from people who bought inside the range and decided "if this breaks, I'm out"
- Breakdown short orders: new sell orders waiting for "once support breaks, the drop begins"
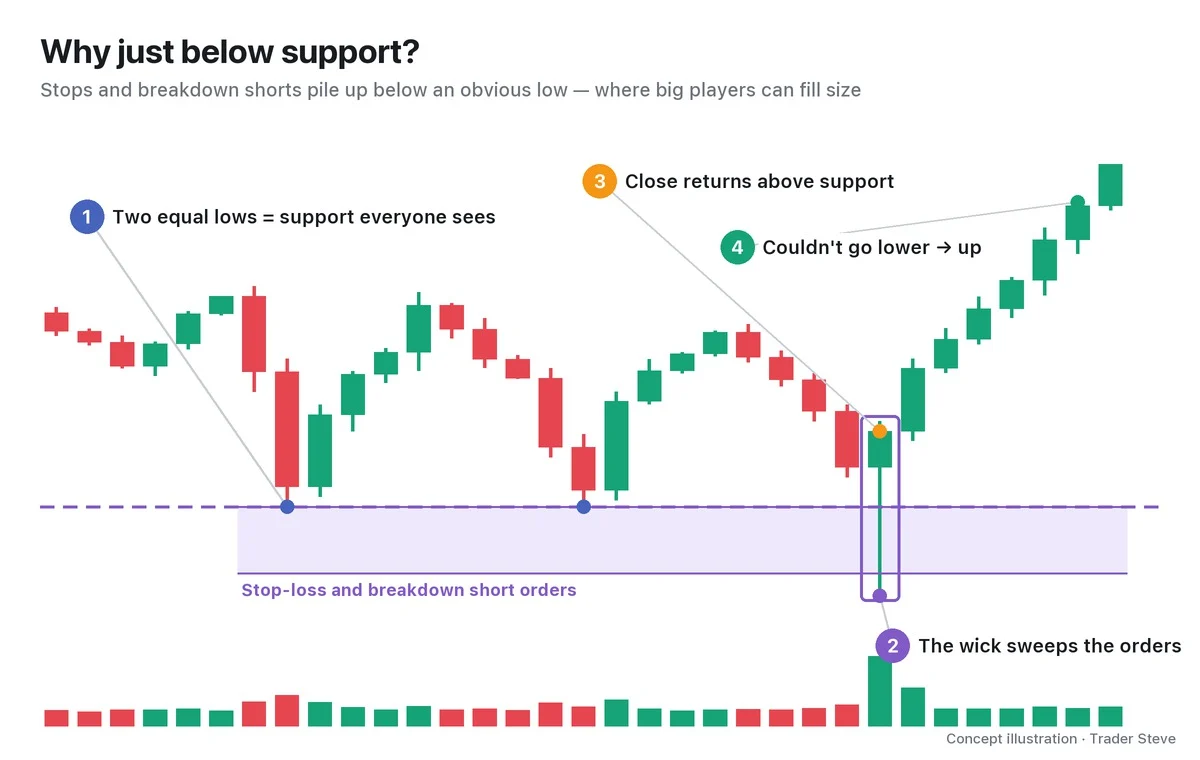
For a big player who wants to buy a lot of size (Wyckoff's "Composite Man"), this is a welcome spot. The flood of sell orders when support breaks is liquidity that can be absorbed in one go. In ICT terms, it is where sell-side liquidity (SSL) gets swept.
Round numbers (clean figures like 100 or 100,000) amplify this psychology. In a live stream, I explained it like this while looking at the chart of SOXL, a 3x leveraged US semiconductor exchange-traded fund (ETF).
"A moment ago, when $100 broke, my nerves were really shaken too. … This spot where $100 breaks could be the last shakeout of small traders … It's a very round number, so falling from $100 to below it means the leading digit changes, right? That's bound to do huge damage psychologically. That's why I thought small traders would get shaken out here in huge numbers." — Trader Steve, live stream, Sep 4, 2026 (translated from Korean) · ▶ Watch the stream highlights (Korean audio)
The moment the leading digit changes, people dump their positions — and a spring is the scene where someone takes that supply.
4. Why It Is Read as a Strong Signal: Pushed Down, but Couldn't Go Further
When support breaks, stops and shorts fire all at once, so price should normally slide a long way. In a spring, though, price absorbs all that selling and still returns inside the range.
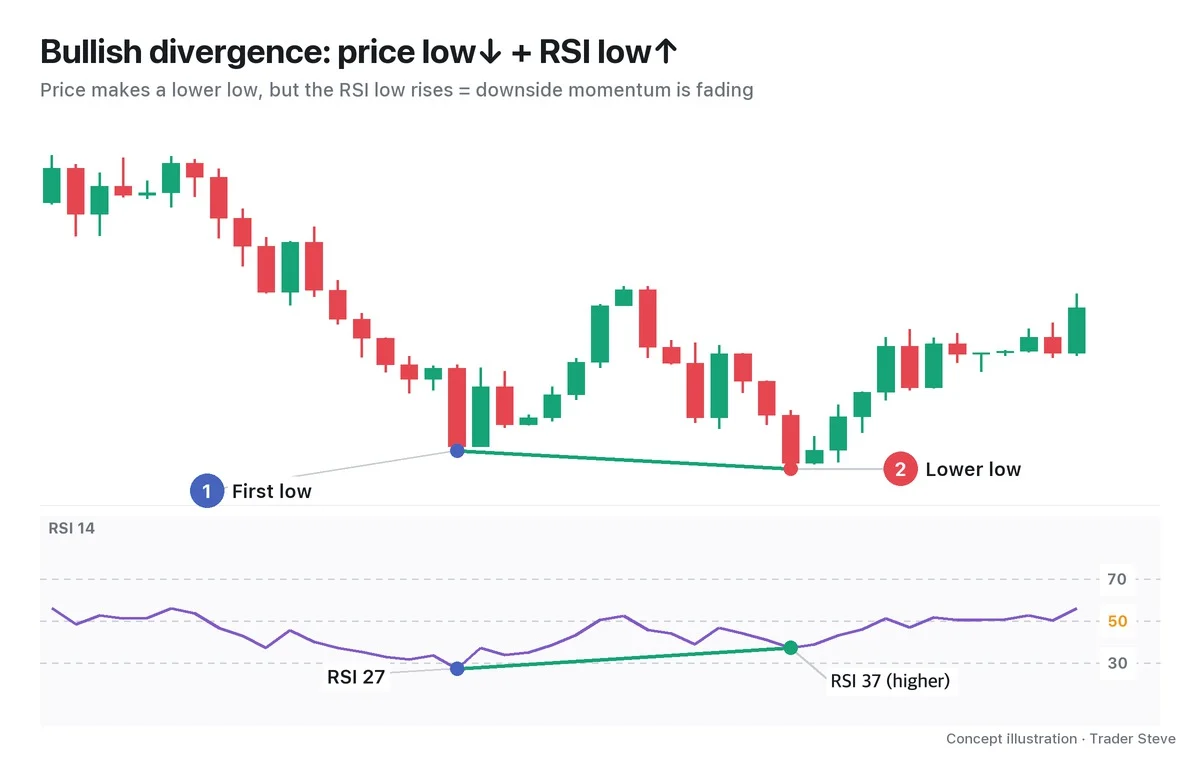
It means everyone who wanted to sell has sold, and buyers were waiting below to take that supply. If price used up its last push and still couldn't go lower, there is a good chance the remaining supply has dried up.
"If it puts in a rough double bottom here, and like this … it tries to push down but fails and bounces back up, that's the spot where it completely eats up the downward momentum and the trend reverses, so … far more often than not, it leads to a sharp bounce." — Trader Steve, live stream, Aug 28, 2026 (translated from Korean) · ▶ Watch this moment (Short, Korean audio)
"Far more often" is my experience, not a fixed probability. A spring is a candidate for evidence that supply has dried up, and you confirm it step by step with the test and a break above the top of the range (SOS).
5. Real BTC: June 2025, Support Broke and Price Came Back the Same Day
Let's look at a real Bitcoin daily chart. The numbers were recalculated from Binance prices, and the range and spring markings are my interpretation (daily candles are dated by the candle that opens at 09:00 KST).
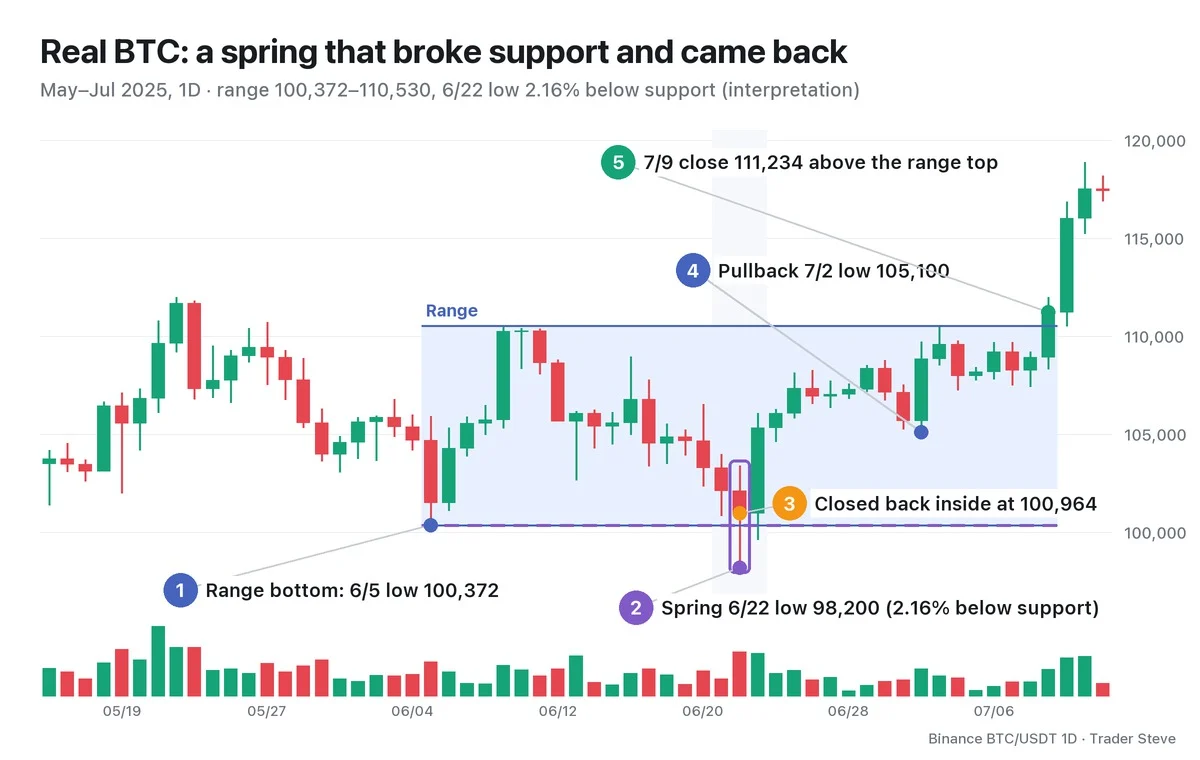
- Range: the Jun 5 low of 100,372 is the bottom and the Jun 9 high of 110,530 is the top (a height of 10.12%). The May 22 high of 111,980 came before the range, so I set it aside.
- Spring: the Jun 22 daily candle broke the bottom and fell as low as 98,200. That is 2.16% below support.
- Return: but that day's close was 100,964, back inside the range. The next day, Jun 23, closed at 105,334.
- Pullback: a low of 105,100 on Jul 2. It stopped 7.03% above the spring low, on 0.62x the spring candle's volume.
- Break above the top: the Jul 9 close of 111,234 was the first close above the top of the range, and the Jul 10 close was 116,010.
"Broke → came back the same day → stopped higher on the way back down → above the range." That is almost exactly the textbook sequence. Zoom this one day in on the 4-hour chart, though, and the mood is completely different.
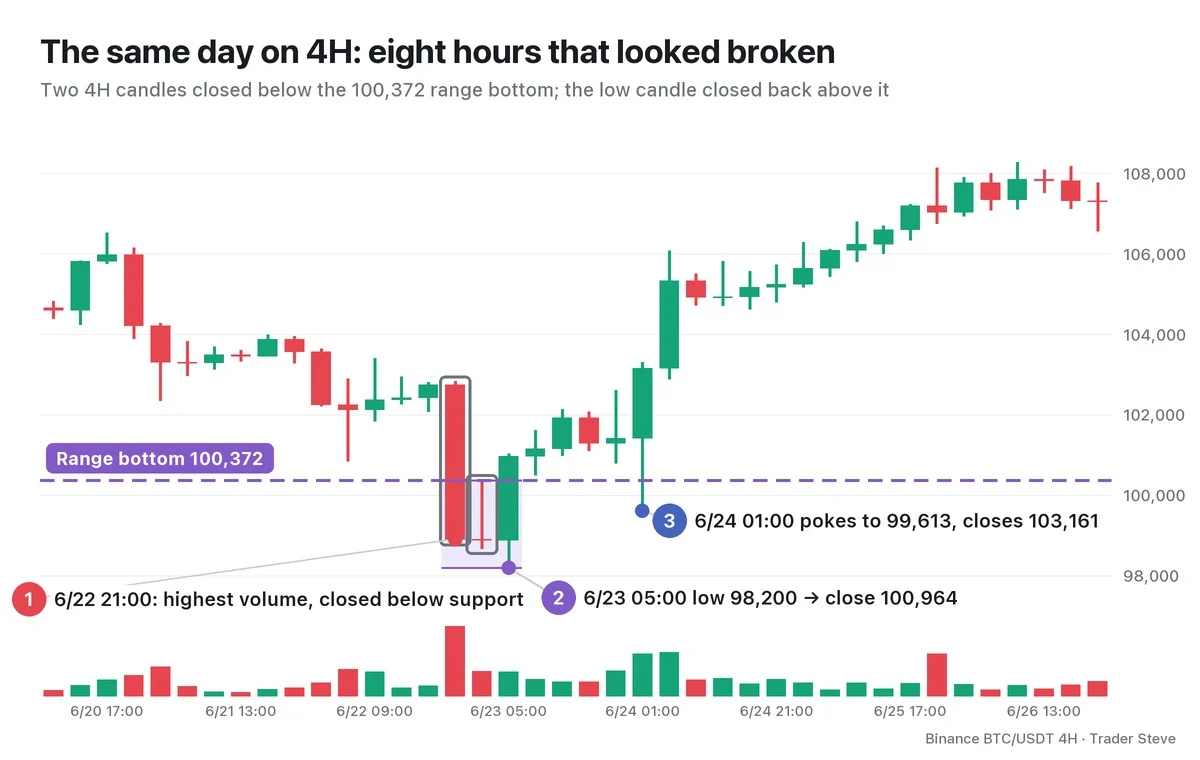
The Jun 22 21:00 candle closed at 98,906 on the highest volume of this stretch, and the next candle closed at 98,883. For eight hours, the chart looked "broken" to anyone. But the Jun 23 05:00 candle hit 98,200 and closed at 100,964, so the daily close stayed inside the range. Even when price poked down to 99,613 once more at 01:00 on Jun 24, that candle closed at 103,161.
"When it broke down out of the channel, I thought (it was over), but it came back inside." — Trader Steve, live stream, Aug 25, 2026 (translated from Korean) · ▶ Watch the stream highlights (Korean audio)
That was about different tickers (SOXL and KORU), but the psychology is the same. When support breaks, it looks like it's over, and that is what brings out the selling.
Springs come in types, too. Wyckoff divides springs into Types 1, 2 and 3 by depth and volume. The textbooks don't set numbers, so this series sets its criteria using depth relative to the range height and volume relative to the 20-candle average (rv20, the relative volume multiple). The Jun 22 spring had a depth of 21.4% of the range height and volume at 2.00x the 20-candle average, which makes it Type 2 by this series' criteria. Part 2 compares the criteria and the other types on real charts.
BTC June 2025: Shared Range Cross-Check
| Period · timeframe · interpretation | SC/buying climax (BC) · AR | Bottom–top · updates | Confirmation |
|---|---|---|---|
| Jun–Jul reaccumulation after the May high; small range on the daily chart | Mid-uptrend range with no separate SC; a boundary high is used instead of an AR | 6/5 100,372–6/9 110,530 | 6/22 98,200 spring candidate, then a 7/9 close above the top |
| Large cycle range, weeks of 5/19–11/3 | The whole phase, not individual SC/AR events | Extended to 6/22 98,200–week of 10/6 126,200 | Decline confirmed in the week of 11/10 |
The same 6/22 low is a reaccumulation spring in the small range and the bottom of the distribution range in the large one (see Wyckoff Reaccumulation Part 1 and Wyckoff Market Cycle Part 1). The SC → AR → ST accumulation sequence that ends a downtrend is not applied as a requirement for this small range.
Key Takeaways
- A spring is a move that briefly breaks the bottom of an accumulation range and returns inside it on a close.
- Its place is Phase C of accumulation: the final test after SC, AR and ST have formed the range.
- The stop-loss and breakdown short orders stacked just below support become the liquidity big players use to fill size.
- "Pushed down, but couldn't go further" is a candidate for evidence that supply has dried up, confirmed by the test and the SOS.
In Part 2, we'll cover a checklist for identifying springs and how to classify them as Type 1, 2 or 3 by depth and volume, using real charts.
Measuring the range, support and volume multiple by hand for every market takes time. The Omnisight Report lays out this kind of Wyckoff structure for each market.
This lesson adapts the text, figures and live-stream quotes of the Trader Steve TA series for the web, translated from the original Korean. Check the text and figure captions for the timing and interpretation of each real example, and read conceptual diagrams and real charts separately.
Corrections: support@omnisight.report