
What Is a Secondary Test (ST) in Wyckoff? Meaning and Why It Forms
Historical examples for learning · not current prices or trade recommendations.
Contents
After a long decline, a wave of panic selling hits and price bounces hard. Many traders conclude, "That's the bottom." But the chart usually comes back down soon after and touches that bottom area one more time. Wyckoff calls this pullback the secondary test (ST). This lesson uses diagrams and a real Ethereum (ETH) chart to show what an ST is, why it forms, and what you check when it happens.
All dates and times are Korea Standard Time (KST, UTC+9). A daily candle is dated by its 09:00 KST open; intraday extremes are identified by their KST date and time.
1. The One-Line Definition: The Same Price, Checked Again on Less Volume
An ST is the move in which, after a selling climax (SC) and an automatic rally (AR), price comes back down to the SC price zone to check whether there is still supply left to dump.
An ideal ST has two visible traits.
- Volume and candle spread are smaller than at the SC. It is the same price zone, but trading is much quieter.
- It stops above the SC low (or very close to it). Price does not collapse a second time.
On a live stream, while looking at the chart of a different market (a leveraged US semiconductor exchange-traded fund, or ETF), I once described this process like this.
"Unless price breaks back below this level … this whole process of coming back down is what people call the small-trader test, the secondary test — the process of shaking out small traders." — Trader Steve, live stream, Sep 4, 2026 (translated from Korean) · ▶ Watch the stream highlights (Korean audio)
The first part is the key. As long as price does not break back below the SC low, this pullback is read not as the decline resuming but as a test that shakes out the remaining supply.
2. SC → AR → ST: Both Ends of the Range Are Set and Phase A Ends
An ST never appears on its own. Two events always come before it.
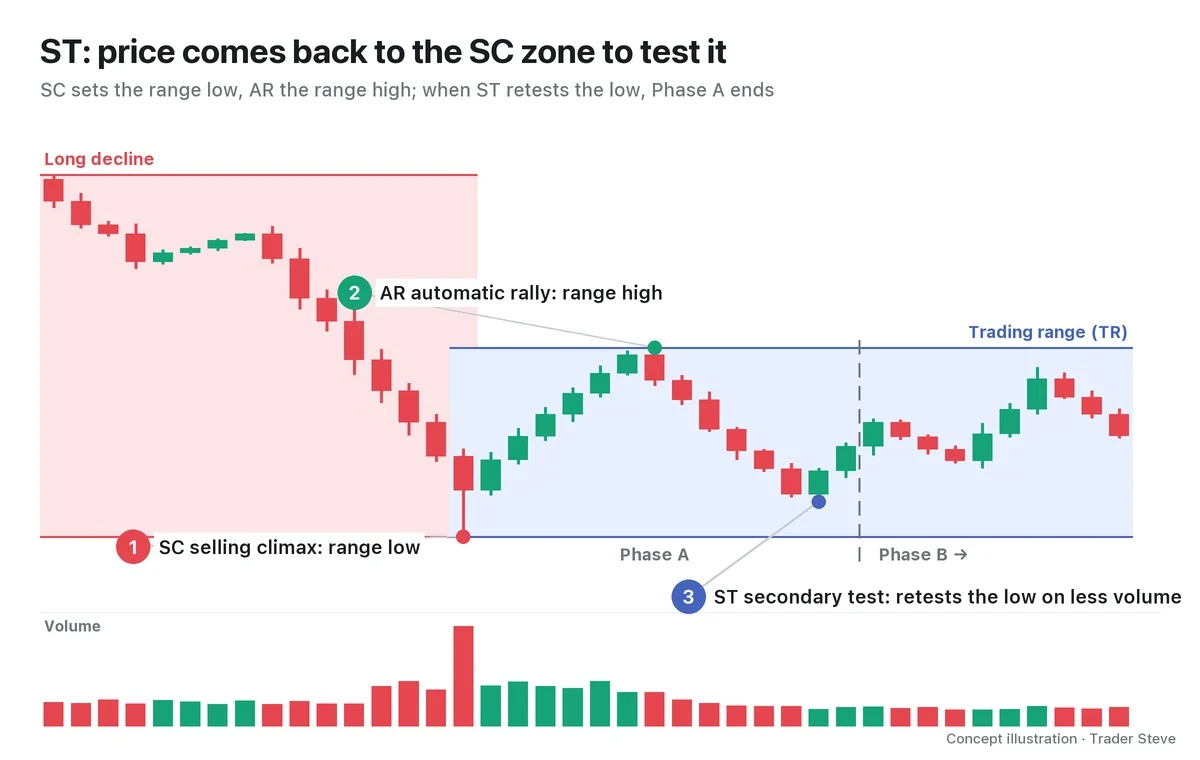
- SC (selling climax): the panic selling that erupts on peak volume at the end of a long decline. Its low becomes the bottom of the range. (Details in the Wyckoff Selling Climax topic.)
- AR (automatic rally): the bounce that jumps up once the panic is over and selling dries up. Its high becomes the top of the range. (See the Wyckoff Automatic Rally topic.)
- ST (secondary test): price comes back down to the SC price zone and tests the bottom.
The range formed between the SC low and the AR high is called the trading range (TR). In the Wyckoff accumulation phases, PS (preliminary support), SC, AR and ST make up Phase A (the phase where the decline stops), and Phase A ends when the first ST is complete. From there, the market moves into Phase B, where it builds a cause inside the range, and the ST can repeat several times rather than just once (Part 2). The full map of the phases is in the Wyckoff Accumulation Phases topic.
3. Why Price Comes Back Down: Testing the Remaining Supply and Big Players Buying Again
Why would price that jumped so hard on the AR bother to come back down? There are two explanations.
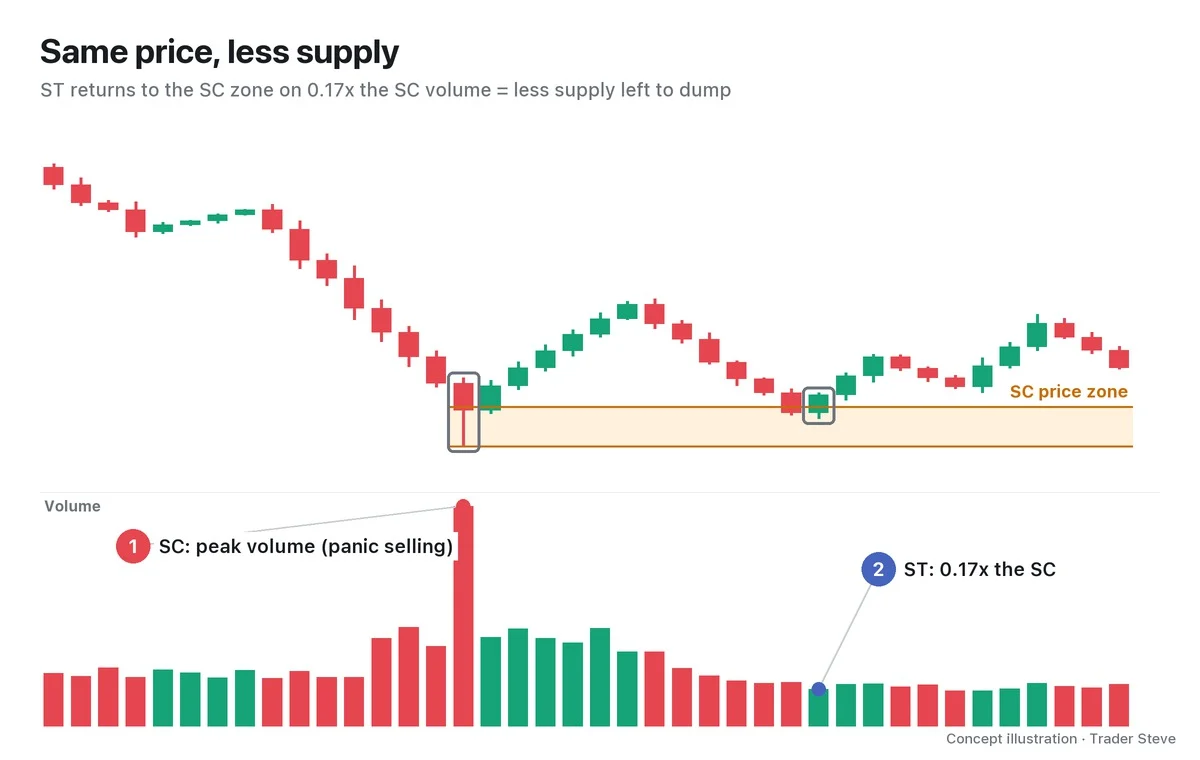
First, it tests the remaining supply. Most of the people who panicked at the SC have already sold. But you only find out how many holders are still left by going back to the same price zone. If volume spikes again, there are still plenty of sellers; if volume has dropped sharply, very few sellers are left.
Second, the big players come back to buy the size they couldn't fill. On the same stream, I added this.
"And then it comes back down. Why? The big players wanted to buy a lot here. … They wanted to load up a lot of buying right here. But nobody's selling. … When they sweep up the buying here, someone has to sell to them for them to buy, and they couldn't buy much here. So it came back down to fill more buying here." — Trader Steve, live stream, Sep 4, 2026 (translated from Korean) · ▶ Watch the stream highlights (Korean audio)
When there are many buyers but no one to sell to them, price runs up before they can buy as much as they want. In this reading, the ST is the process of pulling price back down to a lower level to absorb more supply. To be clear, this "intent of the big players" is a personal interpretation, not a fact the chart can prove. What the chart can confirm is whether volume shrank at the same price zone. (For the big players' point of view, see the Wyckoff Composite Man topic.)
4. What to Watch at the ST: Volume, Candle Spread and Where the Low Forms
There are three things to check at an ST.
| What to check | Strong ST | ST to reconsider |
|---|---|---|
| Volume | Clearly smaller than at the SC | Equal to or larger than at the SC |
| Candle spread | Narrower and calmer than at the SC | Long, rough candles keep printing |
| Where the low forms | Stops above the SC low (or very close to it) | Closes below the SC low |
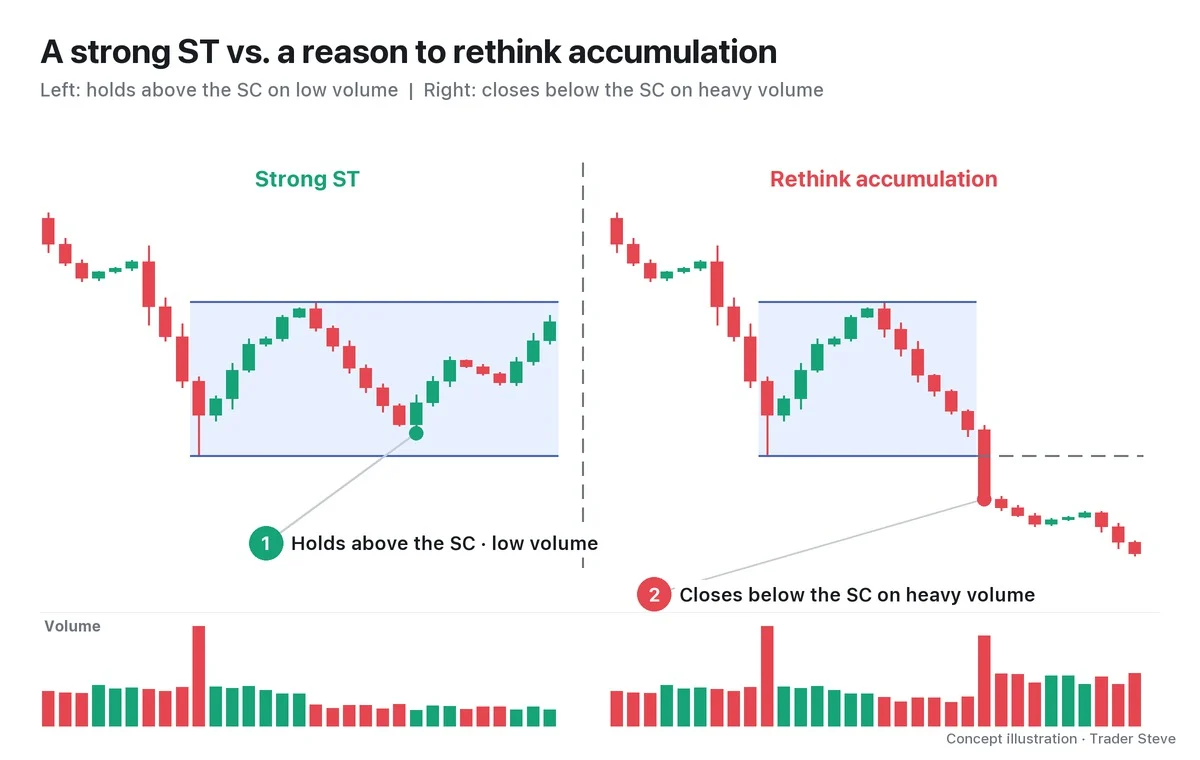
All three say the same thing in the end: "There is less supply left to dump." Conversely, if price closes below the SC low on heavy volume and fails to come back, you have to revisit the assumption that the decline has stopped at all. A brief dip just below the SC followed by a quick return is read differently; that is covered in Part 2 (variations) and in the next topic, the spring. Part 2 also turns these identification criteria into a numeric checklist.
5. A Real Chart: ETH Daily, April 2025
Let's check it on a real chart. The numbers below are calculated from Binance prices, and the labels SC, AR and ST are one interpretation.
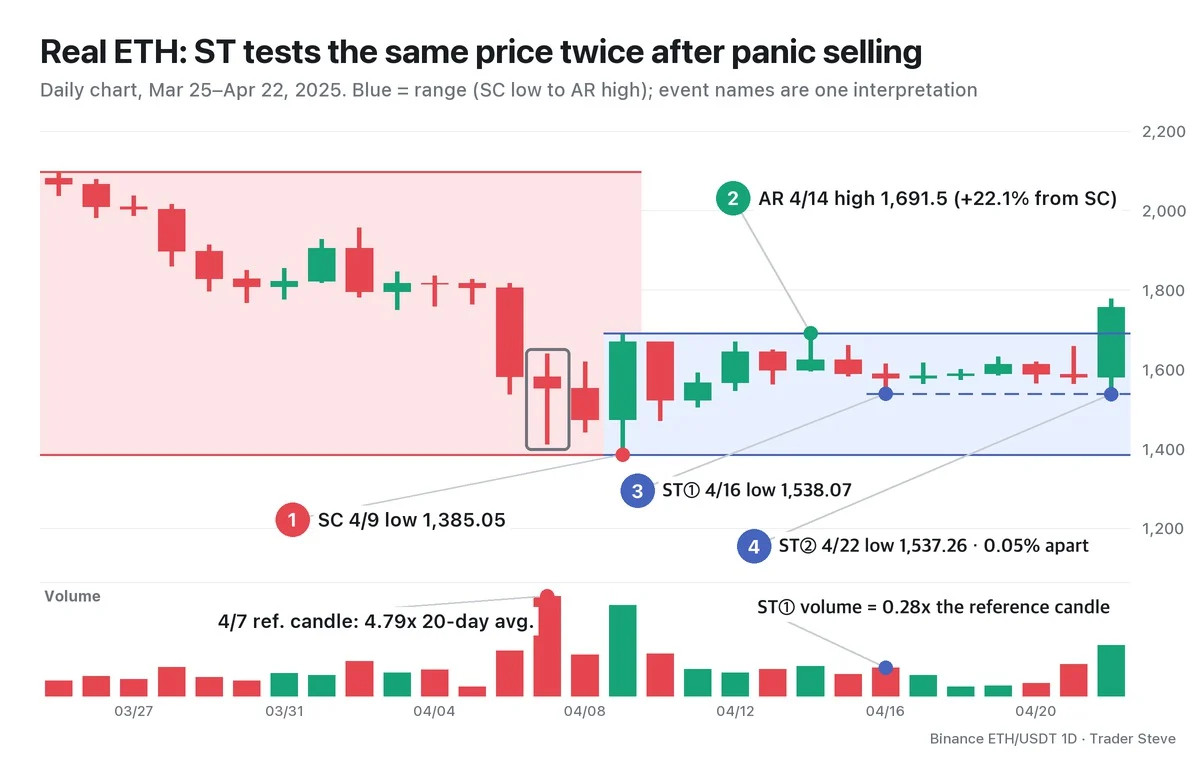
- SC: panic selling clustered from Apr 6 to Apr 9. Volume on Apr 7 was 2,168,796, 4.79x the average of the previous 20 days (I use this candle as the volume reference candle), and the low printed on Apr 9 at 1,385.05. That same day, price recovered sharply to close at 1,669.51.
- AR: price bounced to a high of 1,691.5 on Apr 14. That is +22.1% from the SC low, and this high is the top of the range.
- ST①: on Apr 16, price came back down to a low of 1,538.07. Volume was 0.28x the reference candle, and its position in the range was 49.9% (0% = SC low, 100% = AR high).
- ST②: a low of 1,537.26 on Apr 22. It is 0.05% away from ST①, so price checked the same level twice.
From the SC through Apr 22, price never went below the SC low, and no candle in that span exceeded the reference candle's volume. On Apr 22, after confirming the low, price closed at 1,756.26, above the AR high. A move above the top of the range is the subject of the Wyckoff Sign of Strength topic, so here I only record the fact.
ST① is a high ST: it sits 11% above the SC and only came back down to the middle of the range (49.9%). It is a borderline case that straddles Part 2's reference line at roughly 50% of the range for the lower half.
Key Takeaways
- An ST (secondary test) is the pullback after the SC and AR in which price comes back down to the SC price zone to check it.
- The SC sets the bottom of the range and the AR sets the top; Phase A ends when the first ST is complete.
- Price comes back down, in this reading, to test the remaining supply and to absorb the size that wasn't filled.
- The smaller the volume and candle spread compared with the SC, and the more clearly it stops above the SC low, the stronger the ST.
- If price closes below the SC on heavy volume, revisit the accumulation hypothesis. The labels are always an interpretation.
In Part 2, we'll cover a checklist for finding STs (position in the range in % and the volume multiple), STs that repeat in Phase B, and the upthrust action (UA) that briefly pokes above the top of the range.
If calculating the range position and volume multiple by hand for every market is tedious, the Omnisight Report below covers each market's Wyckoff structure as well.
This lesson adapts the text, figures and live-stream quotes of the Trader Steve TA series for the web, translated from the original Korean. Check the text and figure captions for the timing and interpretation of each real example, and read conceptual diagrams and real charts separately.
Corrections: support@omnisight.report


