
What Is a Wyckoff Test? Meaning and Logic of the Low-Volume Retest
Historical examples for learning · not current prices or trade recommendations.
Contents
After price gives the floor of an accumulation range one hard shake, the market often doesn't rally straight away. Instead, it drifts quietly back down to the same price zone one more time. Wyckoff calls this move the test. This lesson uses diagrams and a real chart to show what a test is, why it forms, and why it is read as the place where the market checks again whether anyone is still left to sell.
All dates and times are Korea Standard Time (KST, UTC+9). A daily candle is dated by its 09:00 KST open; intraday extremes are identified by their KST date and time.
1. The One-Line Definition: Back to the Shaken Zone, on Less Volume
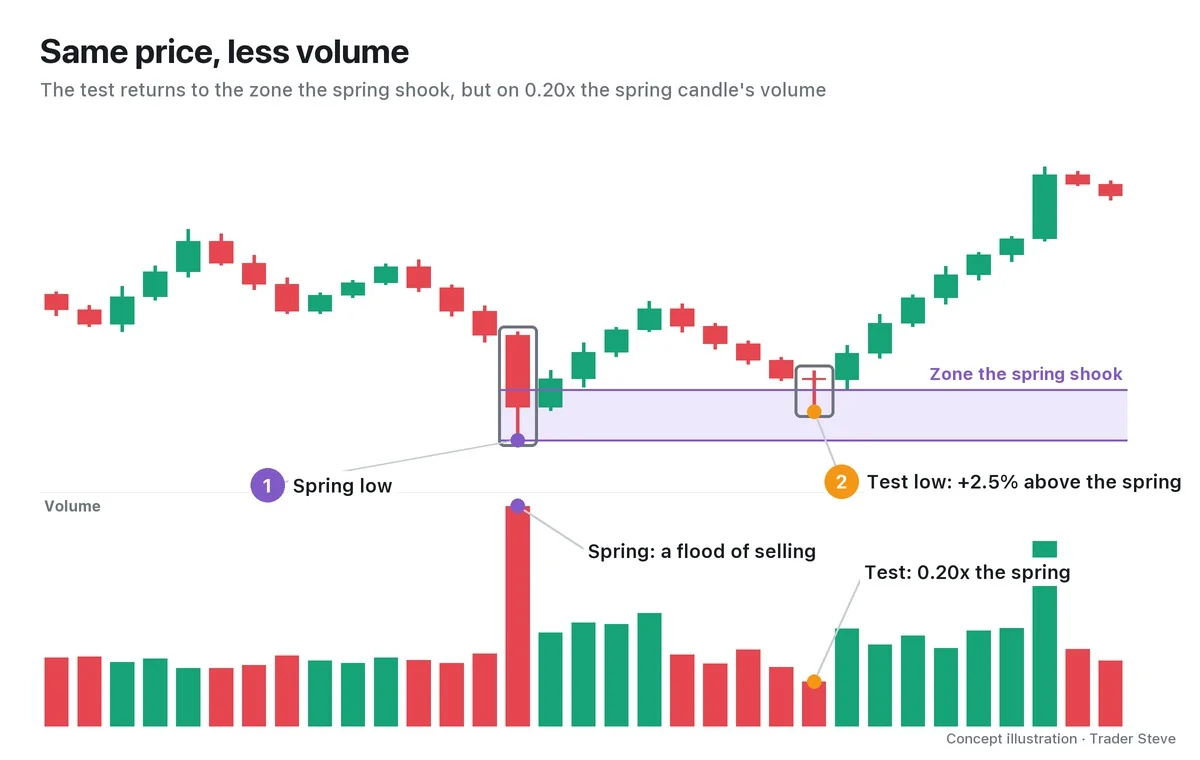
A test is the move in which price comes back down to the zone that was shaken earlier on heavy volume and, this time, stops above it on much lighter volume. This series looks at three things together.
- Where: right after a spring (a move that briefly breaks the bottom of the range and comes back). In this case it is called a test of the spring.
- Where the low sits: it stops above the spring low. Even if a wick dips slightly below, the close has to be above it.
- Volume: clearly smaller than on the spring candle. Because the same price is rechecked on less size, it is also called a low-volume retest.
Volume is written as a multiple, such as "0.42x the spring candle." The reference candle is the highest-volume candle in the spring cluster.
2. Its Place in the Accumulation Schematic: Right After the Spring
Where the test sits is easiest to see on the full accumulation picture.
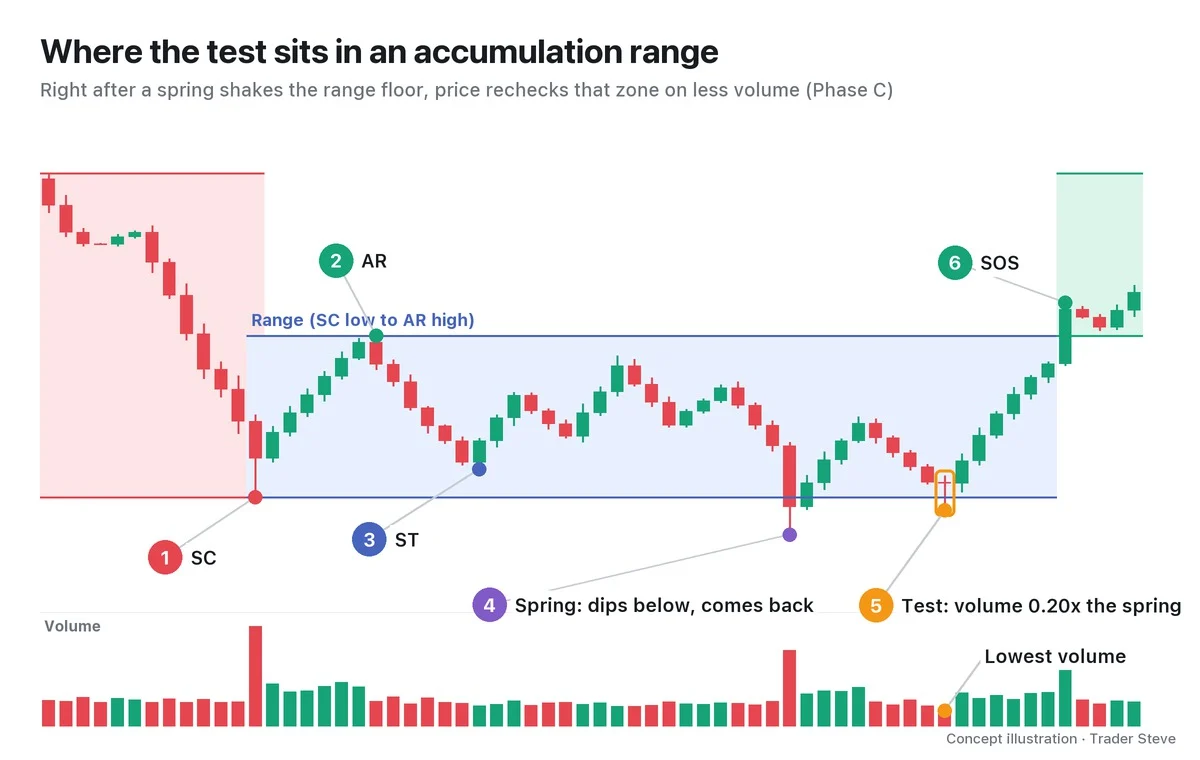
- Phase A: the range forms from the selling climax (SC), the panic-selling low (see Wyckoff Selling Climax, wyckoff/sc); the automatic rally (AR), the bounce that follows on its own (see Wyckoff Automatic Rally, wyckoff/ar); and the secondary test (ST), which rechecks the SC price zone (see Wyckoff Secondary Test, wyckoff/st).
- Phase C: a spring (see Wyckoff Spring, wyckoff/spring) breaks the bottom of the range once to shake out the remaining supply, and the test follows right after it. The test is the signature event of Phase C.
- Phase D: once the test holds, the move continues into a sign of strength (SOS) that pushes hard through the top of the range (see Wyckoff Sign of Strength, wyckoff/sos).
The ST also "checks again," so it resembles a test, but the ST is the check at the end of Phase A, when the range is just forming, while the test is the check after the spring. The phases as a whole are covered in Wyckoff Accumulation Phases (related lesson).
3. Why It Forms: The Big Players Tap Price to Test Supply
The underlying idea of a test is testing supply. Before the side that has been accumulating marks price up, it wants to confirm one thing: "Is anyone still left below, ready to dump?" If there is, that supply will pour in from above the moment price is pushed up, and it will cap the rally.
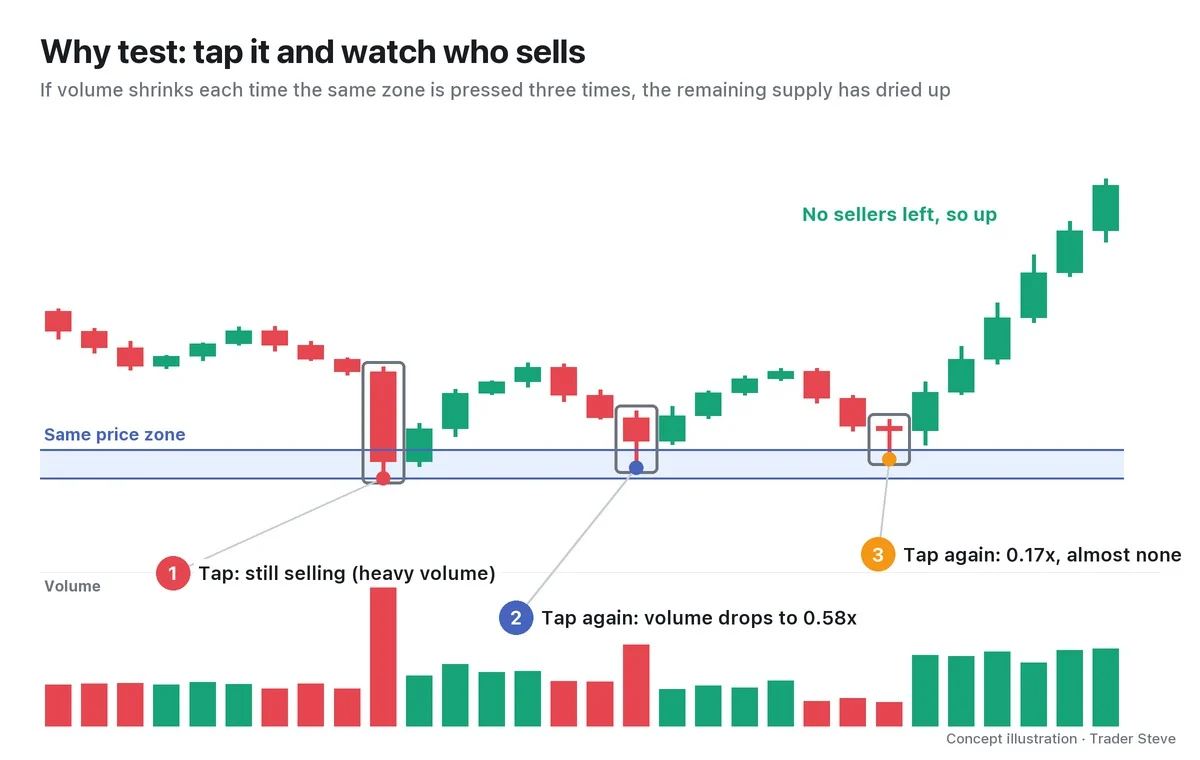
So they tap price lower. If volume explodes and price gets pushed down, there are still plenty of sellers. If price stops without volume, the sellers have dried up. On a live stream, looking at a different market's chart (XRP), I once described the process like this.
"Everyone's dumped. That's why it's gotten so light. There are no holders. … There are no retail traders left carrying a big bag on their shoulders. So what happens? Tap it, tap it, test it, and there's nobody. Now the road ahead is wide open. It just takes off." — Trader Steve, live stream, Oct 14, 2026 (translated from Korean) · ▶ Watch this moment (Korean audio)
The key word is "light." Low volume on a test means price is being pressed, yet no one follows it with selling. Through Wyckoff's law of effort vs. result (see Wyckoff Effort vs. Result, wyckoff/effort-result), that is evidence that the supply side has run dry.
4. Why Price Comes Down Once More: The Spring Alone Doesn't Finish the Job
If the spring already shook the floor, why does price bother coming down again? A single spring rarely lets the accumulating side collect all the size it wants, and there may still be stop-loss orders below waiting to be flushed out. So price comes down one more time to check the remaining supply and the size being absorbed.
Here is how I explained it while looking at a chart of a different market (SOXL, a leveraged US semiconductor fund) where price had stabbed the bottom once.
"Once it's stabbed down, a decline never ends with just one. Because it shakes out all the liquidity stacked up here like this, and then combines the size built up here with the size it absorbs to load up right here — so whenever the trend turns, it can't help but take this structure." — Trader Steve, live stream, Aug 28, 2026 (translated from Korean) · ▶ Watch this moment (Short, Korean audio)
Take "never" and "can't help but" as rules of thumb. Sometimes price rallies with no test, and sometimes the test fails. Still, rather than chasing right after the spring, waiting for price to come down once more and checking whether volume dries up gives you one more piece of evidence.
5. Real Ethereum, 2023: Spring Volume vs. Test Volume
This is a real Ethereum daily chart. The SC, AR, spring and test labels are an interpretation from a Wyckoff point of view.
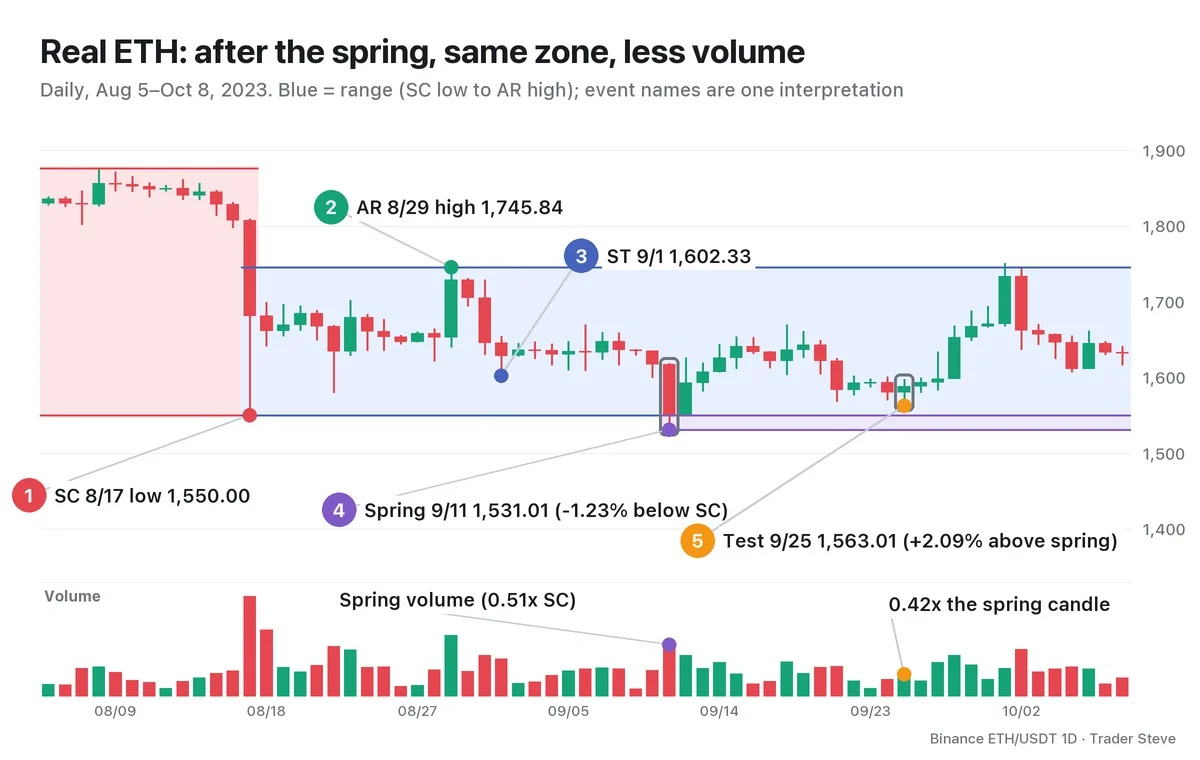
- SC: Aug 17 low of 1,550.00. Volume was 4.90x the average of the previous 20 days.
- AR and ST: price bounced to a high of 1,745.84 on Aug 29, setting the top of the range, and checked the bottom once at 1,602.33 on Sep 1.
- Spring: the Sep 11 low of 1,531.01 broke the SC low by -1.23%, but the same day closed back above the SC at 1,551.85.
- Test: after 1,567.77 on Sep 21 (2.40% above the spring, 0.58x the spring candle), price stopped at 1,563.01 on Sep 25. That was 2.09% above the spring low on 0.42x the spring candle's volume (0.22x the SC candle), and the candle closed in the upper part of its range (at the 73% point).
As the same price zone was rechecked, volume shrank further, from 0.58x to 0.42x, and on Oct 1 price reached the AR for the first time with a high of 1,751.00. Real charts aren't always as clean as the textbook: on Oct 12 a wick briefly dipped below the spring low (1,521.00) but the candle closed above it, and on Oct 23 a close of 1,765.46 put price above the AR. The next scene, breaking out of the range, continues in the Wyckoff Sign of Strength topic (related lesson). The same shape also appeared in a Bitcoin range from late June to early July 2026; you can find it in Wyckoff Accumulation Phases (related lesson).
Key Takeaways
- A test is the move in which price comes back down to the zone the spring shook and stops above it on lighter volume.
- In an accumulation range it sits in Phase C, in the sequence SC, AR, ST → spring → test → SOS.
- The underlying idea is testing supply. If price is pressed and no size gets dumped, supply is read as dried up.
- Volume should be clearly smaller than on the spring candle, and the low should stop above the spring low (if a wick dips below, the close must be above it).
- A test label on a real chart is always an interpretation, not a confirmed signal.
In Part 2, we'll put numbers on a checklist for finding tests (position %, volume multiple, candle shape) and on variations such as repeated tests, tests that dip slightly below, and tests without a spring.
If checking this by hand for every market is a chore, you can see a report that points out Wyckoff structure at the link below.
This lesson adapts the text, figures and live-stream quotes of the Trader Steve TA series for the web, translated from the original Korean. Check the text and figure captions for the timing and interpretation of each real example, and read conceptual diagrams and real charts separately.
Corrections: support@omnisight.report


