
What Is a Wyckoff Upthrust (UT)? Meaning and Why It Forms
Historical examples for learning · not current prices or trade recommendations.
Contents
At the end of a long rally, price builds a range, and at some point it pokes just above the prior high. It looks like the breakout has finally arrived, but that candle closes back inside the range, and from the next candle on, price gets pushed lower. Wyckoff called this an upthrust (UT). This lesson uses diagrams and a real Bitcoin (BTC) chart to show what a UT is, why it forms right above the high, and what it looks like on a chart.
All dates and times are Korea Standard Time (KST, UTC+9). A daily candle is dated by its 09:00 KST open.
1. The One-Line Definition: A False Breakout That Pokes Above the Range and Comes Back Inside
A UT is a move in a distribution (or redistribution) range where price briefly rises above resistance, the top of the range, and then returns inside the range. The top of the range is usually set by the high of the buying climax (BC), the overheated buying at the end of the rally. In general trading terms it is also called a false breakout or a bull trap.
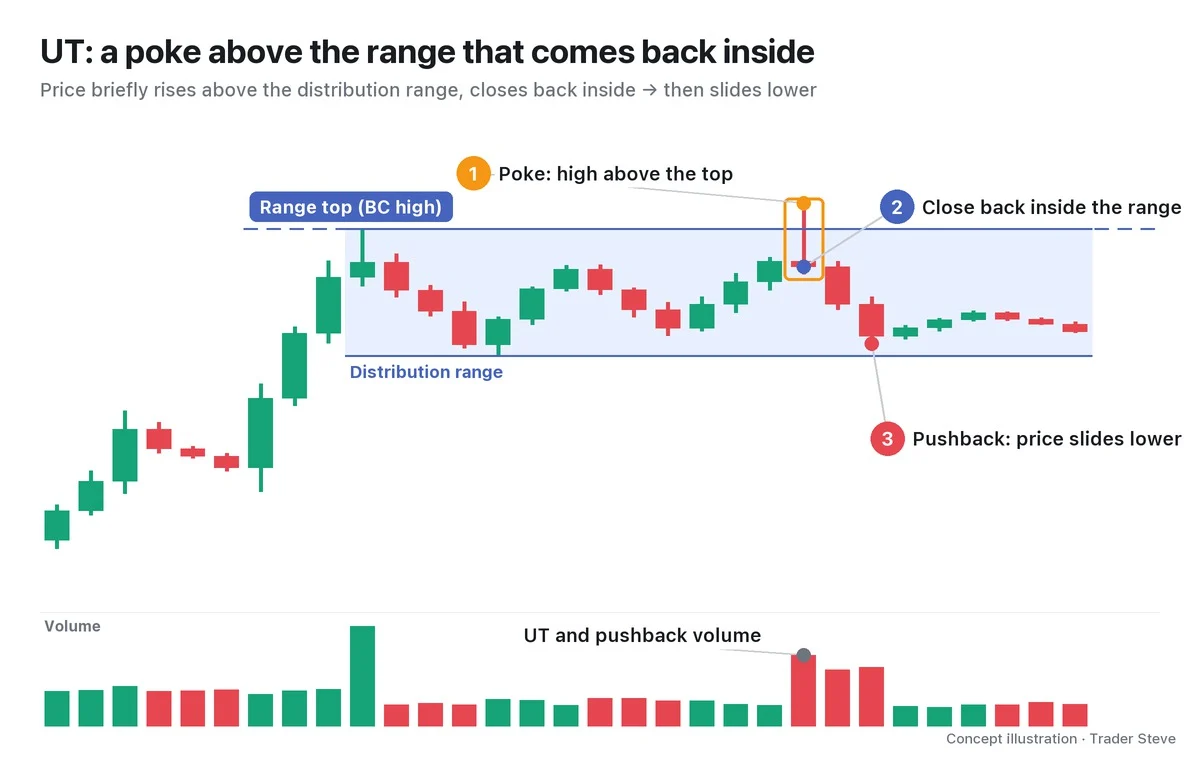
What matters here is ② and ③, more than ①. An upper wick that pokes out on its own settles nothing. You read a UT by checking whether the close came back inside the range, and whether the following candles stay inside the range and get pushed lower. Conversely, if price closes above the UT high and holds there, the UT interpretation is invalid. Parts 2 and 3 cover this invalidation rule in detail.
2. Why It Forms: Buy Orders Stack Up Above the High
Two kinds of buy orders gather just above the top of a range. One is breakout buying — "I'll buy once it clears the high." The other is the short stop-losses (stop-market orders) that traders who shorted inside the range have placed above the high. In this example, the short stops are assumed to be stop-market orders, which become market buy orders when triggered. A stop-limit order becomes a limit order once triggered, so it may go unfilled. That makes the area above the high a spot where buy orders are packed together — in ICT terms, a place where buy-side liquidity (BSL) has built up.
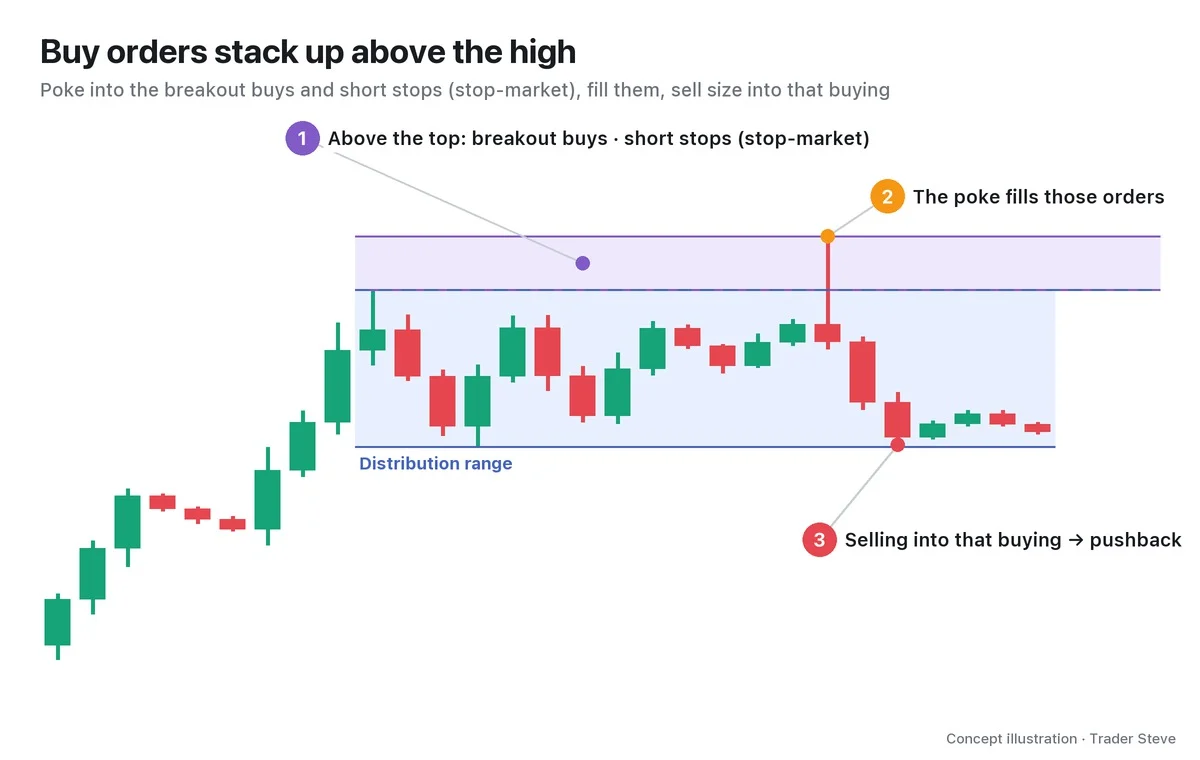
For anyone who wants to sell a lot of size, this is an excellent place to sell. Lift price just above the high and buy orders pour in, ready to absorb their size. I explained it this way, sketching a "what if I were the one making the market" scenario on an Ethereum chart.
"You could build a structure like this: drag price up so people take on even more buying, then sell into that and get out. Or you could pretend to push it up here, and when people go, 'Oh, this is the breakout, breakout long!' and start piling in with buys, you sell into that and come back down like this." — Trader Steve, live stream, Sep 21, 2026 (translated from Korean) · ▶ Watch the stream highlights (Korean audio)
"Pretend to push it up, and when people buy, sell into it" — that is the shortest summary of how a UT works. The big player's side of the story is in the Wyckoff Composite Man topic (related lesson), and why orders gather above the high is covered in more detail in ICT Liquidity (related lesson).
3. Where the UT Sits on the Distribution Map
A UT is not an isolated signal; it is one scene in the larger flow of distribution. A distribution range forms roughly in this order.
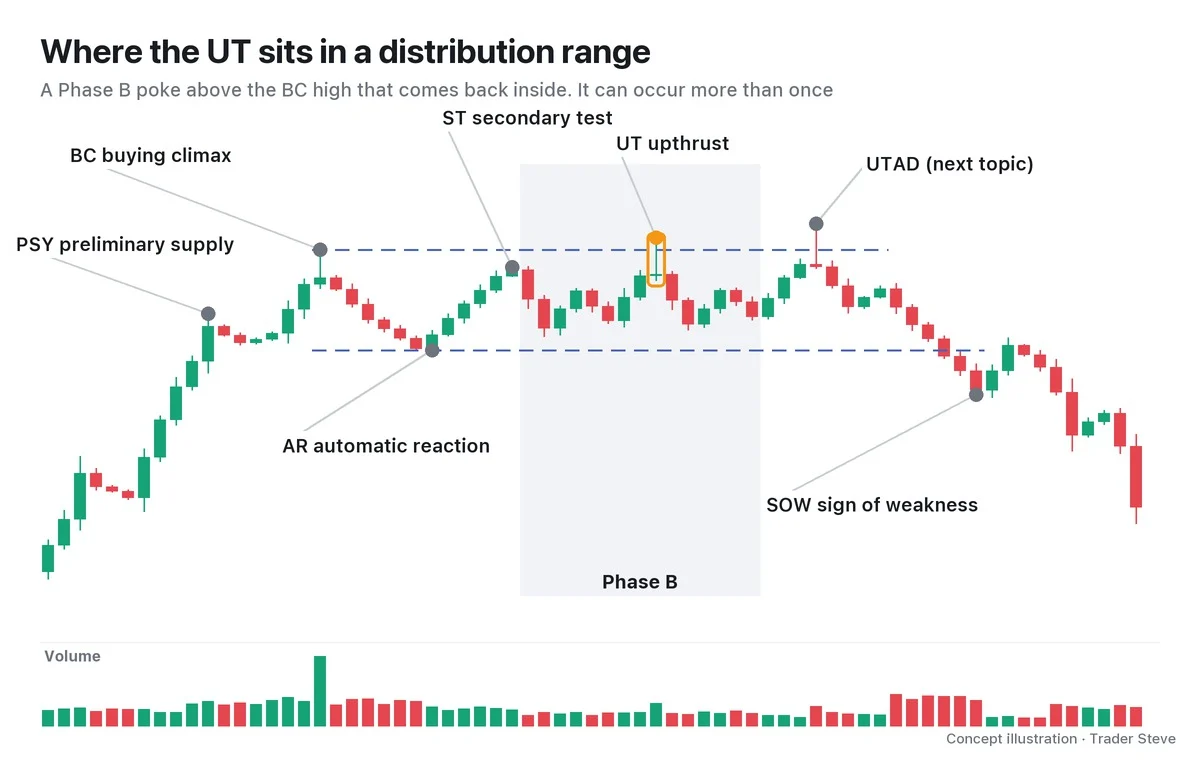
Preliminary supply (PSY), the first sign of supply during the rally; the BC, where overheated buying piles in; the automatic reaction (AR), the first sharp drop after it; and the secondary test (ST), which retests the area near the BC — together these set the ceiling and floor of the range. Then comes Phase B, where price swings up and down inside the range for a long time, and a poke above the BC high that comes back inside is the UT. If an ST stops below the BC, a UT goes slightly above the BC and comes back. A UT in Phase B can occur not just once but several times.
The last and strongest poke near the end of the range (Phase C) gets its own name, the upthrust after distribution (UTAD), and it is followed by an SOW that breaks the bottom of the range. The UTAD is covered in the next topic (see Wyckoff UTAD, wyckoff/utad). I also pointed out the UT while sketching a distribution structure.
"A distribution structure works the same way: it fires off an upthrust, tags a high up there, gives one pullback, and then pushes up one more time." — Trader Steve, live stream, Oct 12, 2026 (translated from Korean) · ▶ Watch the stream highlights (Korean audio)
For the full map of Phases A–E, see Wyckoff Distribution Phases (related lesson); for the BC that sets the ceiling of the range, see Wyckoff Buying Climax (related lesson).
4. What a UT Candle Looks Like
The candle on which a UT happens is called the UT candle. It often looks like this.
| What to check | What the UT candle looks like |
|---|---|
| High | Above resistance (the BC high, the zone at the top of the range) |
| Close | Below resistance, inside the range |
| Close location | In the lower part of the candle, usually within the bottom 40% (long upper wick) |
| Volume | Two types: heavy (supply pours in from above) or light (no demand up there to buy) |
At first it is confusing that a UT can come with either heavy or light volume. Heavy volume is a footprint that "sellers absorbed all the buying up there," and light volume is a footprint that "price cleared the high, yet nobody followed it up with buying." Either way, it tells the same story: up there, demand failed to overcome supply. Part 2 covers how to tell the two types apart and the identification checklist.
5. A Real BTC Example: One Day Above the Prior High, All of It Given Back the Next
Let's look at a scene on the Bitcoin daily chart from summer 2025 that can be read as a UT. The event names were assigned after the fact and are one interpretation.
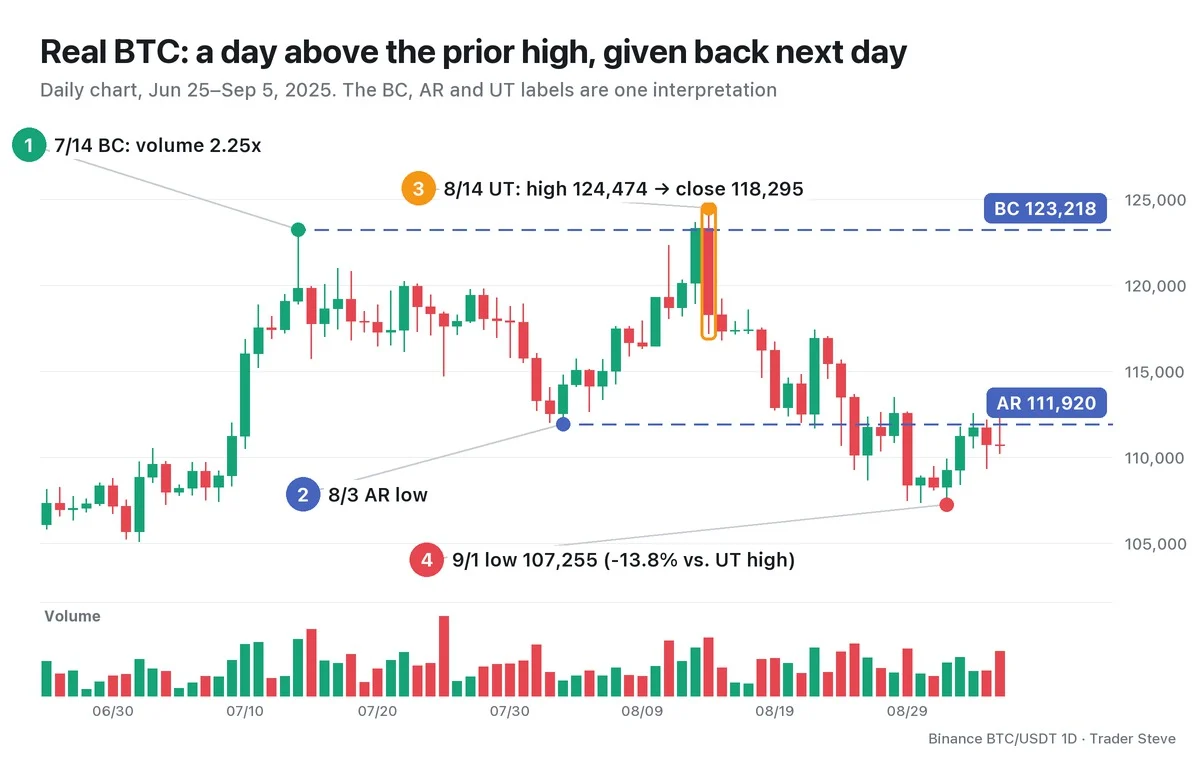
On Jul 14, Bitcoin printed a high of 123,218, and that day's volume was 2.25x the average of the previous 20 days (①, read as the BC). Price then slid to a low of 111,920 on Aug 3 (②, read as the AR) and climbed back, and the Aug 11 high of 122,335 stopped below the BC. On Aug 13, price closed the day above the BC at 123,306.
The Aug 14 daily candle (③) is the UT candle. Its high of 124,474 was 1.02% above the BC, but price fell to a low of 117,180 and closed inside the range at 118,295. The close sat in the bottom 15% of the candle, and volume was 1.83x the average of the previous 20 days. Having held above the BC for a day, price gave all of it back the next day.
After that, the Aug 25 close fell below the AR, and on Sep 1, 18 days after the UT, the low was 107,255, 13.8% below the UT high (④). This range did not end there, though; the higher high that came later is a UTAD candidate and is covered in the next topic. Split the same Aug 14 into 4-hour candles and you can see where to plan an entry and a stop-loss; Part 3 practices that.
For BTC on 7/14 and 8/14, 2025, two readings coexist: Wyckoff Preliminary Supply Part 1 reads them as a PSY and a BC candidate, while Wyckoff Distribution Phases Part 4 reads them as a BC and a UT. These are alternative interpretations of the same daily chart; compare the chosen range and confirmation conditions in the Distribution Phases Part 4 shared reference table.
Key Takeaways
- A UT is a move that pokes above the top of a distribution range and then closes back inside the range.
- It draws out the breakout buys and short stops (stop-market orders) stacked above the high — a place to hand off size into that buying.
- It is a Phase B event in distribution and can occur several times. The last strong poke has its own name, the UTAD.
- You judge it by the close and the candles that follow, not by the wick. If price closes above the UT high and holds, the interpretation is invalid.
In Part 2, we'll cover the conditions for identifying a UT, with a checklist and several variant shapes.
This lesson adapts the text, figures and live-stream quotes of the Trader Steve TA series for the web, translated from the original Korean. Check the text and figure captions for the timing and interpretation of each real example, and read conceptual diagrams and real charts separately.
Corrections: support@omnisight.report


