
What Is a Wyckoff UTAD? The Last False Breakout of Distribution Explained
Historical examples for learning · not current prices or trade recommendations.
Contents
After a long rally, price drifts sideways for a while and then breaks out above the range. You buy because "this is the breakout," and before long price is back inside the range. Wyckoff theory calls this move at the end of a distribution range an upthrust after distribution (UTAD). This lesson uses diagrams and a real Bitcoin (BTC) chart to explain what a UTAD is, where it sits, and why it forms above the range of all places.
All dates and times are Korea Standard Time (KST, UTC+9). A daily candle is dated by its 09:00 KST open; intraday extremes are identified by their KST date and time.
1. The One-Line Definition: A Last Test That Pokes Above the Range and Comes Back Inside
A UTAD is a move in Phase C of a distribution range where price pokes above the top of the range and then closes back inside it. The easiest way to picture it is as the mirror image of the spring that appears below an accumulation range.
Three words matter here.
- Top of the range: the higher of the buying climax (BC) high and the high of an upthrust (UT) in Phase B.
- Pokes above and comes back: price fails to hold above the top, and on the same candle or within a few candles the close is back below the top.
- Last: there can be several tests that probe above the range. The UTAD is the last one, the one that is followed by weakness.
So right after the poke, it is only a "UTAD candidate." It is confirmed only when weakness follows and price closes below the bottom of the range. Conversely, if price holds above the range, that poke was part of a breakout (a sign of strength, SOS).
2. Its Place in the Distribution Structure: The Last Trap in Phase C
UTAD is not a name you give to just any new high. It has a defined place inside the Wyckoff distribution structure.
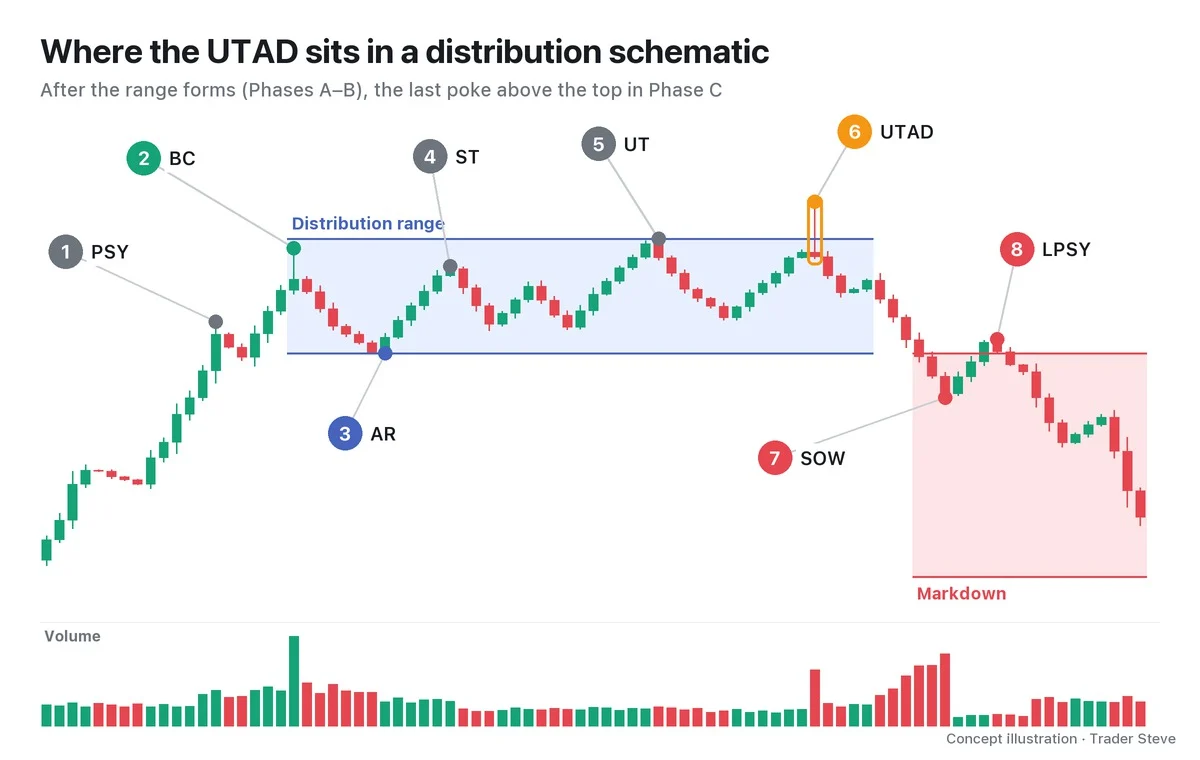
- Preliminary supply (PSY): the first heavy selling during the rally
- Buying climax (BC): the high printed on a volume spike; a candidate for the ceiling of the range
- Automatic reaction (AR): the drop that follows the BC on its own; it becomes the floor of the range
- Secondary test (ST): a rally that checks the area near the BC again
- Upthrust (UT): a test in Phase B that briefly clears the top and comes back
- UTAD: the last poke in Phase C
- Sign of weakness (SOW): a close below the bottom of the range on heavy volume
- Last point of supply (LPSY): the rally that follows, stalling at a lower high as volume dries up
How to identify each event is covered in the event-by-event topics of this series. For now, just remember that the UTAD sits "after the range is fully built, right before the decline begins."
3. Why It Forms: Big Size Only Sells If Someone Is There to Buy It
Distribution is the process in which the big players who built a position (Wyckoff's "Composite Man") hand that position off at high prices. The problem is that the position is huge. If they simply dump it, nobody is there to absorb it, and price just collapses.
"You shouldn't think about the big players from the point of view of small traders like us. Think from their side. Say you want to buy 100 trillion won worth of Bitcoin — can you? You can't, I'm telling you. … When you bought, you put in 100 trillion and shot price up this far to get filled, but now when you try to sell, nobody's there to buy. Then it comes down like this." — Trader Steve, live stream, Sep 21, 2026 (translated from Korean) · ▶ Watch the stream highlights (Korean audio)
What the big players need, then, is buying that floods in all at once. The area just above the top of the range is exactly that kind of place. Two types of orders stack up there.
- Breakout buy orders: new buyers waiting for "it's a breakout once it clears the top"
- Short stop-loss (liquidation) orders: the stops of traders who shorted near the top of the range. Closing a short means buying, so these are buy orders too
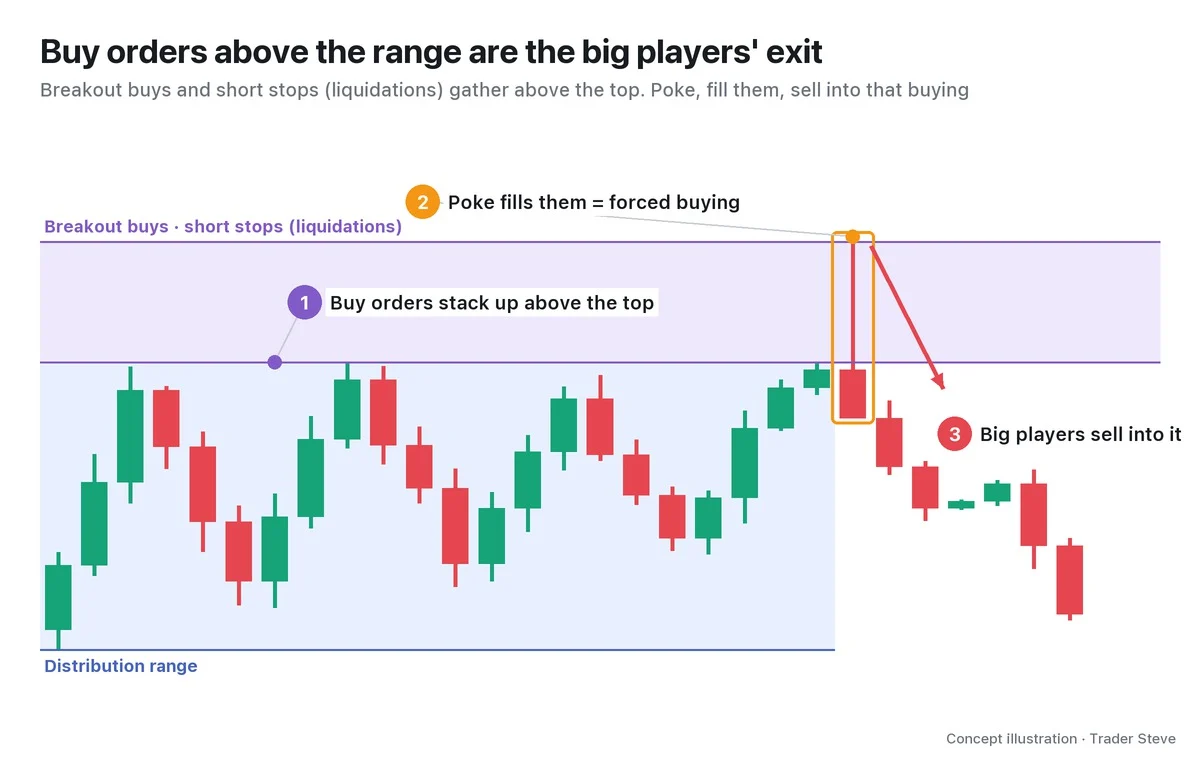
On a live stream, looking at a Bitcoin chart, I once explained the structure like this.
"If the big players who took on size here approached it as 'Now that I've pushed price up, I should sell here' — buy here, sell here — then they'd build a distribution structure like this and come back down. … Pushing it down with futures costs money, so here they use the so-called liquidation orders … stack shorts up above here, push price up and blow them all out — isn't that forcing buying to kick in?" — Trader Steve, live stream, Sep 21, 2026 (translated from Korean) · ▶ Watch the stream highlights (Korean audio)
"Forcing buying to kick in" is the heart of a UTAD. The moment price pokes above the range, breakout buys and short stops are triggered, and that buying absorbs the big players' size. Once everyone who was going to buy has bought, there is no buying left to lift price, so it returns inside the range. On the surface it looks the same as an ICT buy-side liquidity (BSL) sweep; Part 5 sets out the difference.
4. What a UTAD Candle Looks Like: A Slight Overshoot, a Close Inside, and Volume That Tells the Story
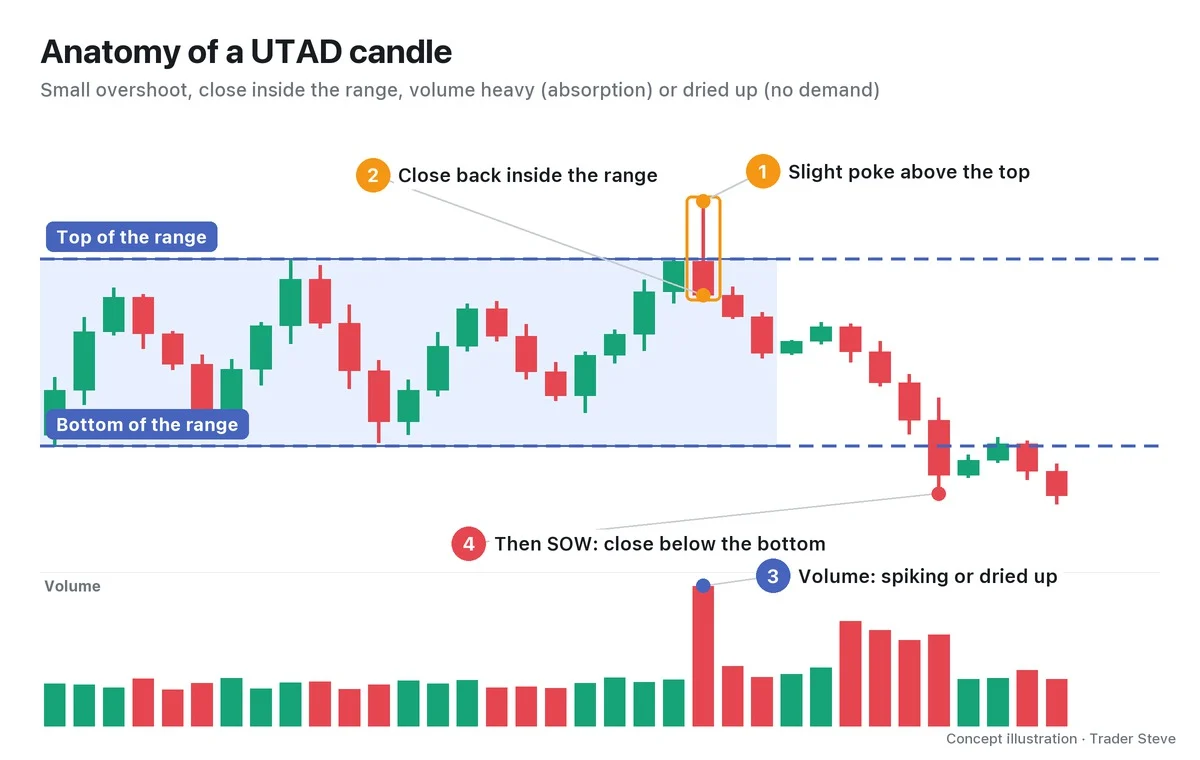
- The overshoot is small: price doesn't break out and run; it just touches the area where orders are stacked. Candles with a long upper wick are common.
- The close is inside the range: the high is above the top, but the close is below it. The lower the close sits within the candle, the stronger the selling from above was.
- Volume has two faces: if volume spiked, the big players absorbed all the breakout buying that rushed in and sold into it (absorption). If volume dried up, there was no more demand to buy even after the high was cleared. Through the lens of Wyckoff's "effort vs. result," either way the key result is that price got above but couldn't stay there.
- Weakness follows: what confirms a UTAD is the SOW that comes after it — a close below the bottom of the range. A wick that briefly pokes below the bottom is not confirmation.
5. Real BTC: A UTAD Candidate on the 2021 Weekly Chart
This is the actual Bitcoin weekly chart. The numbers come from Binance prices; the range and event names are my interpretation (weekly candles open Monday at 09:00 KST).
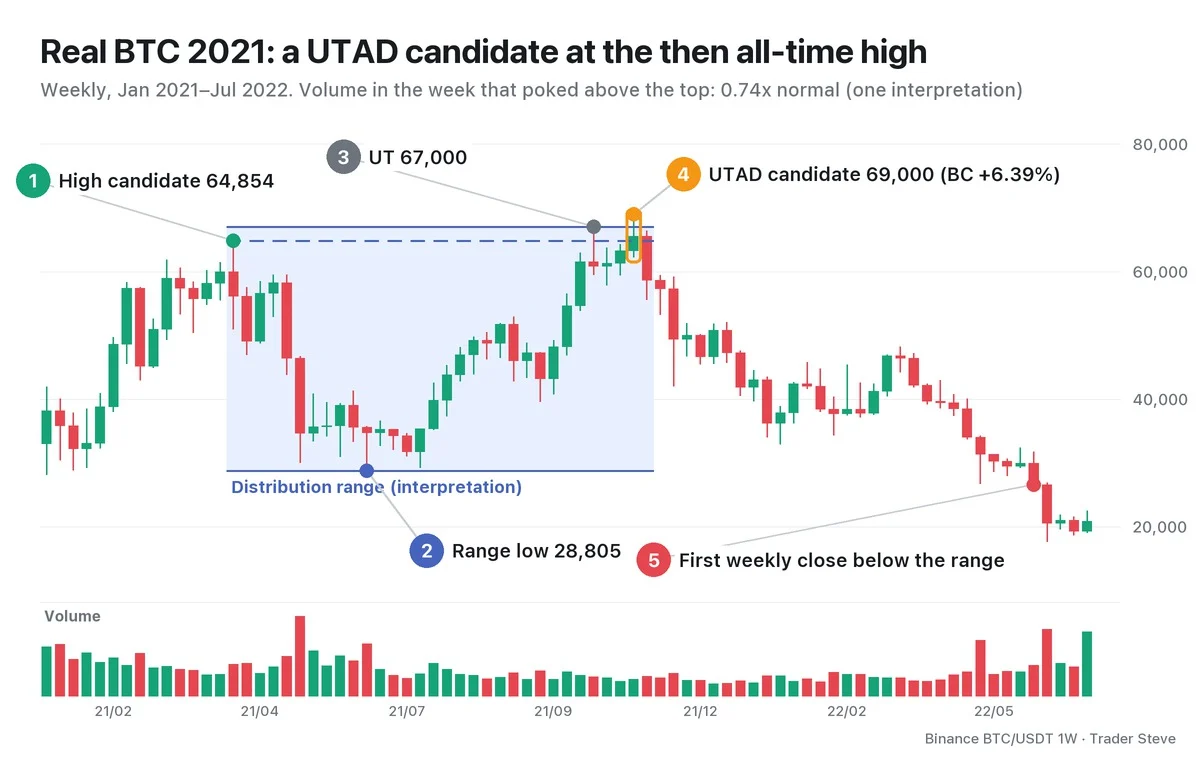
- Weekly high candidate (BC alternative): the high of 64,854 in the week of Apr 12, 2021.
- Bottom of the range: after price was pushed down to 30,000 in the week of May 17 (AR), the low of 28,805 in the week of Jun 21 became the floor of the range.
- UT: the high of 67,000 in the week of Oct 18 cleared the BC, but that week's close of 60,852 was below the BC.
- UTAD candidate: the high of 69,000 in the week of Nov 8. That is 6.39% above the BC and 2.99% above the October UT high. That week's close of 65,519 was below the UT high, and the next week's close of 58,622 was below the BC.
- Volume: volume in the UTAD candidate week was 0.74x the average of the previous 20 weeks — lower even than the BC week (0.92x). Price cleared the high and no demand followed: the "dried up" face.
The first weekly close below the 28,805 bottom of the range came in the week of Jun 6, 2022 (26,575), about seven months after the UTAD candidate. There is no fixed timetable for when the decline arrives after a UTAD. Part 5 comes back to this time lag.
The "BC" label on the week of Apr 12, 2021 is a weekly high-candidate interpretation on below-average volume (0.92x). It is not a BC that passed the mechanical daily filter in Wyckoff Buying Climax Part 2 (relative volume (RVOL) of 2.5x and the 60-candle maximum). Don't read the weekly interpretation and the daily filter as if they used the same yardstick.
Key Takeaways
- A UTAD is the last test in Phase C of a distribution range: price pokes above the top and closes back inside the range.
- The breakout buys and short stops stacked above the range give the big players the buyers they need to hand off their size.
- A UTAD candle has a small overshoot and a close inside the range, and its volume either spikes (absorption) or is dried up.
- At the moment of the poke it is only a candidate; it is confirmed only when a close below the bottom of the range (SOW) follows.
In Part 2, we'll cover how to tell a Phase B UT from a UTAD, along with a five-point checklist for identifying a UTAD.
Re-measuring the range, BC, UT and volume multiples by hand for every market takes time. The Omnisight Report lays out Wyckoff structures like this one for each market.
This lesson adapts the text, figures and live-stream quotes of the Trader Steve TA series for the web, translated from the original Korean. Check the text and figure captions for the timing and interpretation of each real example, and read conceptual diagrams and real charts separately.
Corrections: support@omnisight.report


