What Is the Risk-to-Reward Ratio? Calculation and Why It Beats Win Rate
Historical examples for learning · not current prices or trade recommendations.
Contents
When people start trading, most of them worry about their win rate first. But what decides where your account goes is how much you make when you win and how much you lose when you're wrong — in other words, the risk-to-reward ratio. This lesson covers what risk-to-reward and 1R mean, how to calculate them for longs and shorts, expectancy and the breakeven win rate, and why your stop-loss, position size and risk-to-reward work as one package.
All dates and times are Korea Standard Time (KST, UTC+9). A daily candle is dated by its 09:00 KST open, a weekly candle by its Monday 09:00 KST open, and intraday times are the open time of the candle on the timeframe shown.
1. The One-Line Definition: How Many Units of Reward per Unit of Risk
The risk-to-reward ratio (R:R), measured as an R multiple, compares the distance you make when you're right with the distance you lose when you're wrong on a single trade.
The unit everything is measured in is 1R (the R multiple). 1R is the distance from your entry price to your stop price — the one unit you lose if this trade turns out to be wrong. Once you set that, every result can be counted in R: a stop-out is -1R, reaching the target might be +2.5R. Counting in R lets you compare trades on the same yardstick, whatever the market or the size.
- Entry price: the price where you open the position
- Stop price (stop-loss, SL): the price where "if this breaks, my scenario is wrong" — the invalidation point
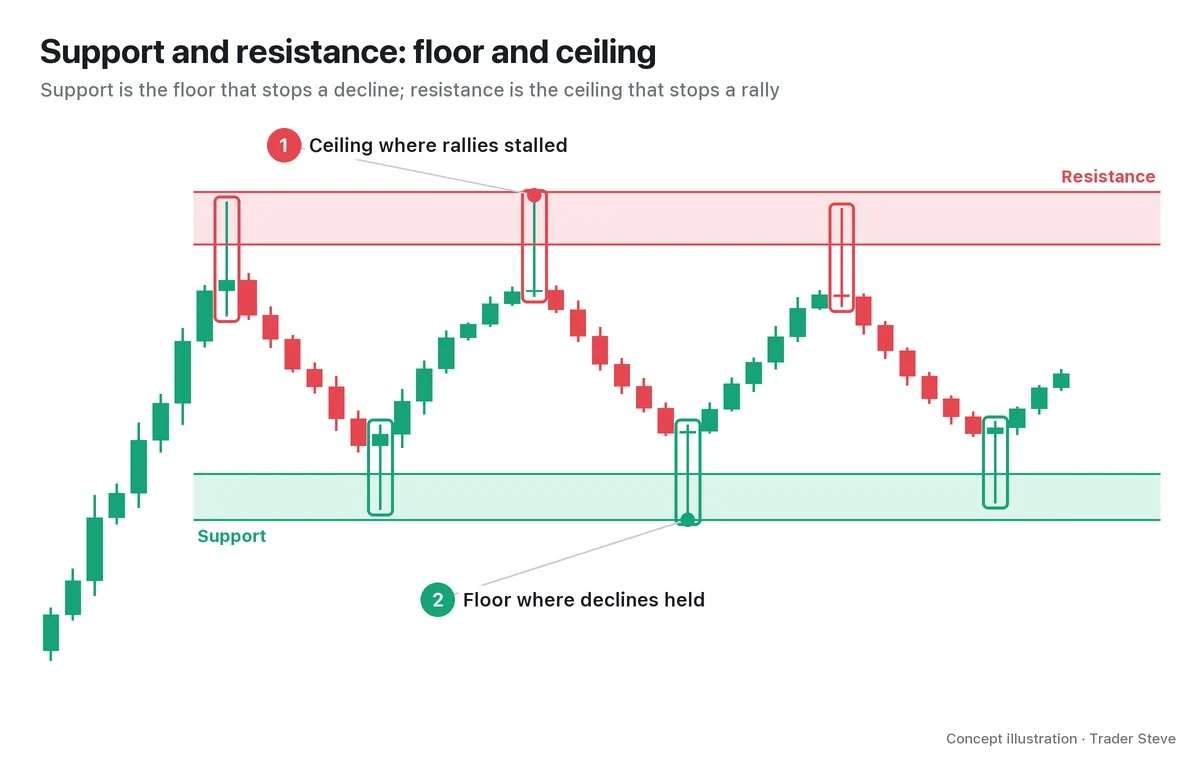
- Target (take profit, TP): a place price has a reason to be drawn to, such as the prior high or low, or resistance
2. How to Calculate It: Longs and Shorts
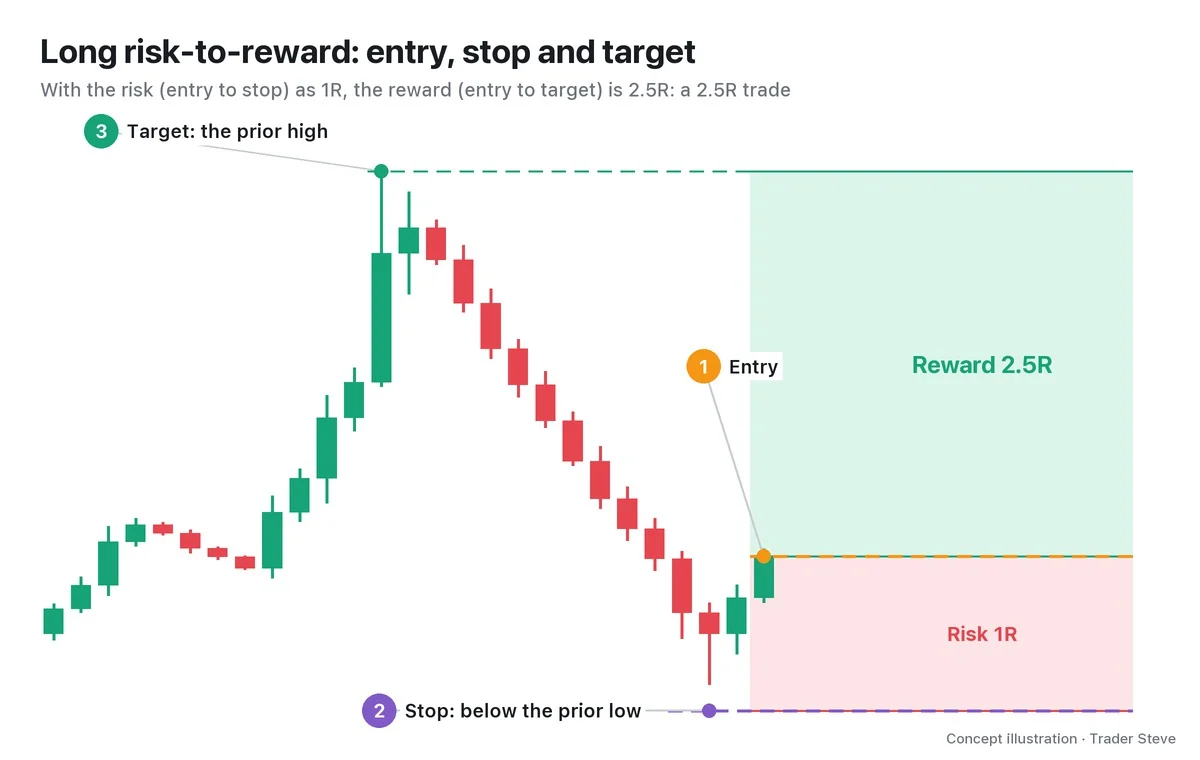
For a long (buy), the risk-to-reward ratio is:
Risk-to-reward = (target - entry) ÷ (entry - stop)
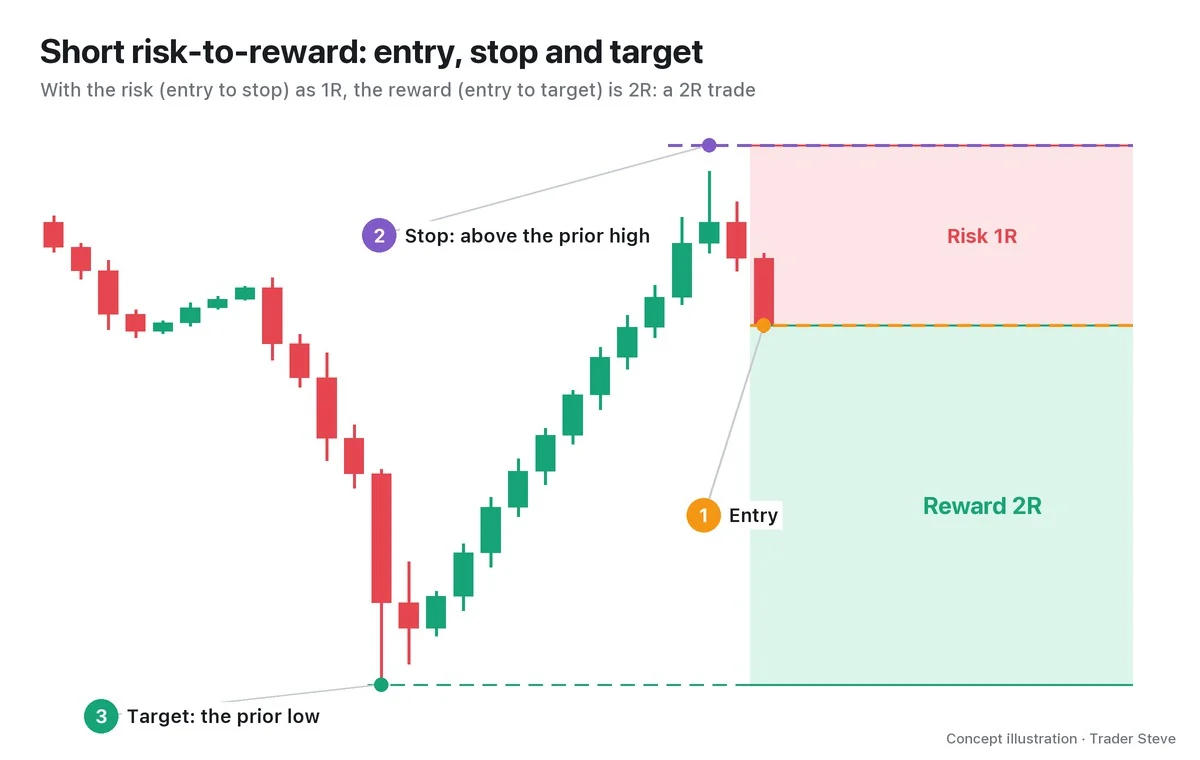
For a short (sell), just flip the direction:
Risk-to-reward = (entry - target) ÷ (stop - entry)
For example, if you short at 100 with a stop at 104 and a target at 92, the risk is 4 and the reward is 8, so the trade is 2R.
Let's measure one on a real chart. On the Ethereum (ETH) 4-hour chart, the 21:00 candle on Jul 8 made a swing low of 1,713.4, lower than the 5 candles on either side of it. Assume you entered at the 1,744.0 close of the Jul 9 17:00 candle — the fifth candle to the right of the low, whose close confirmed the swing low. The stop is 1,708.3, 0.3% below the low, and the target is 1,833.4, the nearest swing high before the entry.
- Risk: 1,744.0 - 1,708.3 = $35.7 (1R, about 2.0% of the entry price)
- Reward: 1,833.4 - 1,744.0 = $89.4
- Risk-to-reward: 89.4 ÷ 35.7 = 2.5R
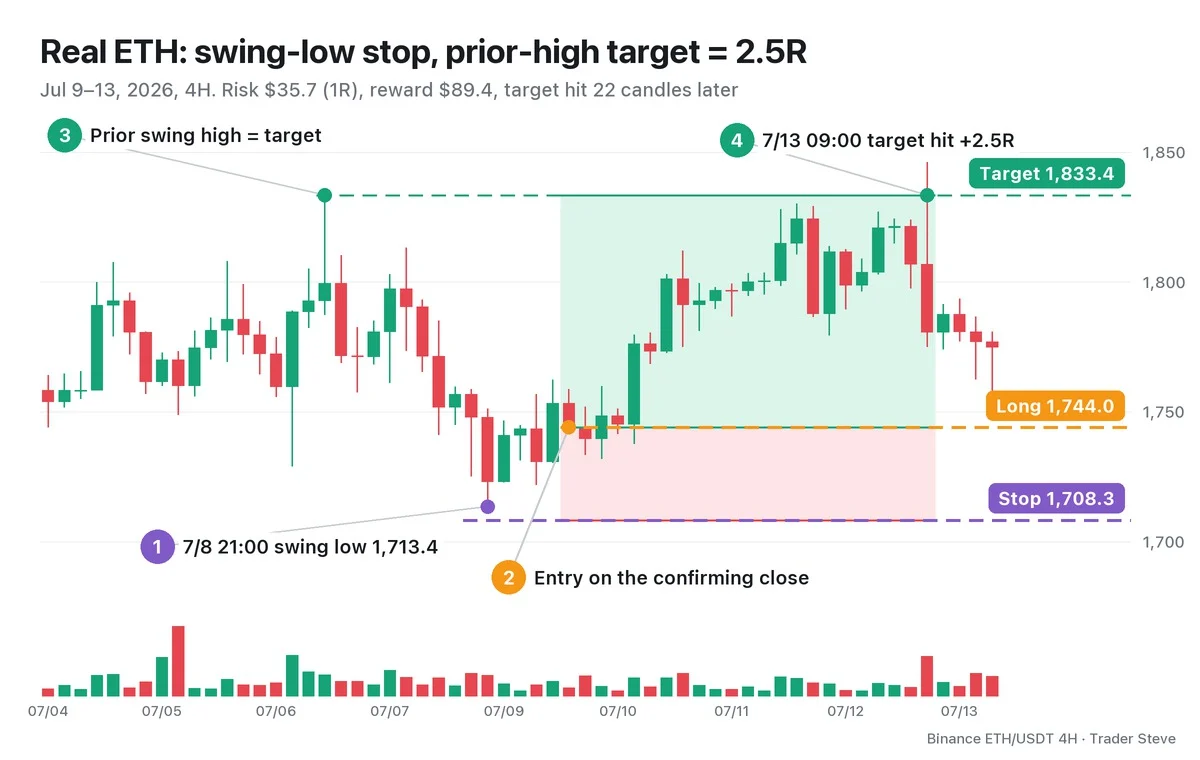
What matters is not the +2.5R result but that all three prices were set before you got in.
3. Win Rate and Risk-to-Reward: Expectancy and the Breakeven Win Rate
Win rate and risk-to-reward mean nothing on their own. Put them together and you get expectancy (EV).
Expectancy (R) = win rate × average winning R - loss rate × 1R
The breakeven win rate — the win rate at which expectancy is 0 — is 1 ÷ (1 + risk-to-reward).
| Risk-to-reward | Breakeven win rate | What it means |
|---|---|---|
| 1R | 50.0% | You must be right one time in two just to break even |
| 1.5R | 40.0% | Two times in five |
| 2R | 33.3% | One time in three |
| 3R | 25.0% | One time in four |
| 4R | 20.0% | One time in five |
A high win rate doesn't mean you make money, either. Compare two traders.
| Win rate | Risk-to-reward | Expectancy per trade | After 100 trades | |
|---|---|---|---|---|
| A | 40% | 2R | +0.2R | +20R |
| B | 60% | 0.5R | -0.1R | -10R |
B is right six times out of ten and still watches the account shrink. That is what the habit of taking small profits quickly while putting off the stop-loss looks like.
That's why I look for setups of at least 2R, leaving a margin above the mathematical breakeven. There are three reasons. First, there are fees and slippage. 1R at a 50% win rate has an expectancy of 0 before costs, but if costs take just 0.1R per trade, it becomes -0.1R. Subtract the same cost from 2R at a 40% win rate and you're still at +0.1R. Second, in practice it's harder than you'd think to keep your win rate above 50%. Third, losses and recoveries aren't symmetrical: +10% followed by -10% isn't breakeven, it's -1%.
4. Why Risk-to-Reward Is the Variable You Can Change
Consistently calling whether the next candle goes up or down is extremely hard. Risk-to-reward, on the other hand, is something you get to choose before you enter.
"The only thing we can do when we trade is raise this risk-to-reward. There's nothing else you can do. Whatever you do, you can't call whether it's going up or down." — Trader Steve, live stream, Oct 12, 2026 (translated from Korean) · ▶ Watch this moment (Short, Korean audio)
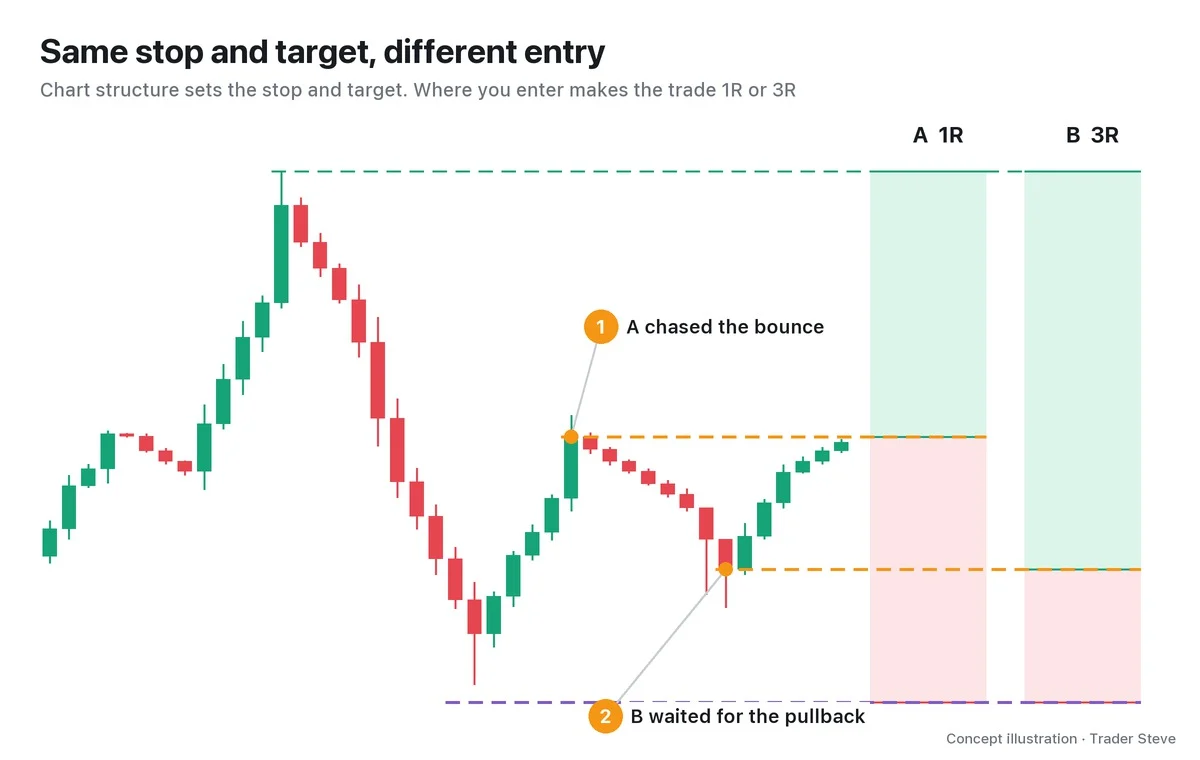
The chart structure sets the stop and the target. Where you get in between them is your choice. With a stop at 95 and a target at 115, entering at 105 gives you 1R; waiting for 100 gives you 3R. It's the same call on direction, yet the expectancy changes (Part 3 covers how entry location relates to the chance of getting filled).
I once showed my trading record on the live stream.
"I won 4 times and lost 4 times, right? That's 50/50. … But if you look at the account balance, it keeps climbing. Why? Because on average, my trades risked 1 to make 3.4." — Trader Steve, live stream, Oct 13, 2026 (translated from Korean) · ▶ Watch this moment (Korean audio)
If you simplify it to +3.4R on every win and -1R on every loss, 4 wins and 4 losses add up to 4 × 3.4 - 4 × 1 = +9.6R, an average of +1.2R per trade. That's how the account rises even with a win rate no better than a coin toss.
5. Three Pillars: Stop-Loss, Position Size and Risk-to-Reward
Risk-to-reward isn't a number that stands on its own. Three things move together as one package.
- The stop-loss location sets the distance of 1R. You set it by structure — "where does it break and prove me wrong" — not by an amount of money. The swing lows and highs it's based on are covered in Basics Swings and Trend (related lesson), and Part 2 covers why a stop placed just below the low gets you shaken out.
- Position size sets the dollar amount of 1R. In the ETH example above, 1R was a $35.7 distance. With 1 ETH, a stop-out would cost about $35.7; with 0.5 ETH, about $17.9. The distance is the same, but the dollar amount of 1R changes with your size. Part 3 covers the formula for sizing relative to your account.
- The target sets how many R you make. Target candidates such as the prior high and resistance are covered in Basics Support and Resistance (related lesson).
Above all, if your size is too big, you won't be able to pull the trigger at the stop you calculated.
"Run your positions with just 20% of the money you have, no more. … Your profits and your losses both get smaller. … You can't stop out because the loss gets too big. It's really simple." — Trader Steve, live stream, Oct 21, 2026 (translated from Korean) · ▶ Watch this moment (Korean audio)
If you can't take the stop, a loss you planned as 1R grows to -3R or -5R, and the risk-to-reward math stops meaning anything.
Key Takeaways
- The risk-to-reward ratio (R multiple) is reward ÷ risk, and the distance from entry to stop is 1R. Count results in R.
- For a long, it's (target - entry) ÷ (entry - stop); for a short, (entry - target) ÷ (stop - entry).
- The breakeven win rate is 1 ÷ (1 + risk-to-reward). Even at a 60% win rate, a 0.5R risk-to-reward gives negative expectancy.
- You can't call the direction, but you can choose the risk-to-reward before you enter.
- The stop sets the distance of 1R, and position size sets its dollar amount. The three are one package.
In Part 2, we'll cover how to place the stop-loss — the starting point of risk-to-reward — using swing lows, a buffer and the average true range (ATR).
If working out entries, stops and targets by hand for every market and every timeframe eats up your time, the Omnisight Report lays out those calculations for you.
This lesson adapts the text, figures and live-stream quotes of the Trader Steve TA series for the web, translated from the original Korean. Check the text and figure captions for the timing and interpretation of each real example, and read conceptual diagrams and real charts separately.
Corrections: support@omnisight.report