What Is Divergence Confirmation? Why You Shouldn't Enter Right Away
Historical examples for learning · not current prices or trade recommendations.
Contents
You hear "divergence has formed," you jump in right away, and the low breaks one more time. Most traders have been there at least once. This lesson uses charts to lay out one principle: divergence is only a warning, and you enter only after you've confirmed that price structure has actually changed. I'll cover the basic form of confirmation (a close beyond the neckline), its bearish mirror image, and invalidation, where the setup breaks before it is ever confirmed.
All dates and times are Korea Standard Time (KST, UTC+9). A daily candle is dated by its 09:00 KST open, and intraday examples are timed by the open of the KST candle.
1. Divergence Is the Warning, Confirmation Is the Trigger
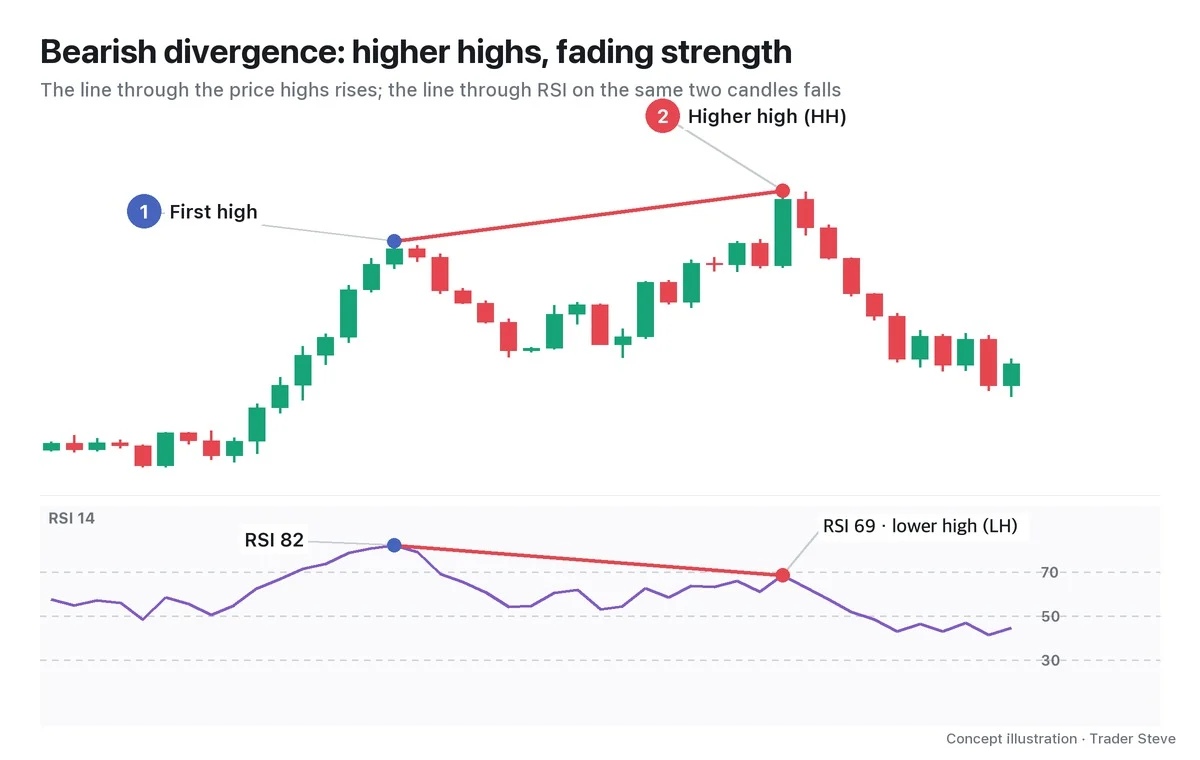
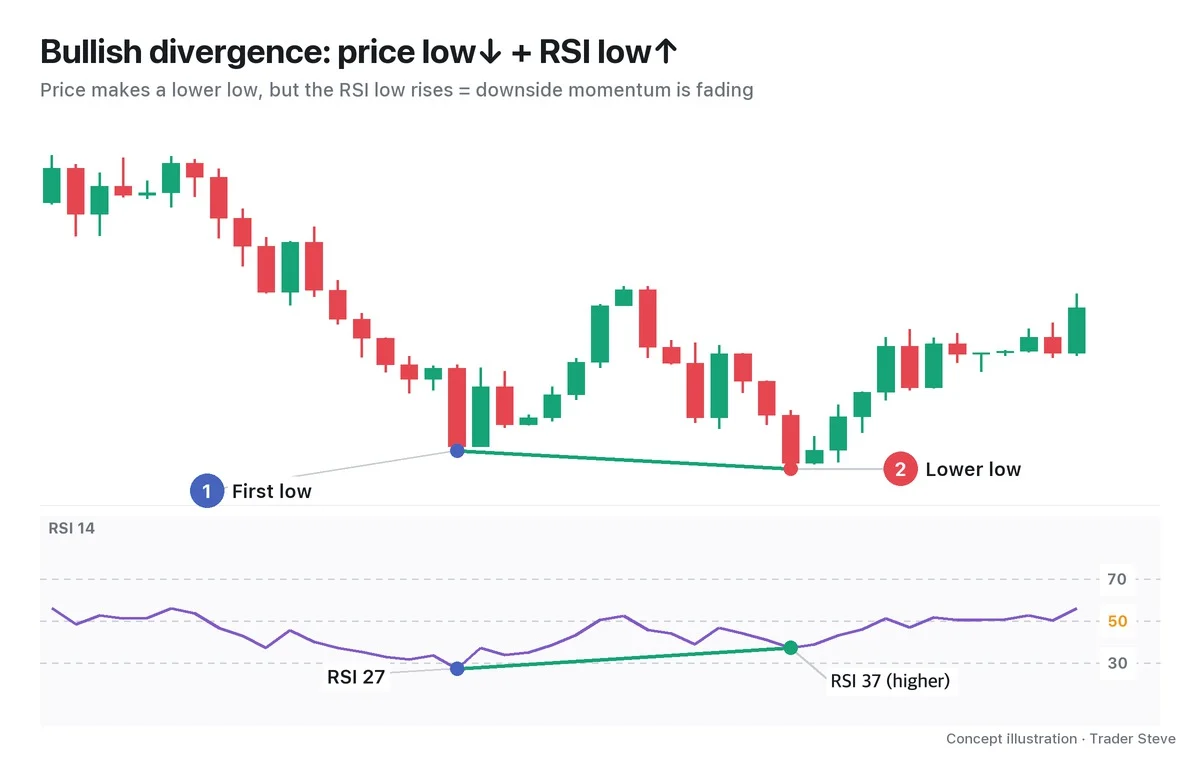
Divergence is when price makes a new low (or a new high) but an oscillator such as the Relative Strength Index (RSI) doesn't follow. A bullish divergence means "price went lower, but the selling pressure pushing it down is weaker than last time." If divergence itself is new to you, start with Divergence Basics Part 1 and the Divergence Regular topic.
You need to keep two signals apart here.
- Setup (the warning): the divergence. A warning that the momentum behind the current direction is fading.
- Trigger (the entry signal): the confirmation. On the live stream I call it the "confirm." It is the moment you see, on a close, that price structure has actually changed.
It's like a warning light on a car's dashboard. You don't pull over the instant it comes on. The light tells you to take a look; what you actually do depends on what you see next.
2. Why Not Enter Right Away: Weaker Force Is Not the Same as a Change of Direction
A bullish divergence tells you only that downside momentum has weakened. It does not tell you that price will now go up. Even with less momentum behind it, price can grind lower once more, or twice more. It is common for a third low to follow the second one, with another divergence forming at that point too.
"This is where you start going long. (…) But waiting until price gets to this spot is the hardest part. People can't wait for it, so they keep reaching for the knife while it's falling — and lose a finger, then a wrist, then the whole arm." — Trader Steve, live stream, Oct 12, 2026 (translated from Korean) · ▶ Watch this moment (Short, Korean audio)
The "spot" I mean, as I said just before this, was where price broke the trendline after the divergence and cleared the "BOS line" (BOS: break of structure). On the live stream I call that line the BOS line; in this series I call it the neckline, explained below, and call the move above it a change of character. Entering on divergence alone is catching a falling knife; waiting for confirmation is picking the knife up after it has hit the floor.
3. The Basic Form of Confirmation: A Close Beyond the Neckline = Change of Character
This series uses one basic confirmation: a close above the neckline.
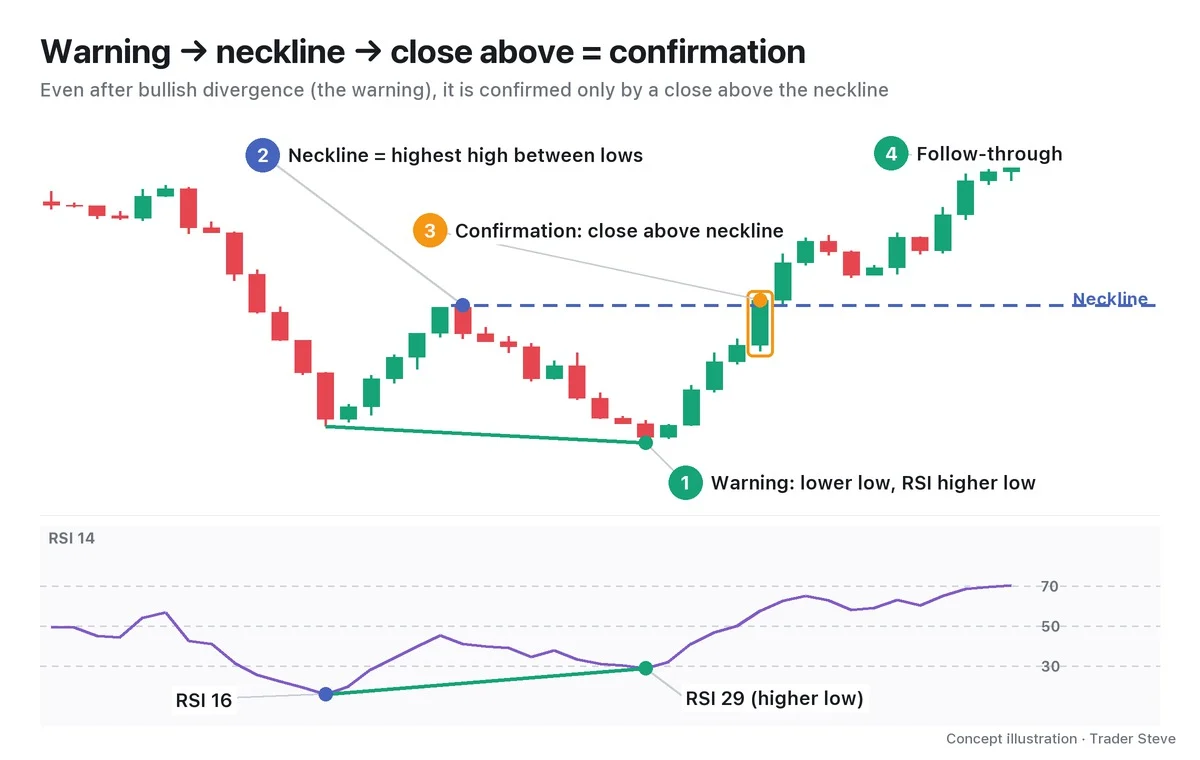
- Warning: the second low is below the first, but RSI on the same two candles rose from 16 to 29. That is a bullish divergence.
- Neckline: draw a horizontal line at the highest high of the candles between the two lows. It's the same level as the neckline of a double bottom.
- Confirmation: when a candle closes above this neckline, you have confirmation. During the decline, bounces failed to clear the most recent high; now, for the first time, price has cleared it. This is called a change of character (CHoCH), and in this course only a change of character that also meets the displacement condition is called a market structure shift (MSS). A break of a high in the same direction as the trend is distinguished as a break of structure (BOS) (see the ICT BOS and CHoCH topic).
- Follow-through: after confirmation, an uptrend follows in which both lows and highs rise.
The key word here is close. If a wick pokes through the neckline briefly and the candle closes below it, that is not confirmation. Until a candle closes, its RSI value keeps changing too. Part 2 covers the difference between a closing confirmation and a wick break in detail.
For a bearish divergence, flip this picture upside down.
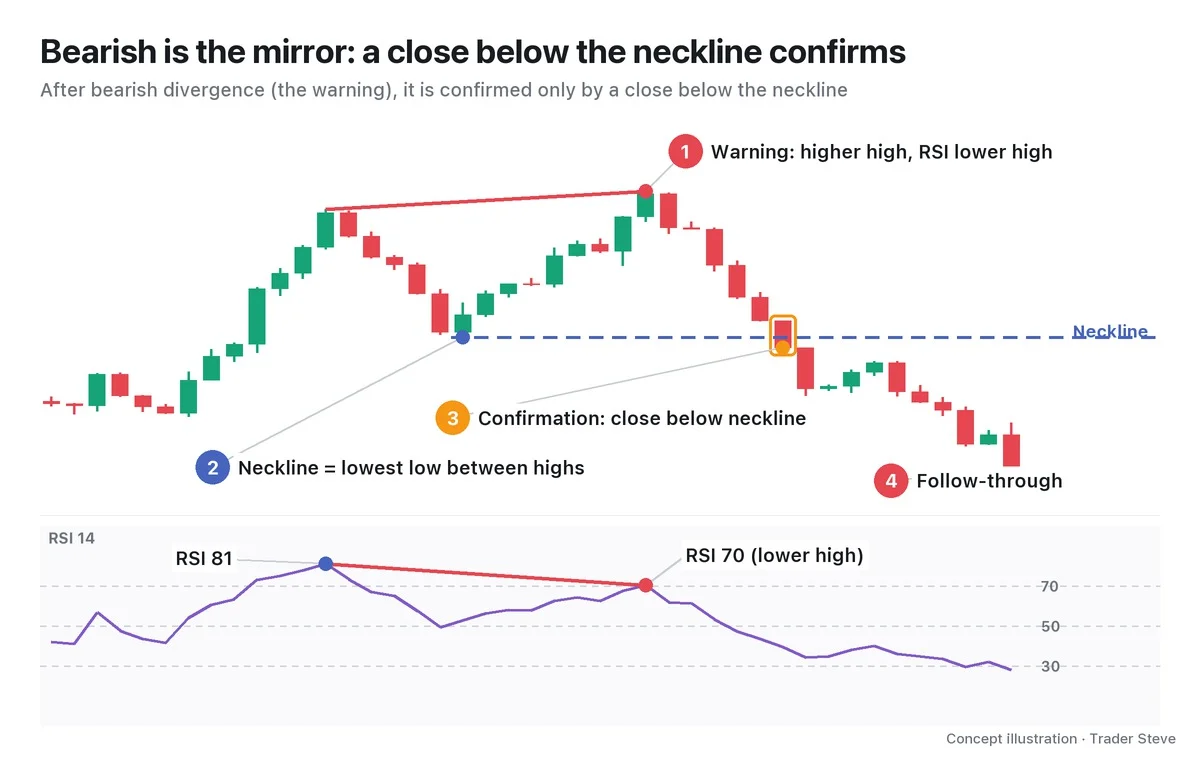
The price high rose, but the RSI high fell from 81 to 70. The neckline is the lowest low of the candles between the two highs, and you need a close below it for confirmation. Bullish: "a close above the neckline." Bearish: "a close below the neckline." Same principle.
4. If It Breaks Before Confirmation: Invalidation
The real reason to wait for confirmation is in this picture.
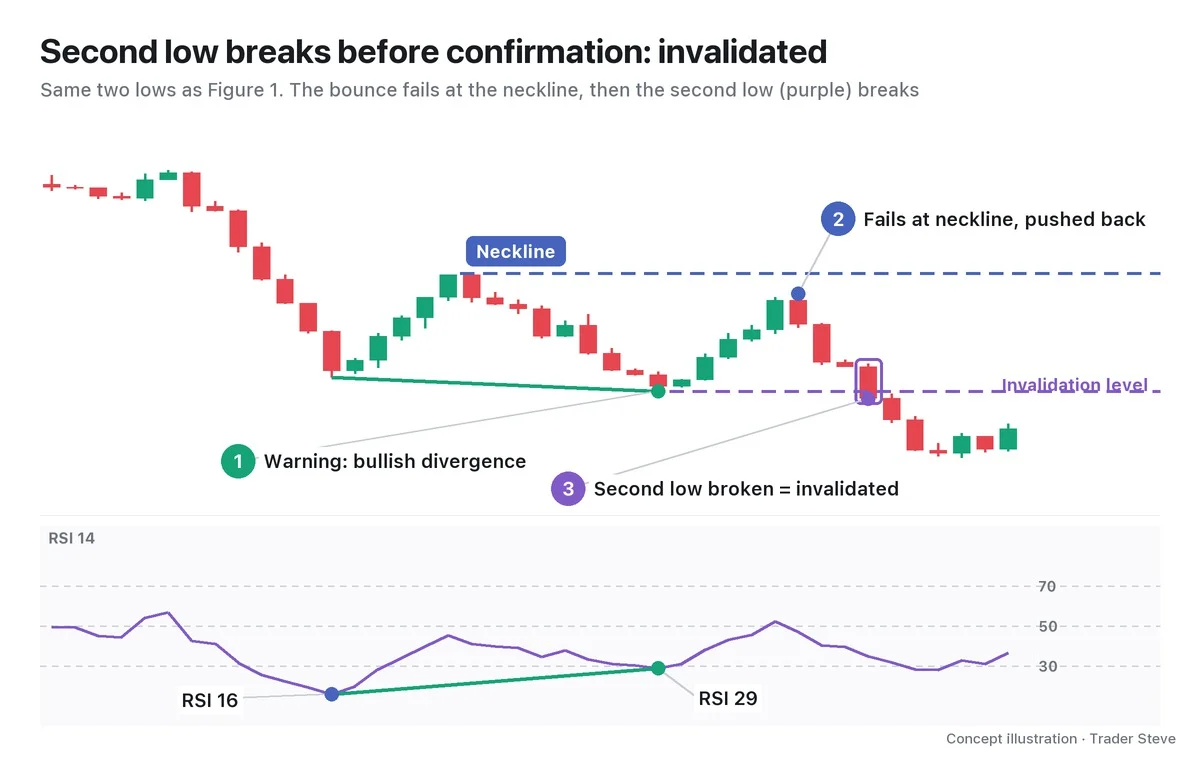
The two lows and the RSI values are exactly the same as in Figure 1. Up to that point, it was the same "divergence has formed." But this time the bounce turned down before reaching the neckline, and price ended up below the second low. This is called invalidation. On the live stream I describe it as "the divergence has been cancelled."
If you had entered at the second low on divergence alone, you'd have been stopped out; if you had waited for confirmation, you'd never have entered at all. Cases like this, which break before confirmation, are more common than you might think. Part 5 covers failure patterns and actual statistics.
5. On a Real Chart: BTC Daily, July 2026
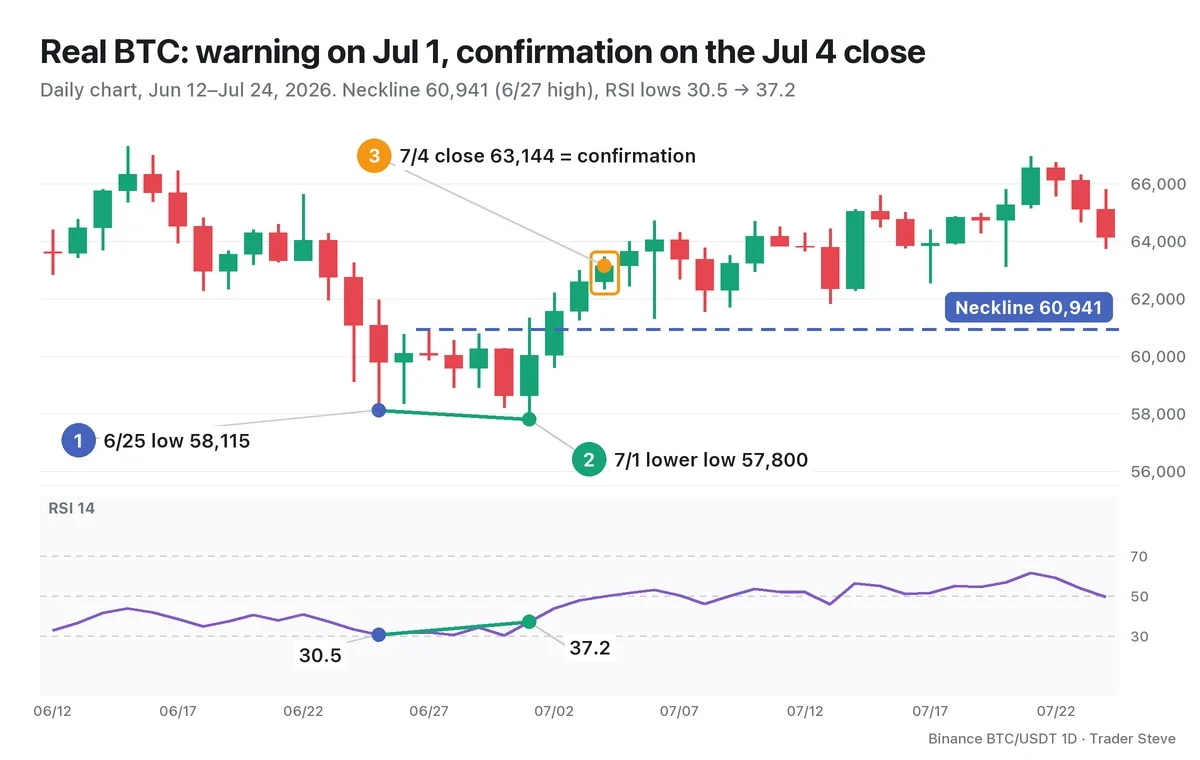
- Warning: on the Bitcoin (BTC) daily chart, Jun 25 low 58,115 (RSI 30.5) → Jul 1 low 57,800 (RSI 37.2). The price low was 0.5% lower, while the RSI low was higher.
- Neckline: the highest high between the two lows, the Jun 27 high of 60,941.
- Confirmation: the first close above the neckline came on Jul 2 (61,560). But for the Jul 1 low to be confirmed as a swing low — "lower than the 3 candles on each side" — the 3 candles after it have to close. So under this lesson's rules, confirmation was complete only with the Jul 4 close of 63,144. RSI that day was 49.9, and it moved above the 50 line the next day.
After that, the Jul 21 high was 66,956, 6.0% above the confirmation close. The lowest low after confirmation through Jul 24 was 61,307 on Jul 6, so price never touched the second low of 57,800 again.
There's one more thing to notice. The Jul 1 close of 60,024 was far below the 200-day exponential moving average (EMA 200, about 76,212). That means this bounce came while the larger trend was still down. Confirmation is evidence that the direction has started to change, not a guarantee that the larger trend has changed too. Cases that fail even after confirmation are covered in Part 5.
The Jul 1 low also appears in Divergence Basics Part 1 (related lesson). That part pairs it with the Jun 5 low to explain divergence itself; this part uses the Jun 25 → Jul 1 pair to show how late the neckline confirmation comes.
Key Takeaways
- Divergence is the warning (the setup); confirmation is the trigger. They are two different signals.
- Weaker momentum is not the same as a change of direction. The second low can break too.
- The basic confirmation is a close beyond the neckline = a change of character (CHoCH). A wick break is not confirmation.
- Bearish is the mirror image: a close below the lowest low between the two highs is the confirmation.
- If the second low (or high) breaks before confirmation, that divergence is invalidated.
In Part 2, we'll cover how to find the neckline, why confirmation is judged on the close, the types of confirmation signals, and an RSI 50 line checklist.
Checking divergence, changes of character and invalidation prices by hand on every timeframe takes a fair amount of time. The Omnisight Report lays this out for each market.
This lesson adapts the text, figures and live-stream quotes of the Trader Steve TA series for the web, translated from the original Korean. Check the text and figure captions for the timing and interpretation of each real example, and read conceptual diagrams and real charts separately.
Corrections: support@omnisight.report