What Is Multi-Timeframe Divergence? Weighing Higher vs. Lower TF Signals
Historical examples for learning · not current prices or trade recommendations.
Contents
Sometimes a divergence is crystal clear on the 1-hour chart while the daily chart shows nothing at all. Which one should you trust? This lesson explains why the same high or low can be a divergence on one timeframe and not on another, and how to read higher- and lower-timeframe signals differently.
All dates and times are Korea Standard Time (KST, UTC+9). A daily candle is dated by its 09:00 KST open, and intraday examples are timed by the open of the KST candle.
1. A Divergence Refresher, and MTF Divergence
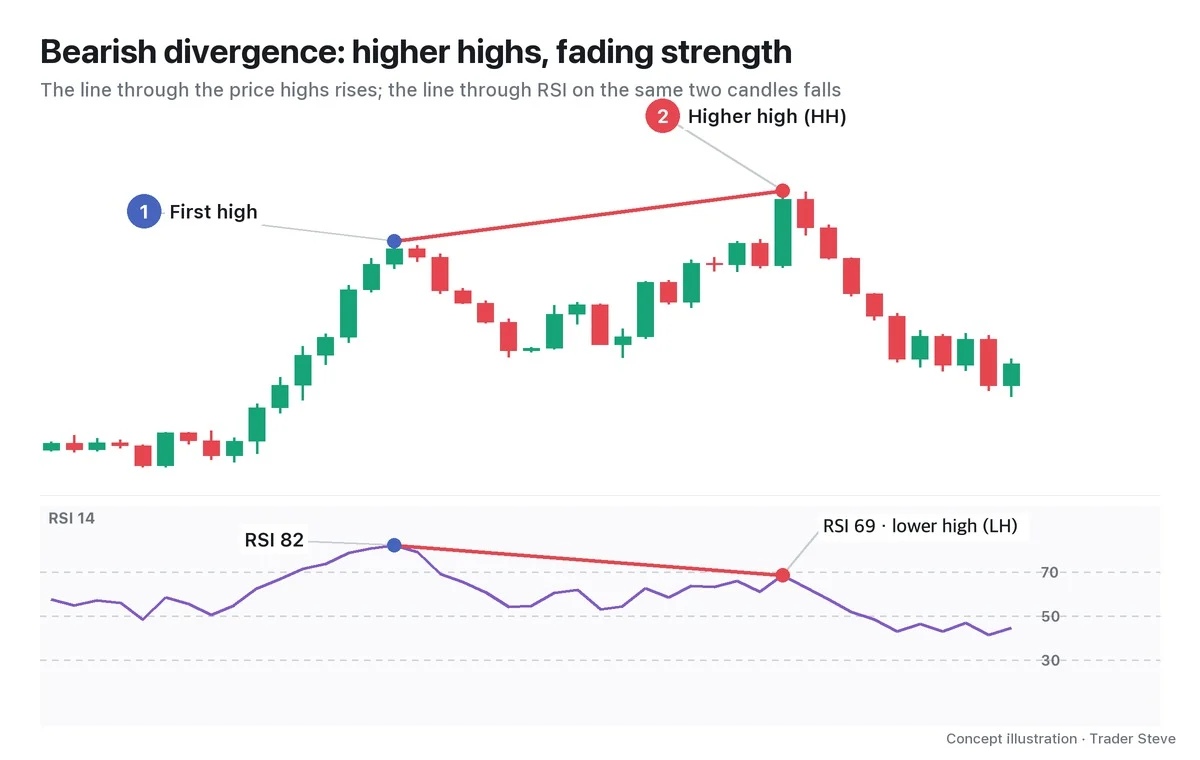
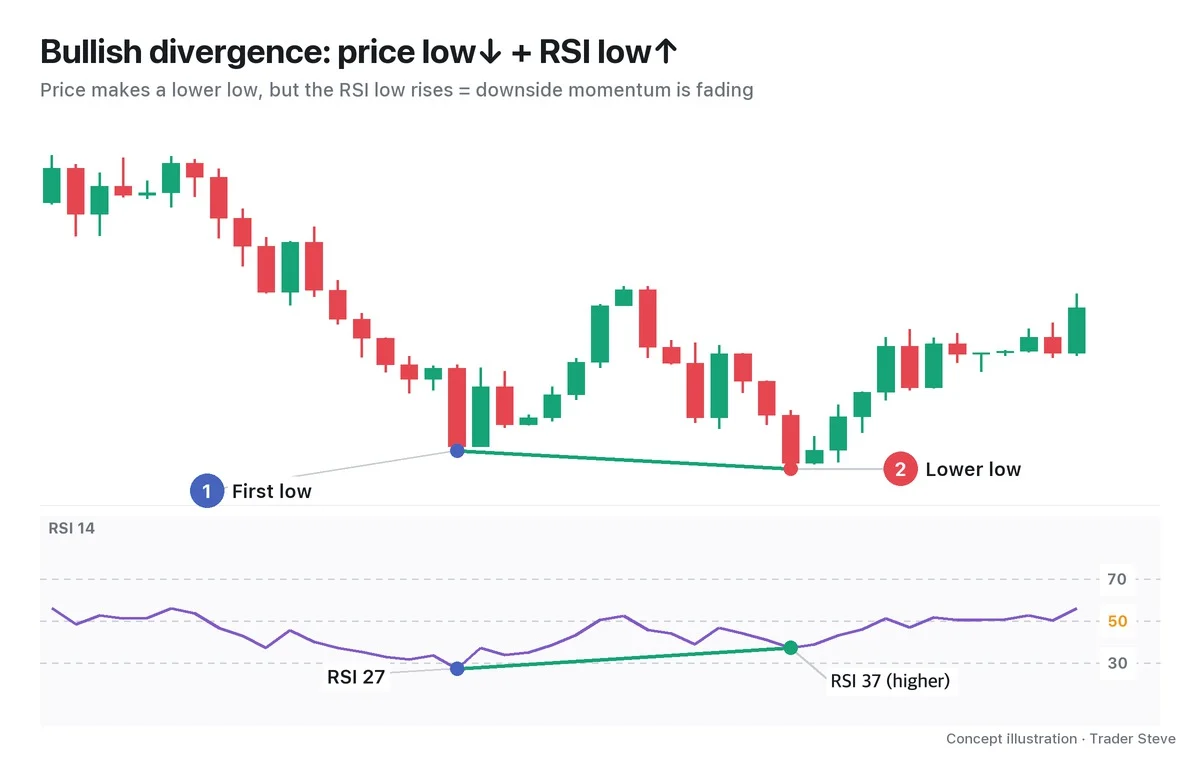
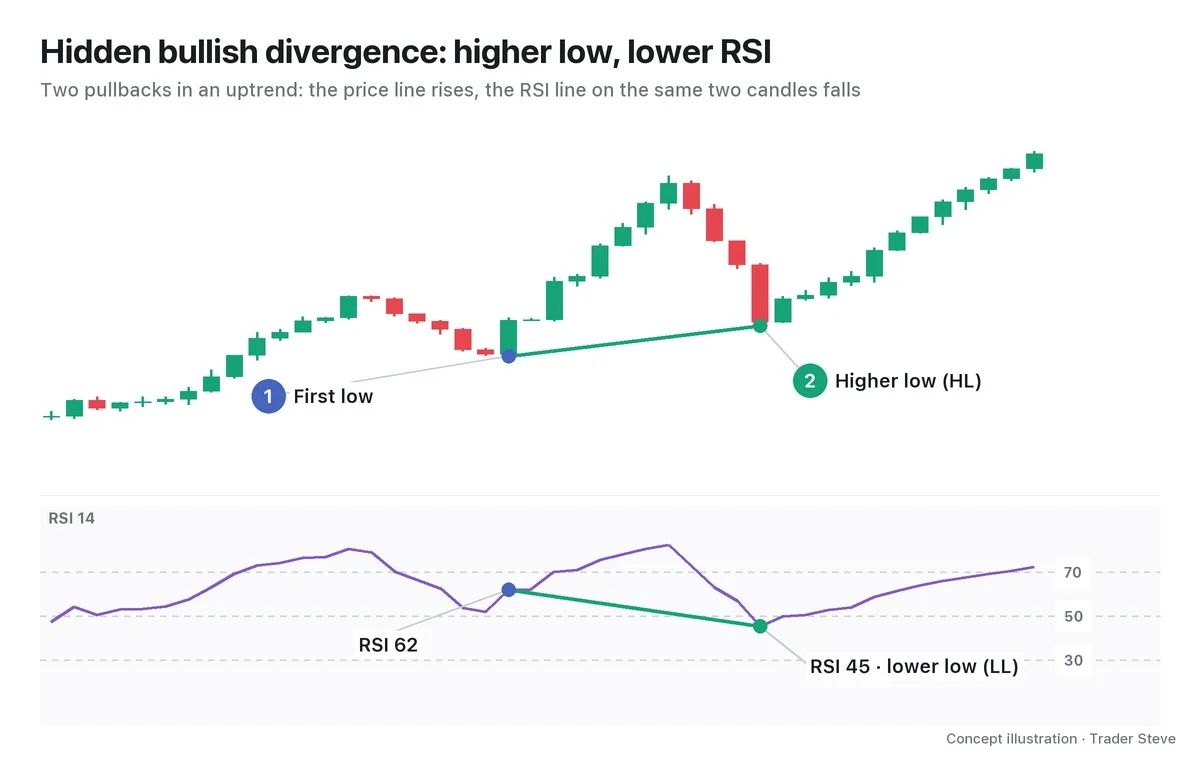
A divergence is when two price swings and the same two swings on the Relative Strength Index (RSI) move in opposite directions. If price makes a lower low while RSI makes a higher low, it's a bullish divergence; if price makes a higher high while RSI makes a lower high, it's a bearish divergence.
Multi-timeframe divergence (MTF divergence) means looking at the same price move separately on 2–3 timeframes (TF) and judging the weight of the signal by whether each TF has a divergence, which way it points and where they overlap. Throughout this series, higher timeframe is shortened to HTF and lower timeframe to LTF. The only indicator is RSI 14, and the default set is daily–4-hour–1-hour.
"What it means is there's a bullish divergence: price keeps falling and making lower lows, and momentum is actually improving. … The divergence is now pointing up — overall, it's set up in the upward direction across several timeframes." — Trader Steve, live stream, Oct 6, 2026 (translated from Korean) · ▶ Watch the stream highlights (Korean audio)
2. Why Each TF Looks Different: The 14 in RSI 14 Is a Candle Count
RSI 14 is the ratio between the up moves and the down moves over the last 14 candles. The 14 is a number of candles, not a length of time, so a 1-hour RSI looks at roughly the last 14 hours of momentum and a daily RSI looks at the last 14 days.
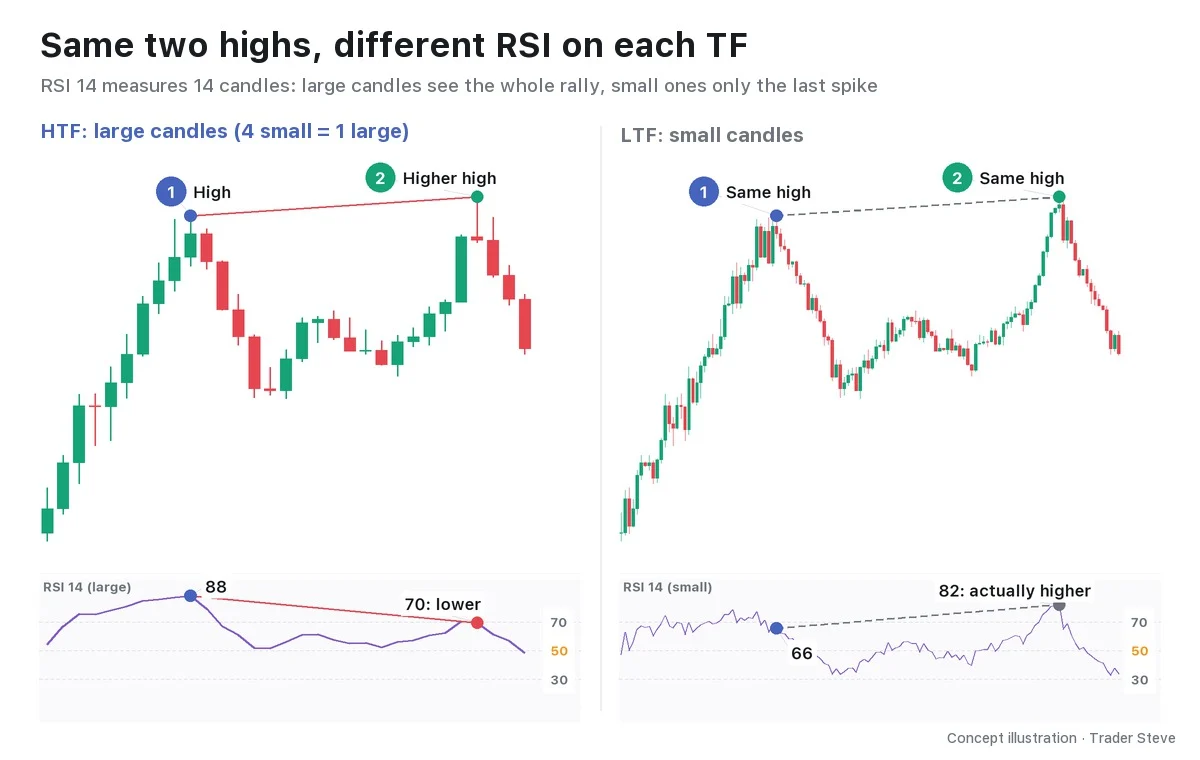
The chart is hypothetical: every 4 small candles are combined into 1 large candle, so price moves the same way in both panels.
- Large candles (HTF): the stretch up to the second high mixes a pullback with a long, slow recovery, and RSI sees that whole stretch. So RSI fell 88 → 70, and since price made a higher high, it's a bearish divergence.
- Small candles (LTF): right before the second high there was a short, steep spike. Only that spike fits inside RSI's window, so RSI actually rose 66 → 82.
Neither one is wrong. The HTF is saying "the momentum behind the longer move is fading," and the LTF is saying "the last few hours were strong." That's all.
3. LTF Signals Are Frequent and Light; HTF Signals Are Rare and Heavy
I counted divergences on Bitcoin (BTC) and Ethereum (ETH) from May 1 to Oct 24, 2026, using the same rules each time (swings with 3 candles on each side, the two swings at most 60 candles apart, regular RSI 14 divergence).
| Timeframe | BTC count | ETH count | BTC gap between the two swings (median) |
|---|---|---|---|
| 1H | 101 | 84 | 7 hours |
| 4H | 28 | 22 | 28 hours |
| 12H | 7 | 6 | 4 days |
| 1D | 3 | 5 | 6 days |
The 1-hour chart produced nearly 100 divergences in less than six months, and the two swings were usually within 7 hours of each other — small wiggles. Daily divergences can be counted on one hand, and each one reflects a change in a move that built up over more than 6 days. LTF signals are frequent and light; HTF signals are rare and heavy.
"Even now, on the short timeframe — this is the 1-hour, look. There's a blatant divergence on the short timeframe. … If you push it out to something like the 4-hour, there's a really blatant, huge divergence." — Trader Steve, live stream, Sep 2, 2026 (translated from Korean) · ▶ Watch the stream highlights (Korean audio)
If a signal you spot on the LTF is still visible when you "push it out" to the HTF, it covers more time and carries that much more weight.
4. Three Relationships: Alignment, Nested, Conflict
| Relationship | Meaning | How to read it |
|---|---|---|
| Alignment | Divergences in the same direction on several TFs at the same high or low | Carries the most weight |
| Nested | An LTF divergence forms again inside the HTF's second-swing zone | HTF = zone, LTF = timing |
| Conflict | An LTF divergence runs against the HTF trend and where HTF RSI sits relative to 50 | Read it as a bounce or pullback at most |
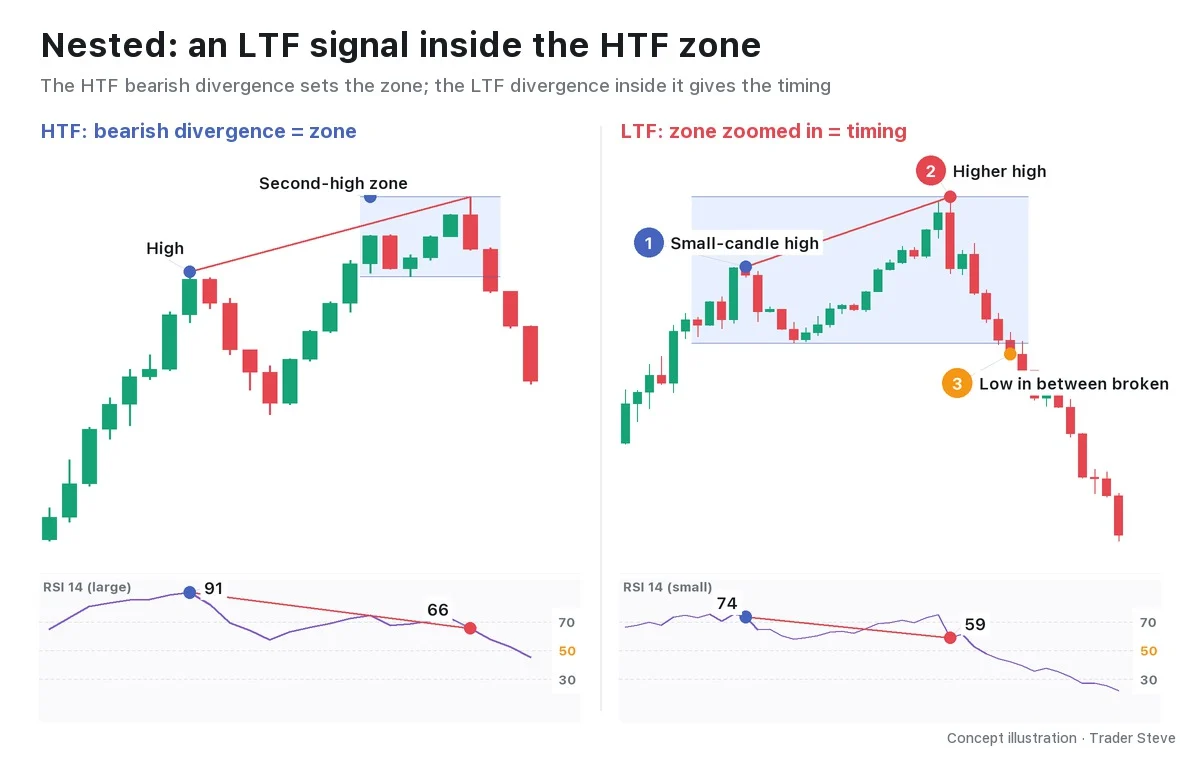
On the LTF, the HTF's "second high" isn't a single point but a zone of several candles. Inside that zone, ① a small-candle high and ② a higher high formed an LTF bearish divergence, and ③ a close below the low in between turned the direction.
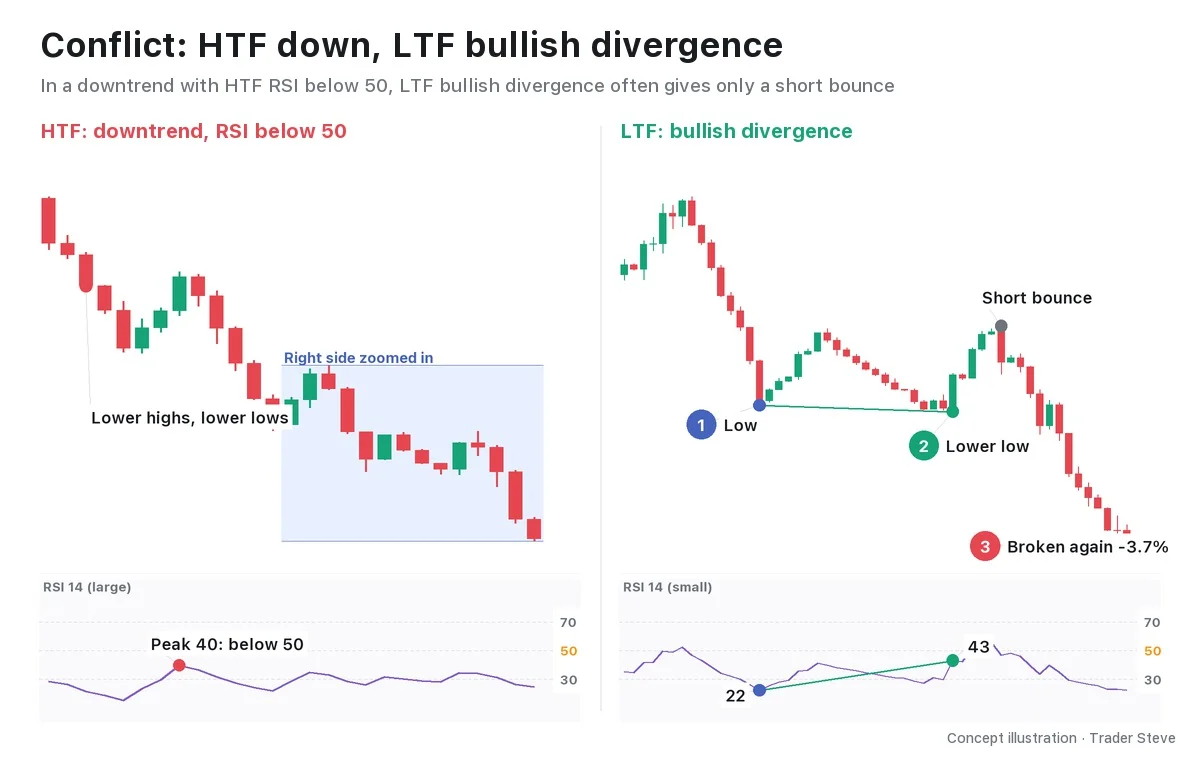
Conflict is the opposite case. The HTF is making lower highs and lower lows, and its RSI can't get above 50, yet the LTF prints a bullish divergence from ① a low to ② a lower low. The bounce was short, and ③ price broke the low again. In a case like this, read the LTF divergence as "price may pause for a moment," not as "the trend is turning."
5. Real BTC: Four TFs Pointing the Same Way at the Jul 1 Low
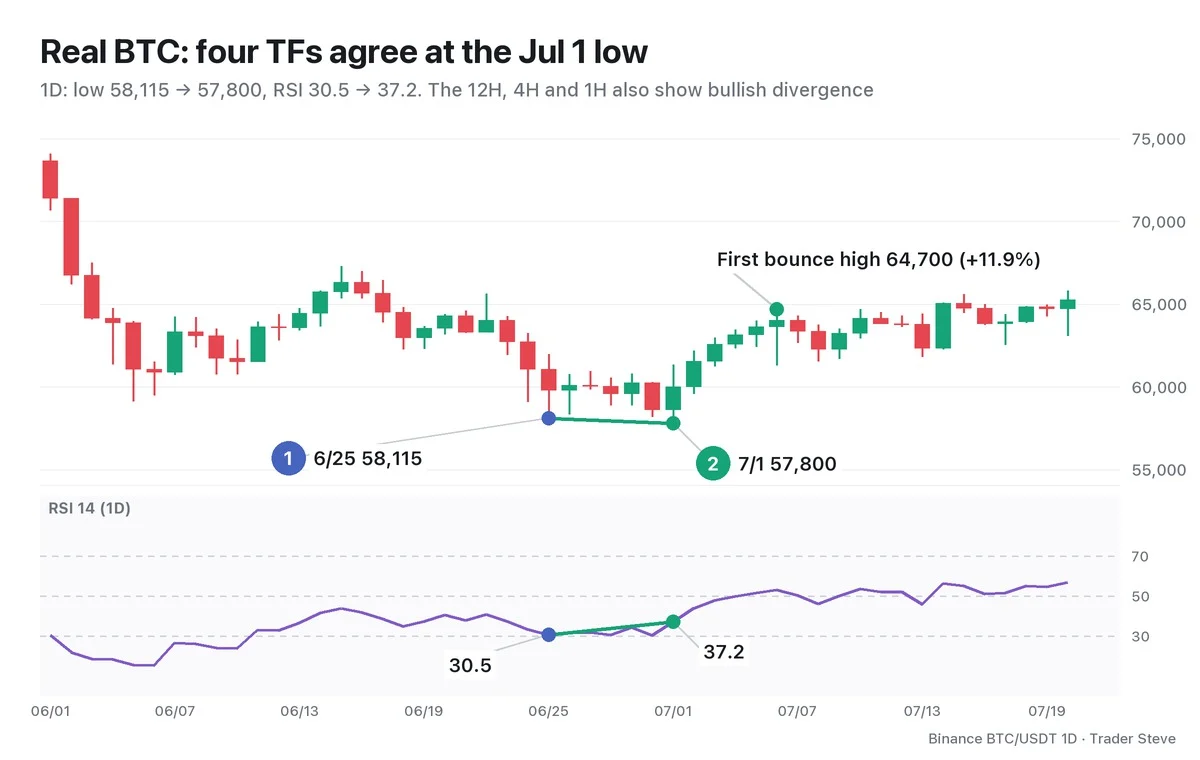
On the daily chart, the Jun 25 low of 58,115 (RSI 30.5) was followed by a lower low of 57,800 on Jul 1, but RSI was higher, at 37.2. Here is the same low on other TFs.
| Timeframe | First low → Jul 1 low | RSI 14 |
|---|---|---|
| 1D | 6/25 → 7/1 | 30.5 → 37.2 |
| 12H | 6/25 21:00 → 7/1 09:00 | 30.9 → 32.4 (small difference) |
| 4H | 6/25 21:00 → 7/1 09:00 | 32.4 → 43.5 |
| 1H | 7/1 00:00 → 7/1 10:00 | 30.0 → 43.7 |
All four TFs point the same way: alignment. On the 4-hour chart, a small Jun 29 low sits in between, so you only see the divergence when you connect the two lows directly (covered in Part 2).
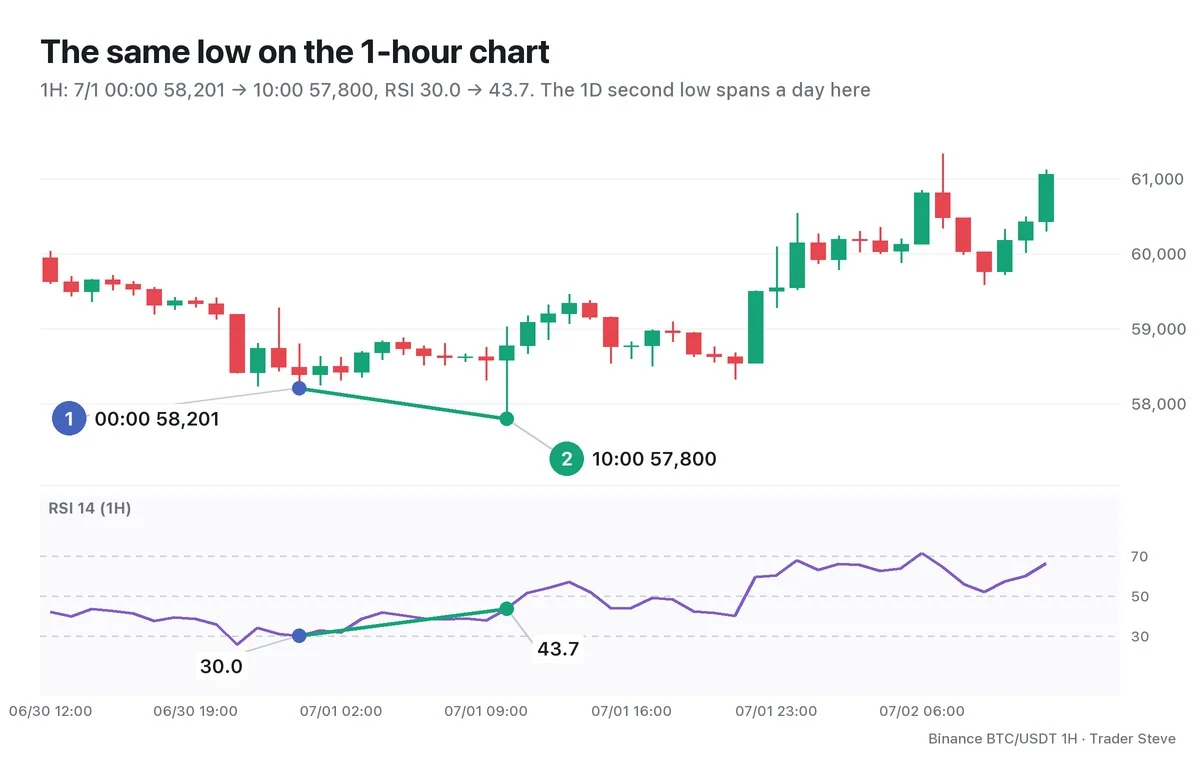
On the 1-hour chart, the daily second low is a zone a little over a day long, and another bullish divergence formed inside it. Alignment and nesting showed up in the same place. Afterward, the first bounce ran to 64,700 at 06:00 on Jul 7 (1-hour chart), a gain of 11.9%, and the daily low did not go below 59,588 through Aug 16.
That said, price chopped between 59,588 and 66,956 during that period, and the weekly RSI for the week of Jun 29 was 38.2, below 50. Weekly RSI first got above 50 in the week of Aug 17 (56.6). The aligned divergence helped hold the low, but the confirmation of the bigger trend was HTF RSI 50. Of course, that's hindsight; on Jul 1, there was no way to know what came next.
The same Jul 1 low is also used in Divergence Basics Part 1 (related lesson), paired with the Jun 5 low, to explain divergence itself. Here the 6/25→7/1 lows are read through how direction differs across timeframes.
Key Takeaways
- MTF divergence looks at the same move on several TFs and judges its weight by whether a divergence is there, which way it points and where the TFs overlap.
- The 14 in RSI 14 is a candle count, so the same high or low can be a divergence on one TF and not on another.
- LTF divergences are frequent and light; HTF divergences are rare and heavy.
- Alignment adds weight; in a nested setup, HTF = zone and LTF = timing; a conflict is read as a bounce at most.
- Divergence is a warning. Confirm the direction by where HTF RSI sits relative to 50.
In Part 2, we'll cover how to choose a TF set, the 5-step order for searching from the higher TF down, and the rule for confirming on the candle close. Divergence itself is covered in the Divergence · Basics and Divergence · Regular topics, and the timeframe concept in Basics · Multi-Timeframe Analysis. If lining up several TFs by hand every time is a chore, the Omnisight Report below does it for you, market by market.
This lesson adapts the text, figures and live-stream quotes of the Trader Steve TA series for the web, translated from the original Korean. Check the text and figure captions for the timing and interpretation of each real example, and read conceptual diagrams and real charts separately.
Corrections: support@omnisight.report