Elliott Wave's Three Cardinal Rules: How Rules Differ From Guidelines
Historical examples for learning · not current prices or trade recommendations.
Contents
Put the same chart in front of two people, and one calls it wave 3 while the other calls it wave 4. That is Elliott Wave. This lesson sums up, one sentence each, the three cardinal rules that cut down that confusion, and uses figures to show why rules and guidelines carry completely different weight.
All dates and times are Korea Standard Time (KST, UTC+9). A daily candle is dated by its 09:00 KST open, and the time shown for an intraday candle is the time that candle opens. The actual intraday time of a high or low is stated separately.
1. Same Chart, Different Counts: Why We Need Rules
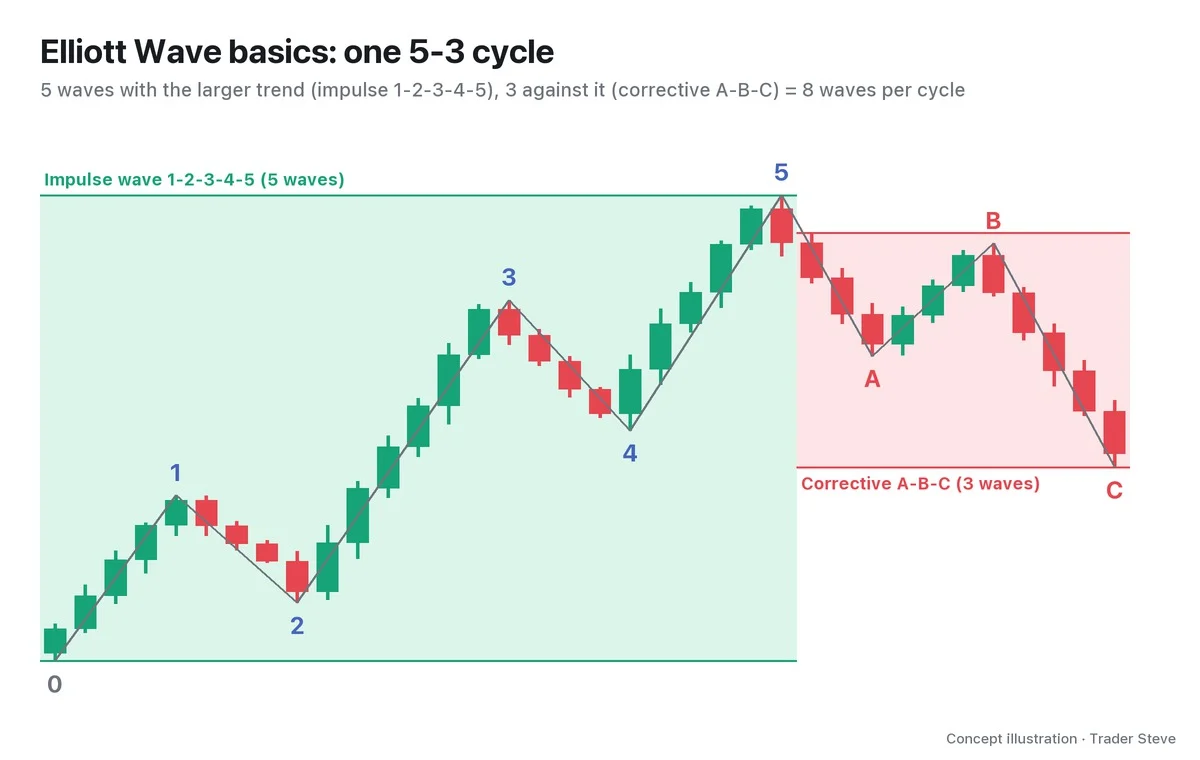
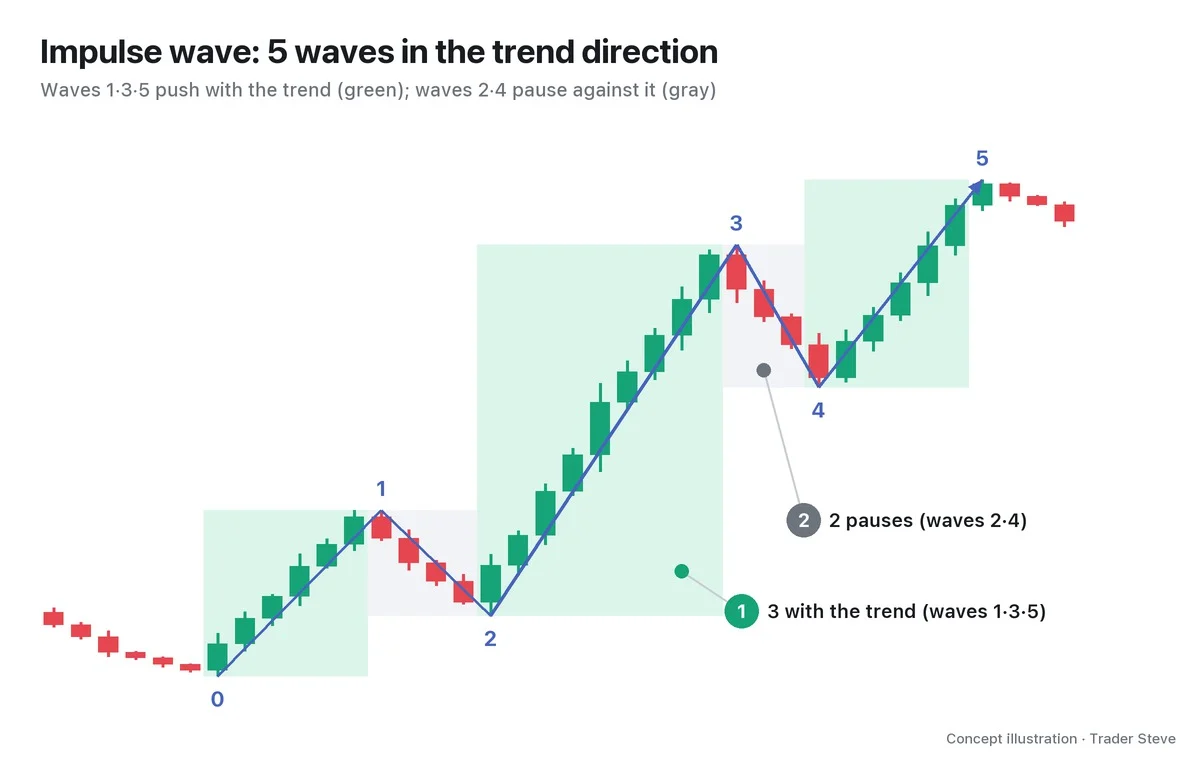
Elliott Wave theory was laid out by Ralph Nelson Elliott in the 1930s. It holds that price advances in five waves in the direction of the trend and retraces in three waves against it. Together, the five waves in the trend direction form an impulse wave, and the waves that retrace them form a corrective wave.
The problem is that the person looking at the chart decides where wave 1 starts. I've said many times on the live stream that this is why I don't use Elliott Wave as my main lens.
"Something like Elliott Wave is whatever you make of it… If it gets cut off partway, it's a truncation. You're not supposed to break into a certain zone, but there's this exception. It's the kind of theory that always has exceptions, exceptions, exceptions, so…" — Trader Steve, live stream, Aug 20, 2026 (translated from Korean) · ▶ Watch the stream highlights (Korean audio)
Even so, Elliott Wave does draw clear lines that say "you can't count it this way." The "zone you're not supposed to break into" in that quote is one of them. Respecting those lines alone filters out a good share of arbitrarily assigned numbers.
2. How Rules Differ From Guidelines
Elliott Wave works with two kinds of criteria.
| Type | Meaning | If it's broken |
|---|---|---|
| Rule | A definition every impulse wave must satisfy | The count is not an impulse wave → count again |
| Guideline | A tendency: it often turns out this way | The count survives, but it carries less weight |
A rule is a matter of definition, not probability. If you keep a count that breaks a rule alive as "an exception this time," you can put any number you like on any move. A guideline is the opposite: you don't throw a count away because a guideline doesn't fit. Mixing the two up is the most common mistake.
3. The Three Cardinal Rules at a Glance
Written for a rising impulse wave, they read as follows. For a falling impulse wave, just flip up and down.
- Rule 1: Wave 2 never goes below the start of wave 1. In other words, wave 2 never retraces more than 100% of wave 1.
- Rule 2: Wave 3 is never the shortest of waves 1, 3 and 5. Length is measured in price, not time.
- Rule 3: Wave 4 never overlaps the price territory of wave 1. The wave 4 low must stay above the end (high) of wave 1; if it drops below, that is called an overlap.
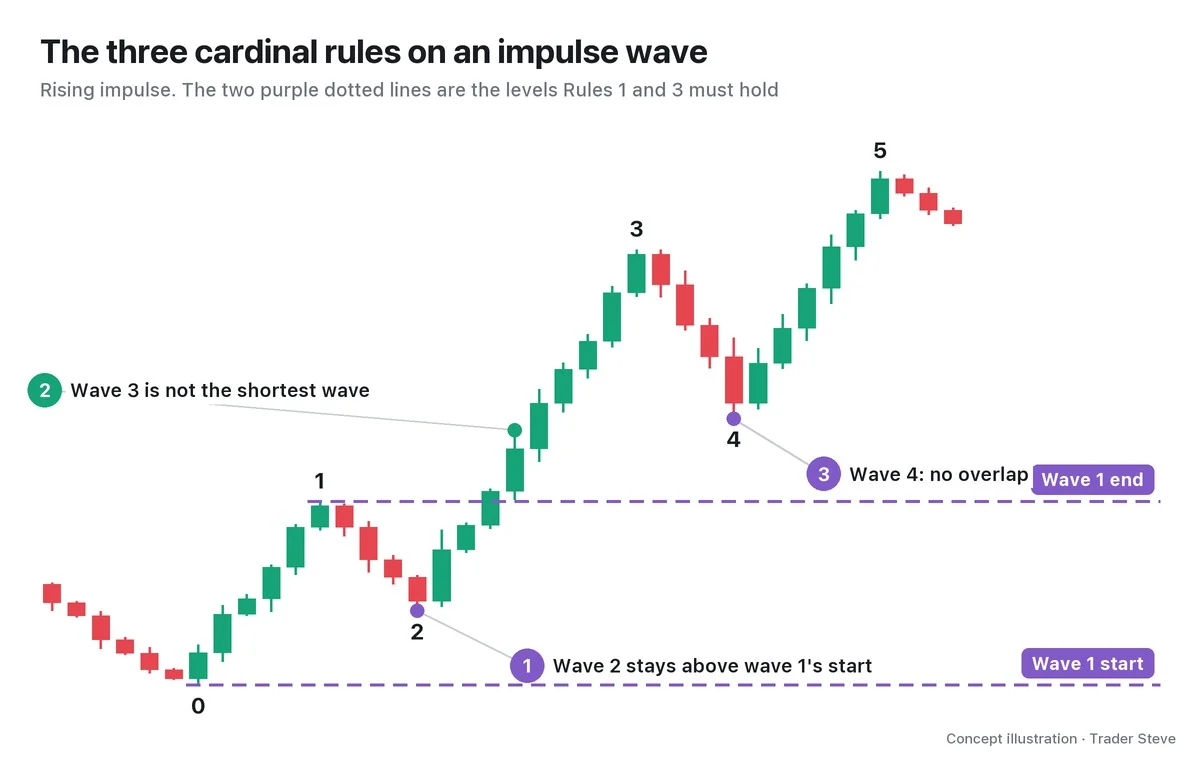
Rules 1 and 3 each boil down to a single price line: the start of wave 1 for wave 2, and the end of wave 1 for wave 4. If price crosses that line, the count is invalidated. How to use that line as a stop-loss level is covered in Part 3.
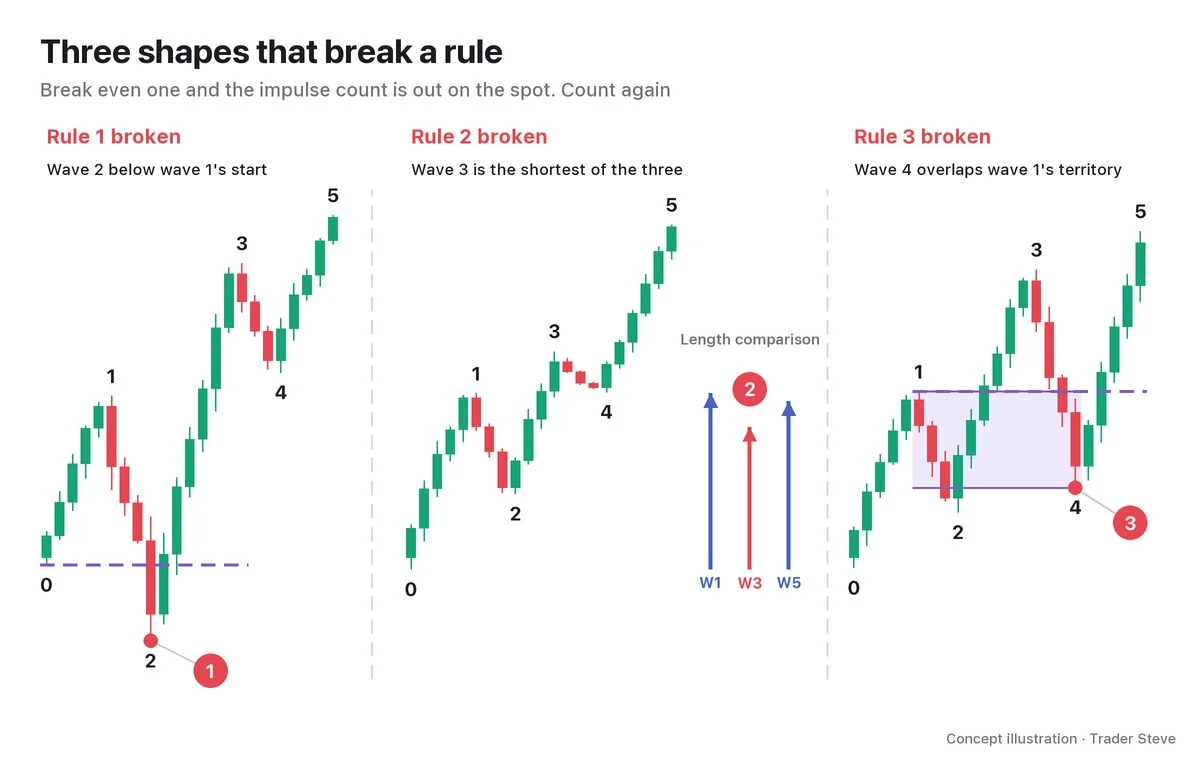
In the middle figure, wave 3 does get past the end of wave 1, but line up the lengths of waves 1, 3 and 5 side by side and wave 3 is the shortest, so it breaks Rule 2. A shape like the one on the right, where wave 4 drops into wave 1's territory, is in principle not an impulse wave either. The exception is the wedge-shaped diagonal, where an overlap between wave 4 and wave 1 is allowed. That exception is covered in the Elliott Wave Diagonals topic (related lesson).
4. The Market Logic Behind Each Rule
Each of the three rules carries a piece of common sense about trends. In the end, Elliott Wave also sits on top of Dow Theory, which asks whether highs and lows are rising.
"Take the most extreme case within Dow Theory, and that's Elliott." — Trader Steve, live stream, Aug 27, 2026 (translated from Korean) · ▶ Watch the stream highlights (Korean audio)
- Rule 1 (an uptrend has to hold its low): If wave 2 drops below the start of wave 1, that "wave 1" wasn't the start of a new advance. It was just a bounce inside a decline. The higher low was broken from the very start.
- Rule 2 (wave 3 is the core of the trend): Wave 3 is where the most participants pile in. If wave 3 were shorter than both wave 1 and wave 5, the center of the trend would be empty.
- Rule 3 (an overlap means a range, not a trend): Wave 4 reaching down into wave 1's territory means price is going back and forth over ground it has already covered. That looks more like a range or a correction than a trend moving forward.
Let's look at it once on the Bitcoin (BTC) daily chart.
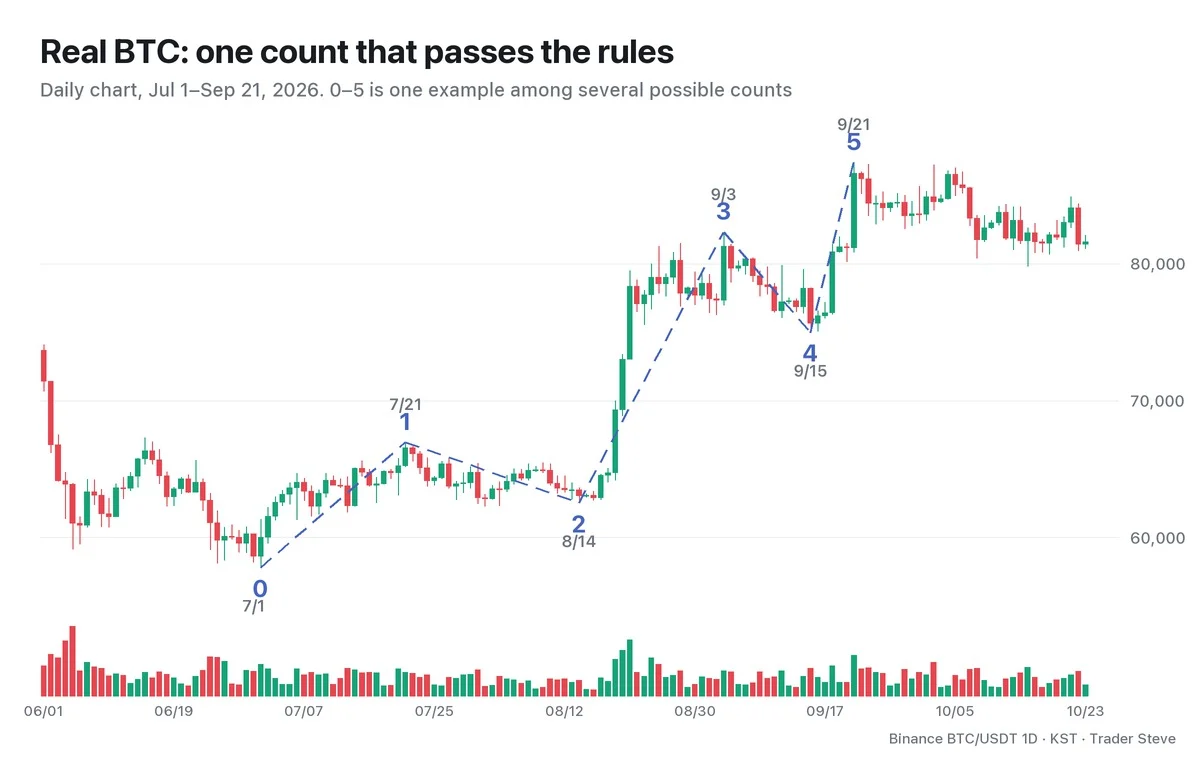
With the Jul 1 low as 0 and the Sep 21 high as 5, the count passes all three rules. The lowest low in the wave 2 segment (Aug 1) is above the Jul 1 starting point, and wave 3, from Aug 14 to Sep 3, is the longest of the three. The Sep 15 wave 4 low also stopped well above the Jul 21 wave 1 high. Still, passing the rules means "you're allowed to count it this way," not "this is the right answer." Checking the lengths and margins in numbers continues in Part 4.
5. A Preview of the Guidelines: Often, Not Always
If the rules are what erase counts, the guidelines decide which of the surviving counts to put more weight on.
| Guideline | One-line definition | More detail |
|---|---|---|
| Alternation (guideline of alternation) | If wave 2 is sharp, wave 4 goes sideways, and vice versa | elliott/alternation |
| Extension | One of waves 1, 3 and 5 stretches out; in crypto it is commonly wave 3 | elliott/extension |
| Equality | When wave 3 extends, waves 1 and 5 tend to be similar in length | elliott/fib-relationships |
| Retracement depth | Wave 2 retraces deep, 0.5–0.618; wave 4 retraces shallow, 0.236–0.382 | basics/fibonacci |
| Channeling | Draw a line parallel to the 0-2 line through the end of wave 1 to gauge the range | elliott/channeling |
| Volume and momentum | They tend to peak in wave 3 and weaken in wave 5 | elliott/wave-personality |
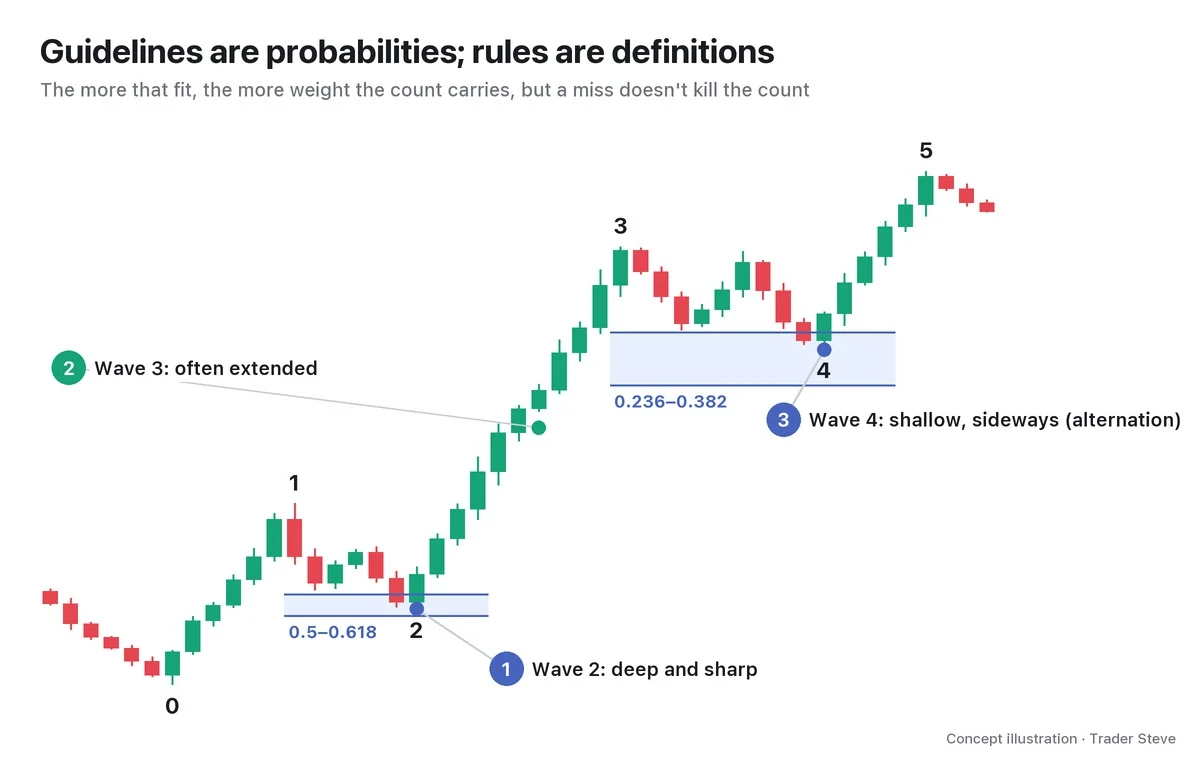
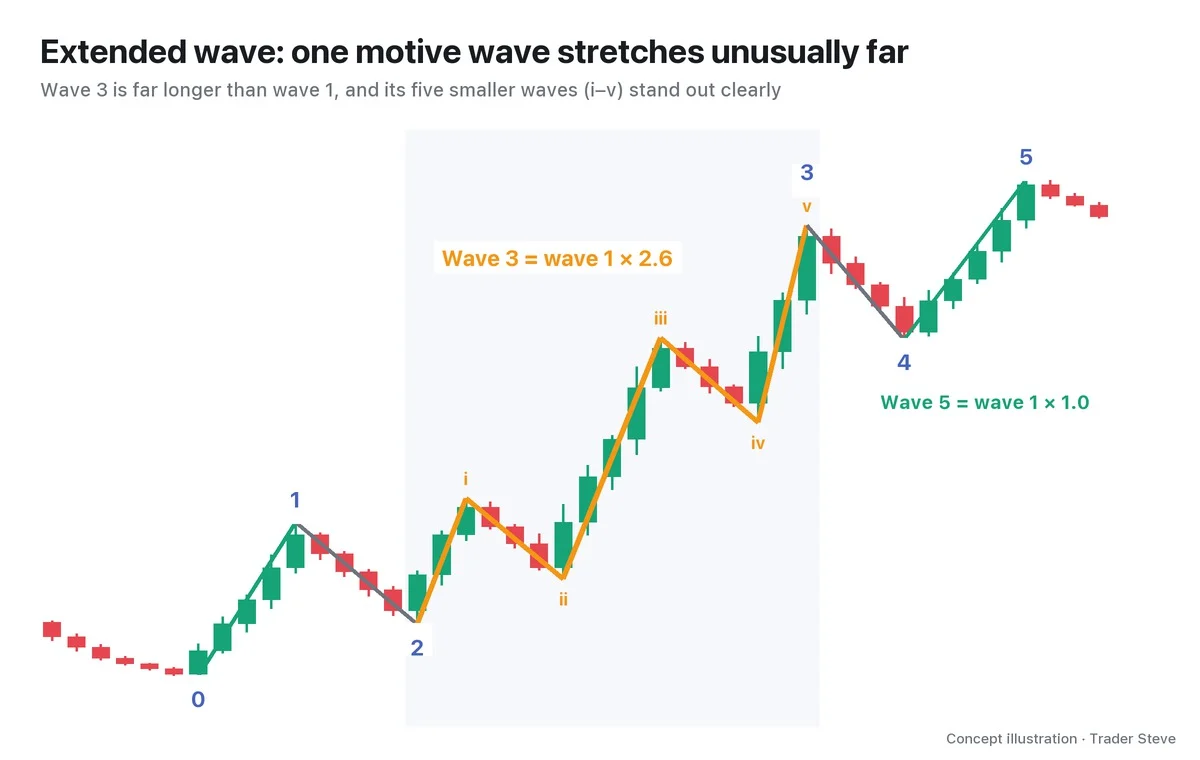
One pair of sentences must be kept apart. "Wave 3 is never the shortest" is a rule; "wave 3 is the longest" is a guideline. Even if wave 3 is shorter than wave 1, the impulse wave still stands as long as wave 3 is longer than wave 5 (Parts 2 and 5 revisit this). A truncation, where wave 5 fails to get past the wave 3 high, is also accepted as a valid count as long as it follows the rules (see Elliott Wave Truncation, elliott/truncation).
If the 5-3 structure and wave degree are new to you, start with Elliott Wave Basics Part 1 (related lesson); if higher highs and higher lows feel unfamiliar, start with Basics Swings and Trend (related lesson). This lesson will read much more easily after that.
Key Takeaways
- A rule is the definition of an impulse wave. Break even one, and you throw the count away and count again.
- The three cardinal rules: ① wave 2 never goes below the start of wave 1; ② wave 3 is never the shortest of waves 1, 3 and 5; ③ wave 4 never overlaps wave 1's territory.
- Rules 1 and 3 become price lines (the start of wave 1 and the end of wave 1), and those lines are the count's invalidation prices.
- A guideline means "it often turns out this way." The count survives when one doesn't fit, and it gains weight the more of them fit.
- "Wave 3 is the longest" is a guideline; "wave 3 is never the shortest" is the rule.
In Part 2, we'll cover the points that trip people up when they actually apply the three rules (wicks vs. closes, the diagonal exception) and a wave-count checklist.
Matching counts, invalidation lines and Fibonacci levels by hand for every market takes a fair amount of time. The Omnisight Report, linked below, lays that process out for you.
This lesson adapts the text, figures and live-stream quotes of the Trader Steve TA series for the web, translated from the original Korean. Check the text and figure captions for the timing and interpretation of each real example, and read conceptual diagrams and real charts separately.
Corrections: support@omnisight.report