What Is the Bat Pattern? The 0.886 Retracement and XABCD Structure
Historical examples for learning · not current prices or trade recommendations.
Contents
Of all the harmonic patterns, the Bat pattern is the one that looks for a reaction at the deepest point. This lesson uses diagrams and a real Ethereum (ETH) chart to explain what the Bat is, why it waits for a retracement as deep as 0.886, and why that depth is actually an advantage.
All dates and times are Korea Standard Time (KST, UTC+9). A daily candle is dated by its 09:00 KST open. Intraday times are the open time of each hourly candle.
1R is the risk distance from your entry price to the stop price you set in advance. Risk-to-reward is the target distance ÷ the risk distance, written as nR.
1. The One-Line Definition: A Shallow B and a Very Deep D
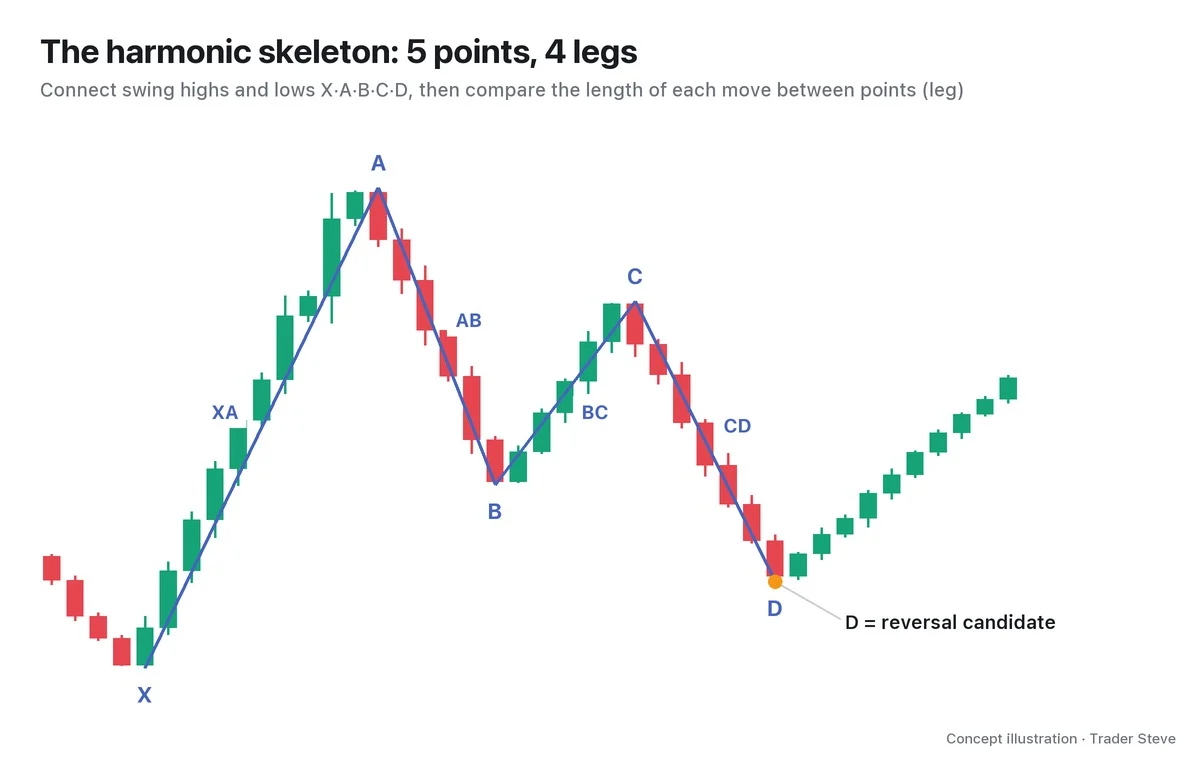
The Bat pattern is an XABCD retracement pattern generally credited to Scott Carney, who laid it out around 2001. You connect five swing highs and lows (X, A, B, C, D) and check the shape by the length ratios of its four legs (XA, AB, BC, CD). The basics of marking the five points and measuring the leg ratios are covered in Harmonic Basics.
Two rules separate the Bat from other patterns:
- A shallow B: the first retracement (AB) stops within 0.382–0.5 of XA.
- A very deep D: the final leg (CD) comes down to 0.886 of XA. That is just inside X — almost a full retracement.
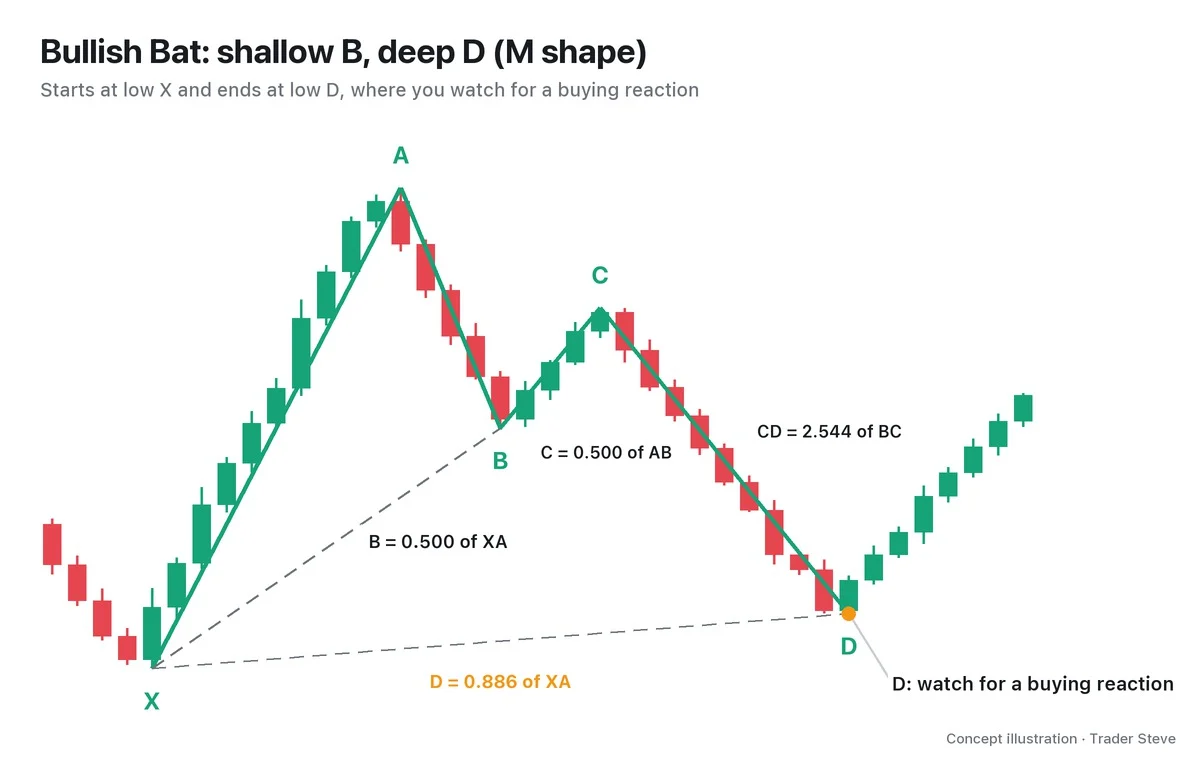
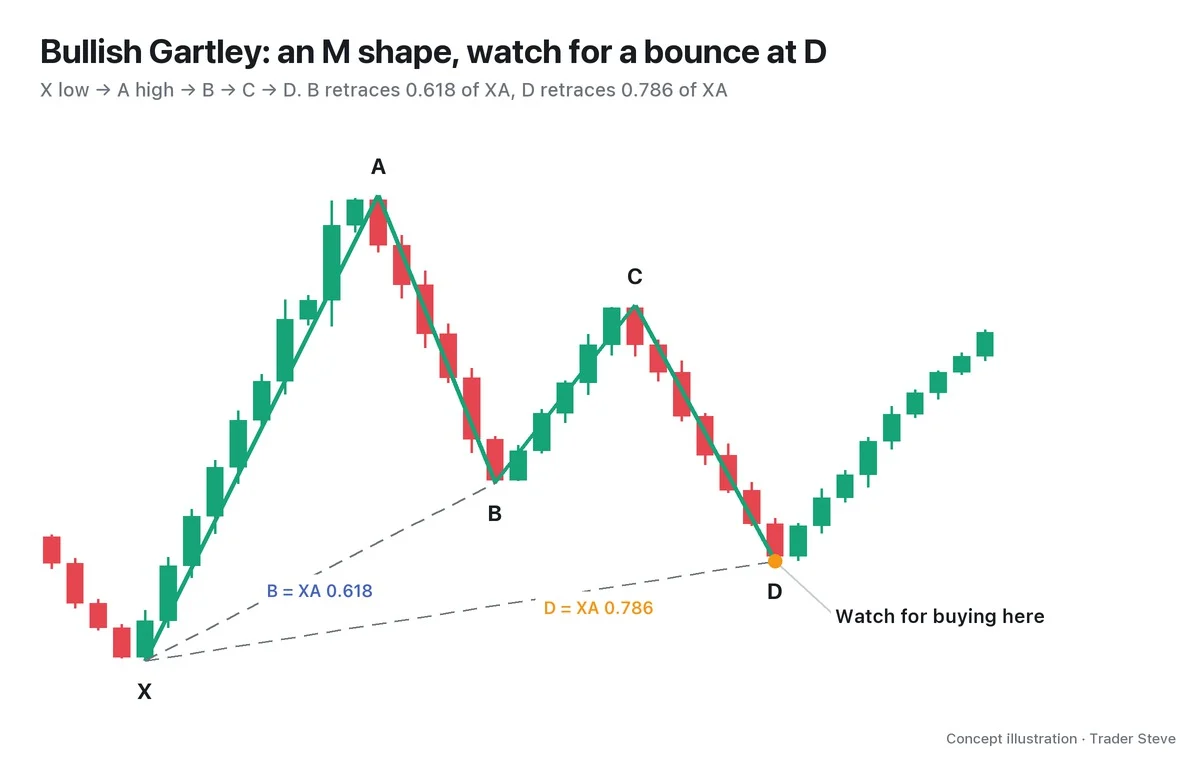
In the diagram's concept numbers, if the rise from X to A is 100, B retraces only half of it and D retraces 88.6. C can sit anywhere from 0.382 to 0.886 of AB (0.5 in the diagram), and CD stretches out to 1.618–2.618x BC (2.544 in the diagram). If B is at 0.618, start by comparing the setup with a Gartley; if it is at 0.786, with a Butterfly. B is the first filter that narrows down the candidates, and the D, BC and CD conditions also have to meet each pattern's criteria before you put a name on it.
2. The Bullish Bat (M) and the Bearish Bat (W)
Like other harmonic patterns, the Bat comes in two directions.
| Type | Point order | Shape | What you watch for at D |
|---|---|---|---|
| Bullish Bat | X low → A high → B → C → D low | M | a buying reaction |
| Bearish Bat | X high → A low → B → C → D high | W | a selling reaction |
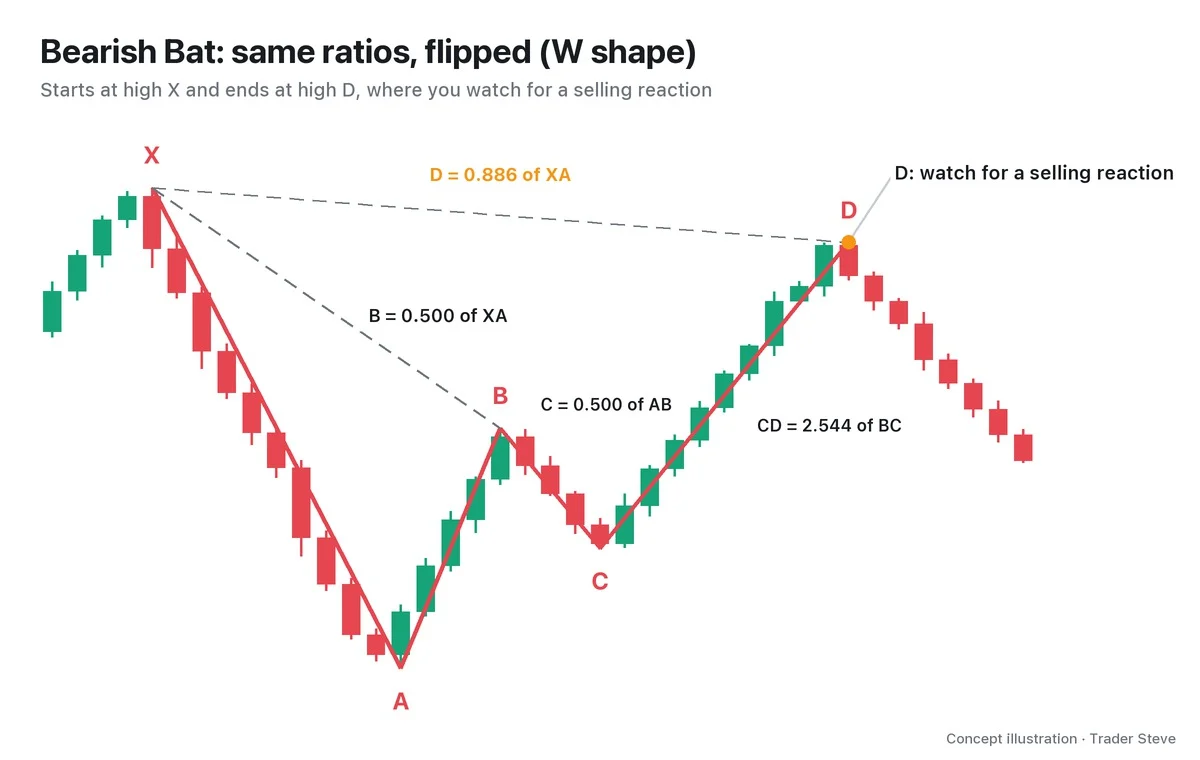
The ratio rules are identical; only the direction is reversed. In a bullish Bat, D is a low just above X; in a bearish Bat, D is a high just below X. Either way, D is not a confirmed signal — it is a candidate zone where you watch for a reaction.
3. Why 0.886: The "Surely Not That Far" Zone
0.886 is one step deeper than the 0.786 Fibonacci retracement (Fibonacci ratios themselves are covered in the Basics topic "Fibonacci"). Traders who expected price to hold at 0.618 or 0.786 mostly give up once price pushes below those levels — "it's over this time." 0.886 is where price sits after all of that surrendered supply has come out, the level where even someone watching the chart thinks, "Surely not that far."
"Going by the order block alone, even a spot like this could work. The 0.88 line… a spot like that is way too violent. All the way down there? I really can't bring myself to." — Trader Steve, live stream, Sep 2, 2026 (translated from Korean) · ▶ Watch the stream highlights (Korean audio)
I'm not talking about the Bat pattern here. I'm looking at a deep retracement zone on one asset, leaving room for the 0.88 line while saying I "can't bring myself to" go that far. Even for someone who watches charts every day, 0.88 feels that far away. The Bat is a pattern for having your plan ready at exactly that spot.
4. The Bat's Real Edge: The Entry Closest to the Stop (X)
More important than the depth itself is the distance to X. X is where the pattern started, so if price moves beyond X, the Bat is invalid. That naturally puts the stop reference near X, and the closer D is to X, the shorter the stop distance.
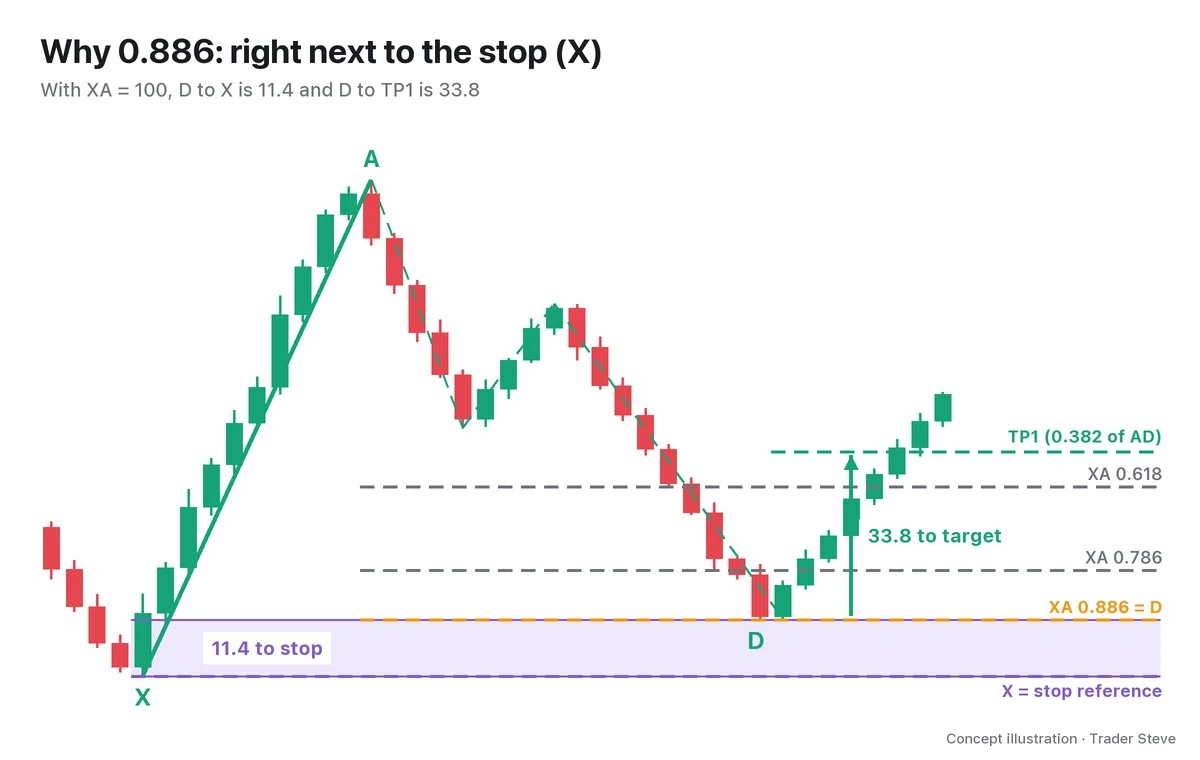
Let's run the concept numbers. If you set the first target, TP1, at the 0.382 retracement of the AD leg, then with XA = 100 the stop is 11.4 away and TP1 is 33.8 away. TP1 alone gives a risk-to-reward of about 2.97R, and the 0.618 retracement of AD (TP2) gives about 4.80R. How to calculate risk-to-reward is covered in detail in the Basics topic "Risk and Reward."
"Cut your stops without hesitation. Size your positions to the risk-to-reward. Wait. Wait until you're as close to your stop price as you can get. That's what makes the risk-to-reward better." — Trader Steve, live stream, Oct 15, 2026 (translated from Korean) · ▶ Watch the stream highlights (Korean audio)
The Bat is close to that advice translated into ratios: you wait until price reaches the spot tightest against the stop price (X), then watch the reaction. There is a cost, though. With only 11.4% of XA between D and X, even a small move beyond X invalidates the pattern immediately. The patience to wait for the depth and the rule to get out without regret once X breaks come as a package. The difference from its sibling pattern, the Gartley, which looks for a reaction at 0.786, becomes clearer if you read the Harmonic Gartley topic alongside this one.
5. What It Looks Like in Practice: ETH 1-Hour Chart, February 2026
Bats close to the textbook ratios do show up on real charts. Here is the Ethereum 1-hour chart from late February 2026.
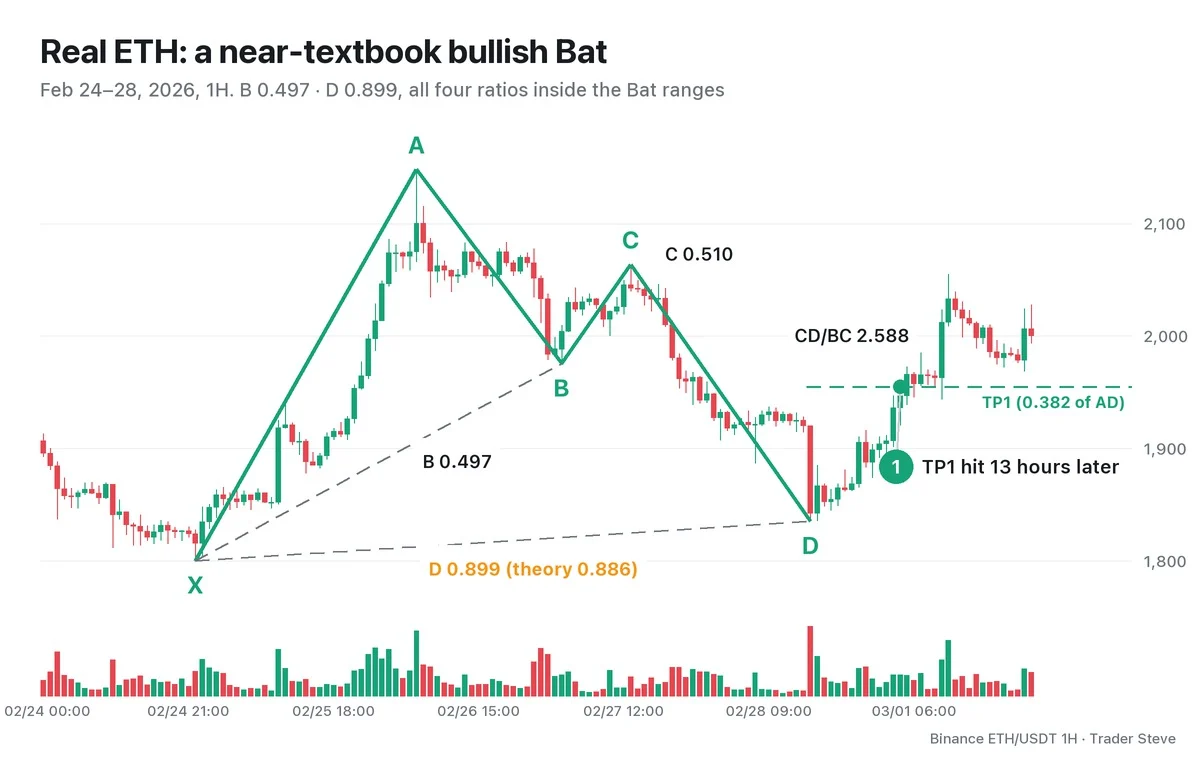
Finding the swing points with code and calculating the ratios gives:
- B = 0.497: within 0.382–0.5 of XA, a shallow first retracement
- C = 0.510: within 0.382–0.886 of AB
- CD/BC = 2.588: within 1.618–2.618
- D = 0.899: 0.013 deeper than the theoretical 0.886, but within tolerance
D printed at 15:00 KST on Feb 28, and the bounce reached TP1 (0.382 of AD) 13 hours later, at 04:00 KST on Mar 1. After that, X did not break within this chart window. Keep in mind, though, that this is a textbook-style example picked after the outcome was known. Matching ratios do not always lead to this result, and in Part 4 we'll go through, with numbers, failed cases where the same kind of Bat broke X and collapsed.
Finally, just the name for now. The Alternate Bat is a variation of the Bat in which B is even shallower, at 0.382 or less, and D pushes once beyond X to 1.13 of XA. The shape targets the spot where price sweeps the stop orders stacked beyond X and then turns. How to draw it is covered in Part 2.
The shared case H-ETH-2026-02-BAT (ETH, 2026-02) is 1,800.00→2,148.39→1,975.35→2,063.52→1,835.36. This lesson looks at the ratios on the ETH 1-hour chart, while Harmonic PRZ Execution Part 1 (related lesson) groups the same price sequence on the ETH 4-hour chart to study the reaction. It is not a new case; what differs is the timeframe zoom and the question being asked.
Key Takeaways
- The Bat is an XABCD pattern with a shallow B at 0.382–0.5 of XA and a deep D at 0.886.
- The bullish Bat is M-shaped (a buying reaction at the D low); the bearish Bat is W-shaped (a selling reaction at the D high).
- 0.886 is where price sits after most traders have given up, and its real edge is that it is the entry closest to the stop reference, X (in the concept numbers, 11.4 to the stop vs. 33.8 to TP1).
- The flip side: once price moves beyond X, the pattern is invalid immediately. D is not a confirmed signal but a candidate zone to watch for a reaction.
- The Alternate Bat is a variation with B at 0.382 or less and D pushing beyond X to 1.13.
In Part 2, we'll cover the Bat's ratio checklist, how to draw the potential reversal zone (PRZ), and the steps for spotting an Alternate Bat.
This lesson adapts the text, figures and live-stream quotes of the Trader Steve TA series for the web, translated from the original Korean. Check the text and figure captions for the timing and interpretation of each real example, and read conceptual diagrams and real charts separately.
Corrections: support@omnisight.report