What Is PRZ Trading? Plan Your Harmonic Entry, Stop and Targets First
Historical examples for learning · not current prices or trade recommendations.
Contents
You've spotted a harmonic pattern, but once price actually starts coming down, it's not obvious where to get in or where to get out. This lesson uses diagrams and a real Ethereum (ETH) example to show how to set your entry, your stop and two targets before you enter.
1. The Pattern Picks the Place; the Trade Plan Picks the Action
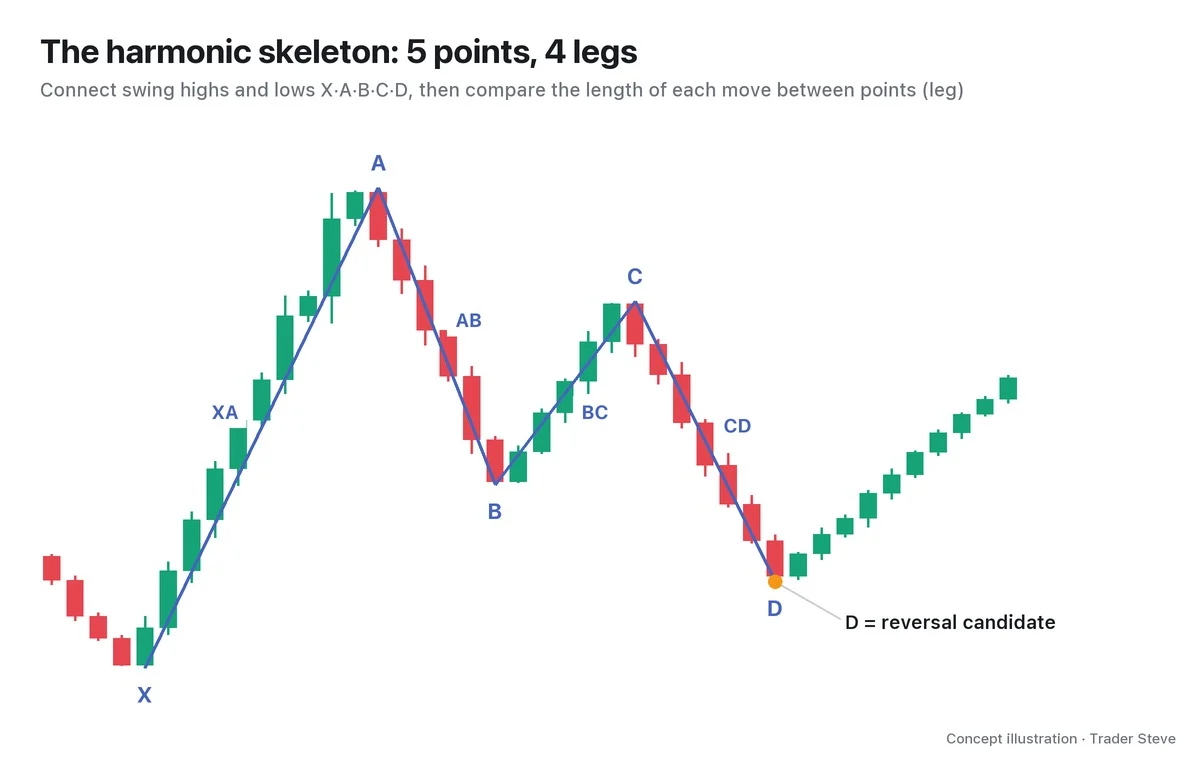
A potential reversal zone (PRZ) is a price area where several Fibonacci measurements cluster close together. In a harmonic pattern, it is the candidate area where the final point, D, may form. Harmonic Basics Part 3 (related lesson) covered the basic framework for entries, stops and targets; this series turns that framework into an actual order sequence.
Finding the PRZ settles where to watch for a reaction. The next step is to write down what you'll do when price gets there. I find it helps to think about these two separately. Marking your hotel on a travel map doesn't mean you've planned how to get there, and in the same way, one orange box on a chart is not an order plan.
- At what price you start preparing to enter
- At what price you drop the pattern hypothesis
- If a reaction comes, where you take profits in stages
Your answers to these questions are your PRZ trade plan. The exercise is to decide your actions first for the one zone you've found.
2. Four Numbers to Write Down Before You Enter
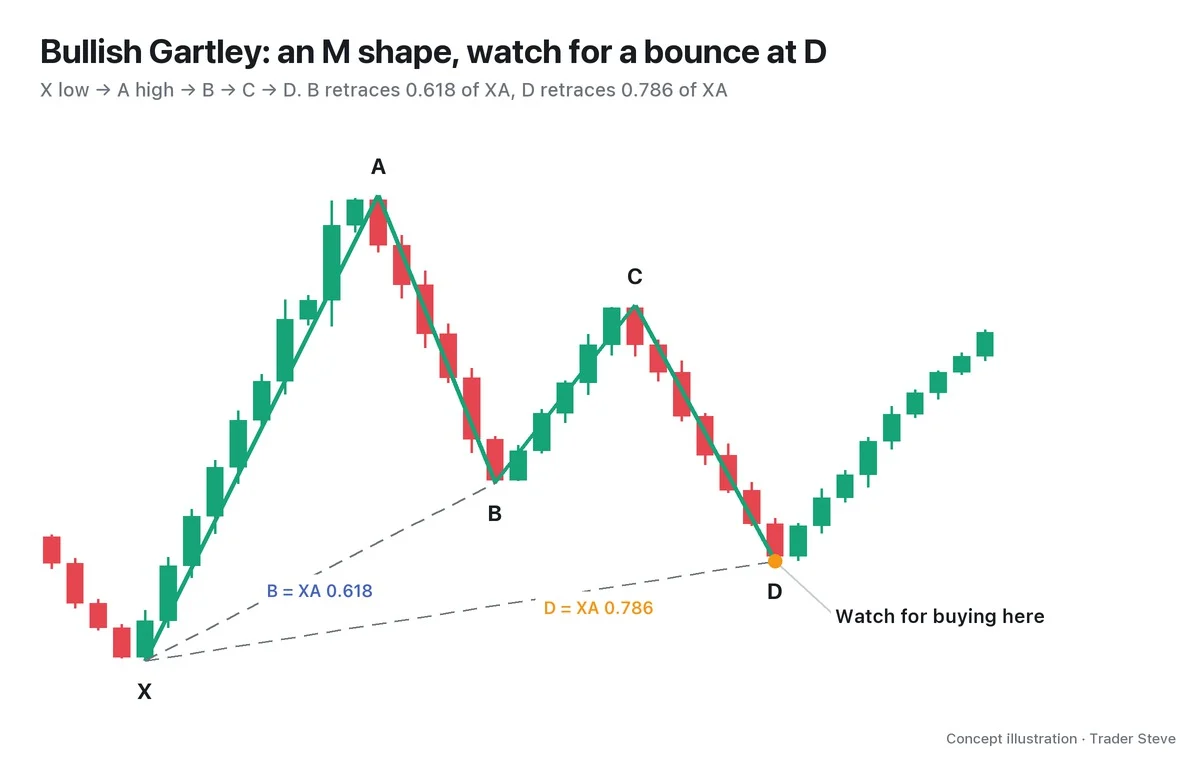
Let's start with a hypothetical bullish Gartley-style example. The numbers are there to explain the principle.
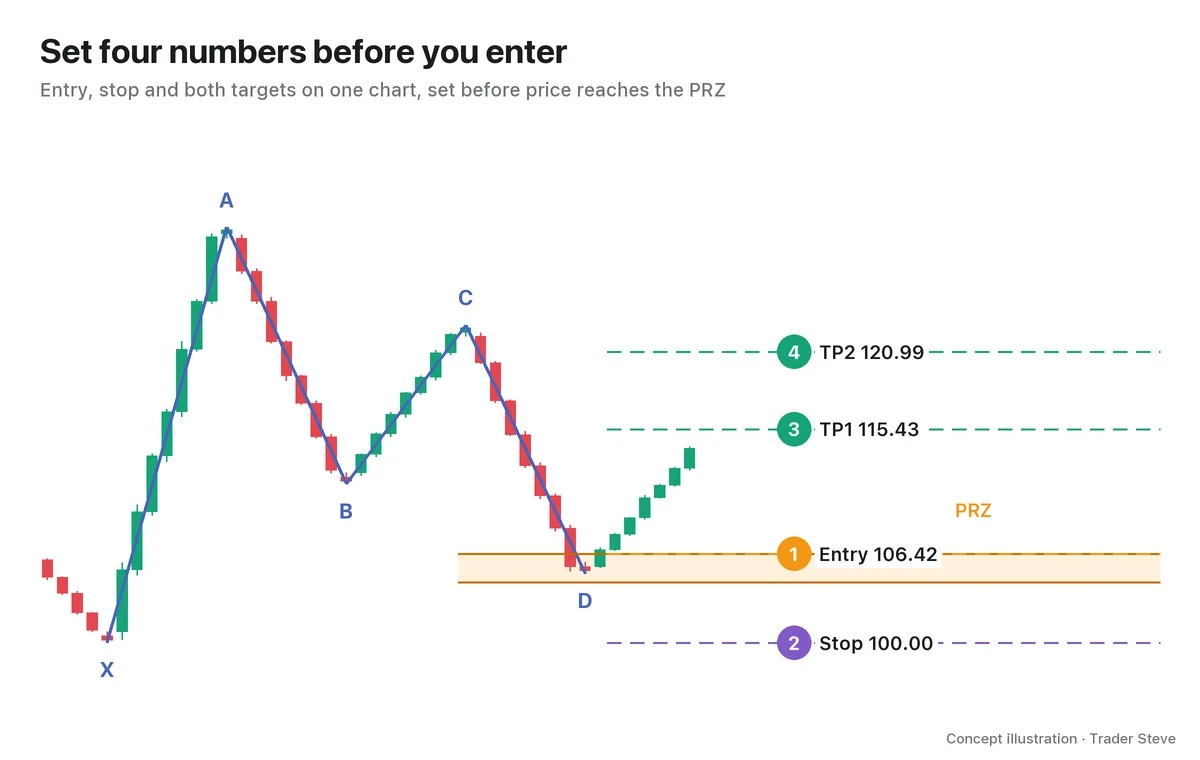
- Entry: place a limit order at 106.42, the edge of the PRZ that price reaches first.
- Stop-loss (SL): in this Gartley-style example, the starting point X at 100.00 is where the hypothesis breaks.
- Take profit 1 (TP1): 115.43, which retraces 0.382 of the distance from the entry price to A.
- Take profit 2 (TP2): 120.99, which retraces 0.618 of the same distance.
The targets are calculated from the planned entry price and A, which is already known. If A is 130, TP1 is 106.42 + (130 - 106.42) × 0.382. That's why you can write the targets down in advance, too. The stop reference differs by pattern; the stop at X applies to this Gartley-style example.
Next to the numbers, add a cancel condition: if price breaks above C before it reaches the PRZ, cancel the pending order. If C changes but you leave an order calculated from the old C, it can fill in a shape that is different from your original plan. Before entry, invalidation is handled by canceling the order; after entry, by the stop you set in advance.
3. The PRZ Is a Band, Not a Single Line
When you draw lines on a chart, it's easy to assume price has to stop exactly at that price. But a PRZ is built from values measured with different rulers.
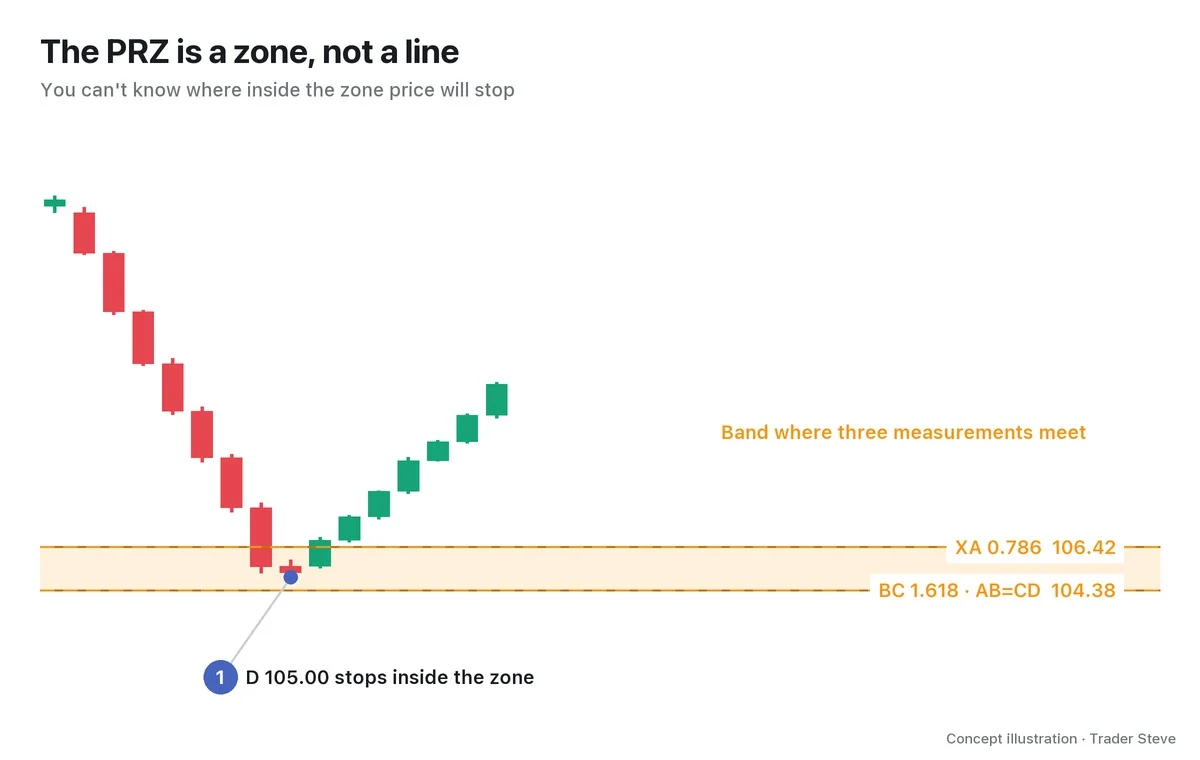
The value measured from the first rally, XA, and the value projected from the middle leg, BC, differ a little, so you get a band from 104.38 to 106.42. Think of it like the stopping area at a bus stop. A bus doesn't stop at a single point right in front of the sign; where it stops varies within the marked area.
So for your entry, you also have to decide which part of the zone to use. You can use the edge price reaches first, or you can prepare orders split across the zone. Here, I'll use a single limit order at the edge price reaches first. Part 2 compares entry methods in detail.
Targets are also zones you read together with the surrounding price levels. Still, write the range you're watching and the actual order price down separately. The TP1 and TP2 lines in the diagrams are reference points for the calculation and for checking whether price reached them. If the rulers that build a PRZ are unfamiliar, read Basics Fibonacci (related lesson) alongside this lesson.
4. Call the Distance to Your Stop 1R
The risk unit (R) is the stop distance you accept in a single plan. For a bullish setup, 1R = entry price - stop price.
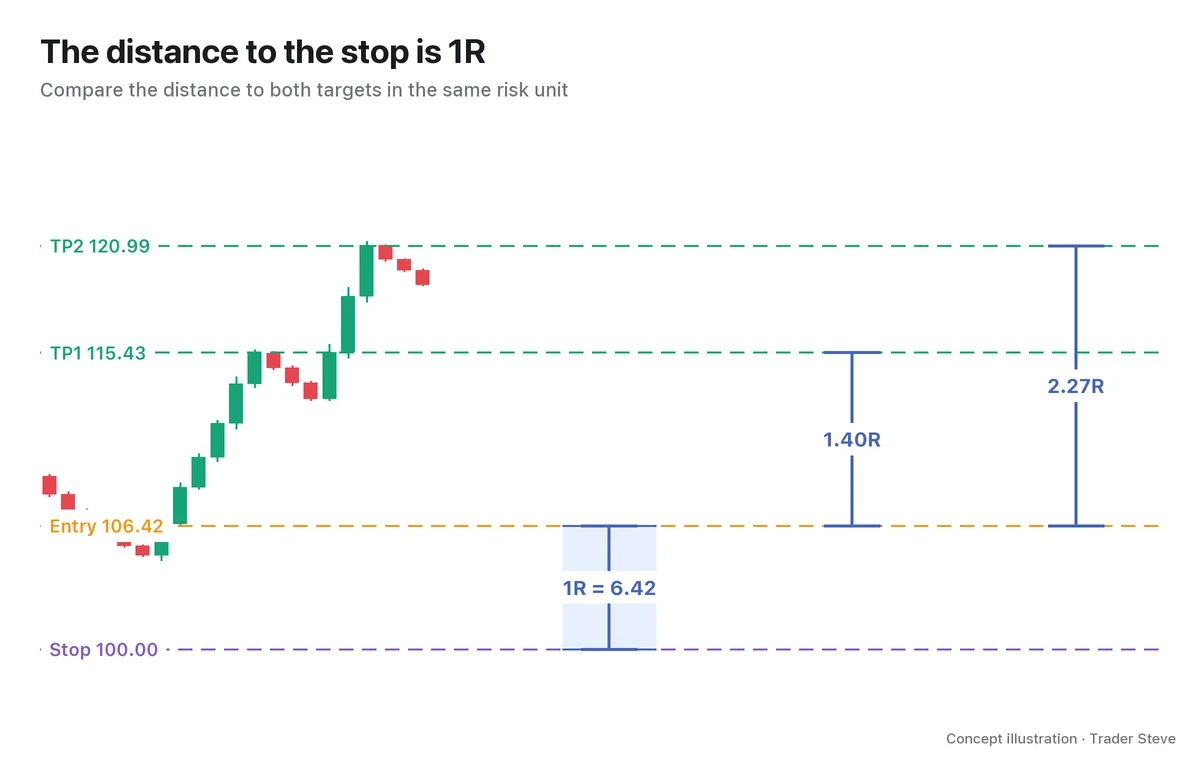
In this example, the distance to TP1 is about 9.01. Divide that by the 6.42 stop distance and you get 1.40R. TP2 works out the same way to 2.27R. This ratio is the risk-to-reward ratio (R:R).
R puts charts with rulers of different sizes onto one common scale. Even when prices differ from one market to another, you can compare target distances in units of one stop-out. Record the calculated target distance and the actual result separately, though. If you're stopped out before a target is reached, the result is -1R. The numbers here are before fees and slippage.
Some traders cap the risk on any single trade at 1% of the account, but the calculation that sets your actual position size continues in Basics Risk and Reward (related lesson) and in the next part.
5. Why Split the Target Into Two Stages
Even when price reacts at the PRZ, it doesn't always run all the way back to the prior high at A in one go. It can lose steam or pull back along the way, so you decide in advance how far it has to go before you take some off. Here's how I explained target management on a live stream. It's a general principle about take-profit plans, not a comment about harmonics.
"There's a first target, a second target, a third target. (…) I'm planning to take profits in steps like this, cutting some at each one on the way out — but first, price actually has to go up." — Trader Steve, live stream, Aug 24, 2026 (translated from Korean) · ▶ Watch the stream highlights (Korean audio)
TP1 is your first candidate for taking profits, and TP2 is the next one. Writing down two targets doesn't mean you must hold all the way to the end. Whether you close everything at TP1 or keep part of the position is a separate management rule you choose. Part 3 compares the ways to manage a trade after the targets.
6. Placing the Four Numbers on a Real ETH Chart
This is the ETH 4-hour chart from Feb 22 to Mar 3, 2026. It is a hypothetical order calculated with this lesson's rules, not a trade I made at these prices. All times are Korea Standard Time (KST, UTC+9), and entry and target times refer to each candle's open.
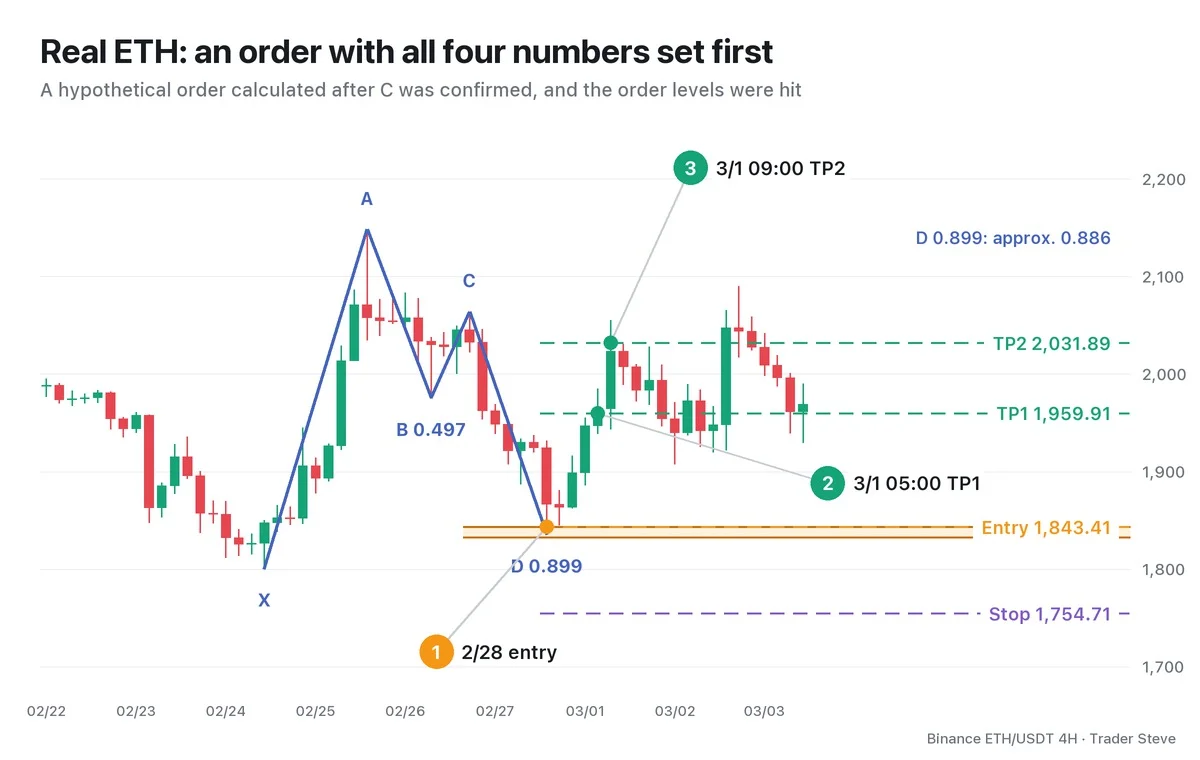
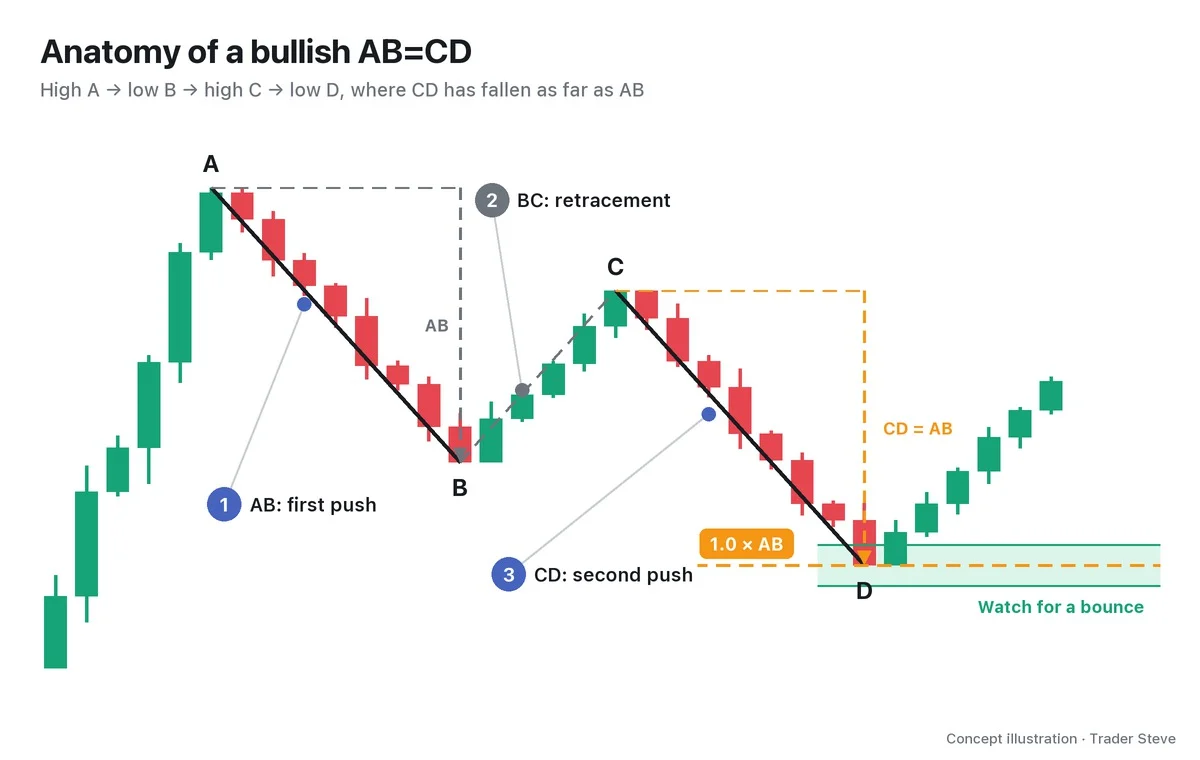
X 1,800.00 → A 2,148.39 → B 1,975.35 → C 2,063.52 were picked from real swings. B's retracement is AB/XA 0.497, and C's is BC/AB 0.510. D from XA at 1,839.72, the BC projection at 1,832.69 and the AB=CD extension at 1,843.41 cluster to form a PRZ of 1,832.69–1,843.41.
A swing high or low is confirmed only after three candles to its right have passed. Here, the third candle after C is the Feb 28 01:00 candle, and the calculation places the order only after that candle's 05:00 close confirms C. It doesn't assume C was known before it was confirmed.
- Entry: Feb 28, 13:00 candle, 1,843.41
- Stop: XA 1.13, one of the common references for the Bat, at 1,754.71
- TP1: 1,959.91, 1.31R from entry
- TP2: 2,031.89, 2.12R from entry
The actual D was 1,835.36 on the entry candle, which stayed inside the PRZ. After that, price first touched TP1 on the Mar 1 05:00 candle and TP2 on the 09:00 candle. The key point is that the four numbers calculated before price arrived let you read everything that followed against the same reference.
The shared case H-ETH-2026-02-BAT is 1,800.00→2,148.39→1,975.35→2,063.52→1,835.36 on the ETH 4-hour chart. Harmonic Bat Part 1 (related lesson) zooms in on the same five prices on the 1-hour chart to explain the ratios. Here I look at the PRZ reaction and the order design, and I don't count it as a separate additional case.
Key Takeaways
- A PRZ is a candidate reaction zone where several measurements cluster.
- Write down entry, stop, TP1 and TP2 before you enter.
- If price breaks above C before it reaches the PRZ, cancel the pending order.
- Set the distance from entry to stop as 1R and compare the distance to both targets.
- Even in a real-chart case, the order must be calculated so that it's placed only after C is confirmed.
In Part 2, we'll cover the order of steps for placing orders, three ways to enter, and stop placement by pattern.
If repeating these calculations by hand for every market gets tedious, you might find the Omnisight Report useful — it pulls several theories together in one place.
This lesson adapts the text, figures and live-stream quotes of the Trader Steve TA series for the web, translated from the original Korean. Check the text and figure captions for the timing and interpretation of each real example, and read conceptual diagrams and real charts separately.
Corrections: support@omnisight.report