
What Are Volume Imbalances and Liquidity Voids? Meaning and Mechanics
Historical examples for learning · not current prices or trade recommendations.
Contents
The fair value gap (FVG) isn't the only empty zone a chart leaves behind. There are small gaps between the bodies of two candles, and there are large zones where a run of big candles leaves an entire leg empty. By the end of this lesson, you'll be able to tell apart the two other kinds of "empty zones" besides the FVG — the volume imbalance and the liquidity void — and explain why they form.
1. The Imbalance Family: Sorted by What Doesn't Overlap
Imbalance is the umbrella term for a fast move in one direction that leaves candle ranges not overlapping. In ICT it's used almost interchangeably with inefficiency. The family has four members, and you tell them apart by which parts fail to overlap.
| Name | Candles you look at | What doesn't overlap | Where it mostly appears |
|---|---|---|---|
| Fair value gap (FVG) | 3 | the wicks of candle 1 and candle 3 | all markets |
| Volume imbalance (VI) | 2 consecutive | the two bodies (the wicks overlap) | stocks, index futures |
| Gap | 2 consecutive | everything, wicks included | the session open in stocks and futures |
| Liquidity void | several large candles in the same direction | the whole leg passes with very little trading | all markets |
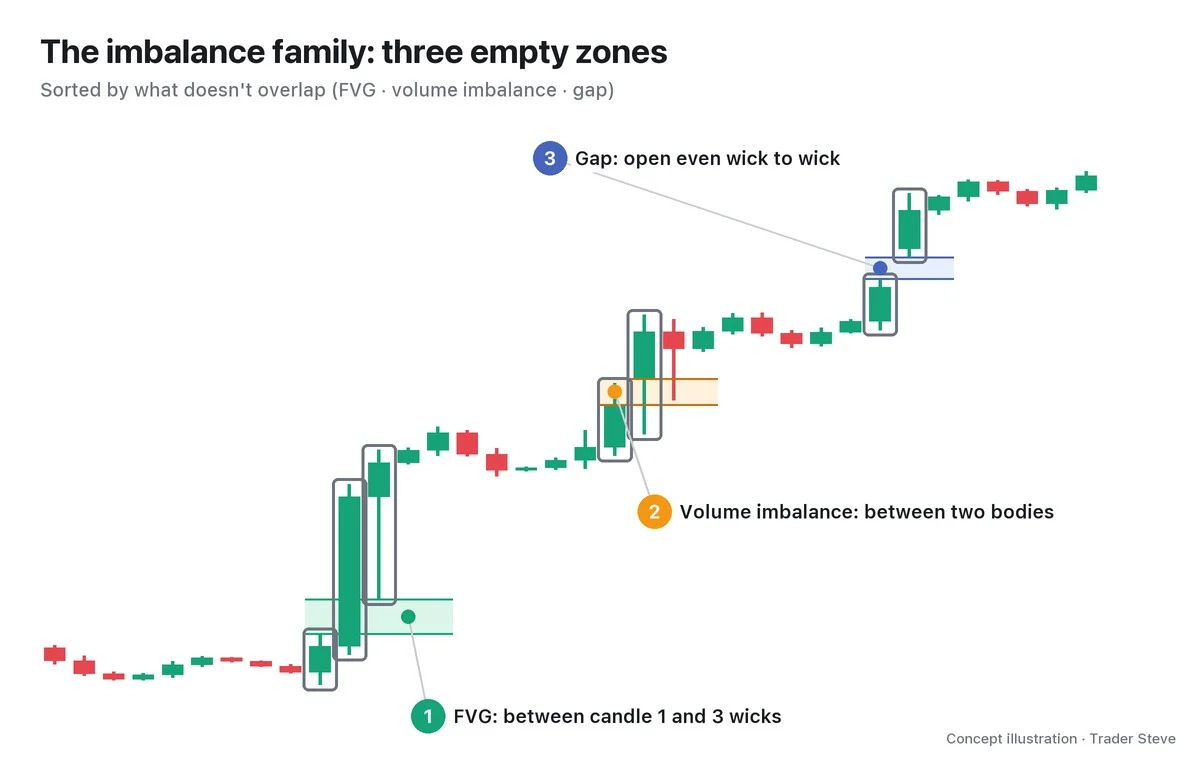
FVGs were covered in detail in ICT FVG Part 1 (related lesson), so this lesson focuses on the other two. Gaps created by the weekly and daily opens are covered separately in the opening gaps topic (see ICT Opening Gaps, ict/opening-gaps).
2. Volume Imbalance: Two Candles, Bodies Apart, Wicks Overlapping
A volume imbalance is a spot where the bodies of two consecutive candles are separated but their wicks overlap.
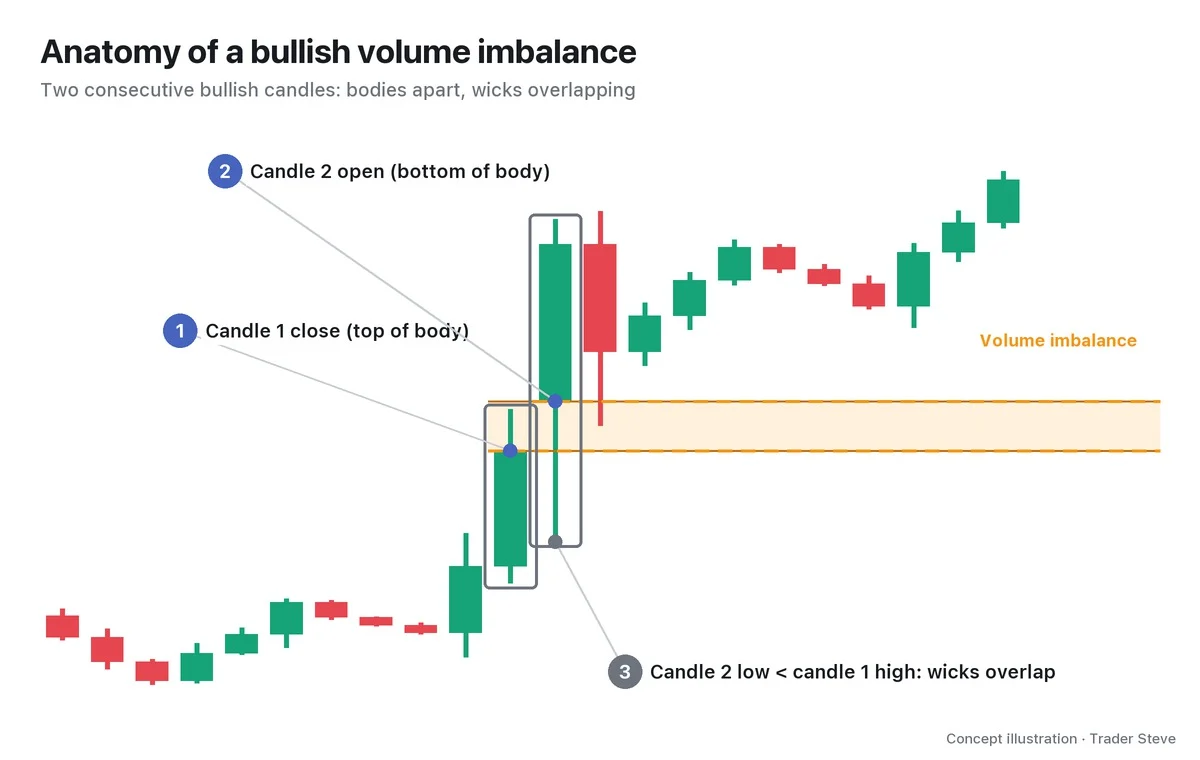
- Bullish VI: both candles are bullish, and candle 2 opens above candle 1's close. The zone runs from candle 1's close to candle 2's open.
- Bearish VI: the mirror image — both candles are bearish, and candle 2 opens below candle 1's close.
Because the wicks overlap, it isn't that no trading happened at all. But price skipped at the moment one candle handed off to the next, so no candle's body passed through that space. That makes the ends of the bodies (the close and the open) the reference lines, and you watch whether the body closes of later candles hold those lines. Part 2 continues with how to find and judge them.
Two points trip people up because of the name. First, a volume imbalance is not a volume indicator — it's the empty space between bodies. Second, it's a different concept from the order-flow imbalance on footprint charts (the ratio of executed buy to sell volume); they only share a name.
In a market that trades 24 hours a day, like crypto, each candle opens at almost the same price as the previous close, so two-candle VIs and gaps practically never form (Part 2 checks this with numbers).
3. Liquidity Void: The Whole Leg That Holds the FVGs
A liquidity void (LV), or simply a void, is the entire zone that price crossed with very little trading while large candles in the same direction printed one after another.
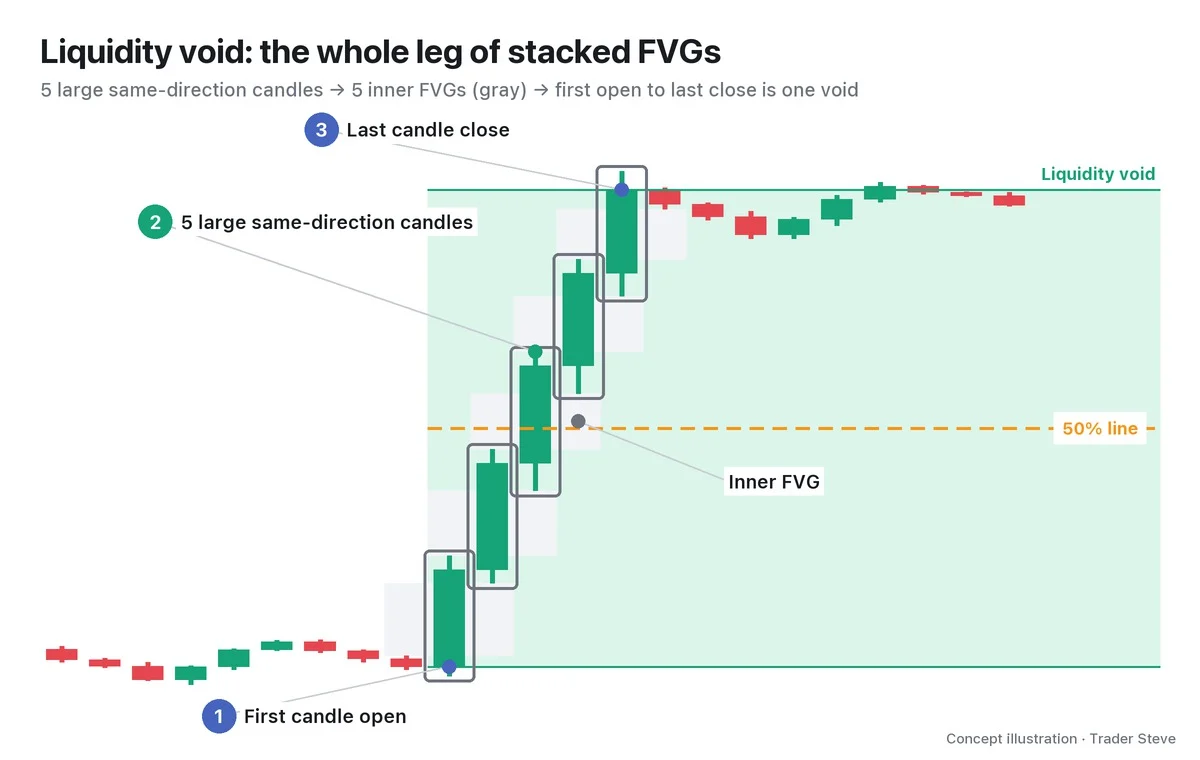
One large candle creates one FVG, but when three or four large candles in the same direction follow each other, the FVGs stack up like a staircase. Grouping that whole staircase into one block gives you the liquidity void. Draw the box from the first candle's open to the last candle's close, and mark its midpoint, the 50% line, as well.
If an FVG is a small hole three candles wide, the void is the whole leg that contains those holes. That's why the void's origin can still be open even after every FVG inside it has been filled (a real example follows in Part 2).
The term most often confused with it, because the names are similar, is the liquidity pool (buy-side liquidity (BSL) and sell-side liquidity (SSL), ict/liquidity). A pool is where stop-loss and resting orders are clustered; a void is a run of consecutive displacement candles that meets set criteria. The large candles that create a void are covered in the displacement topic (see ICT Displacement, ict/displacement).
4. Why They Form, and Why Price Comes Back
Price moves where buyers and sellers meet. But when one side tries to get a lot of size done at once and there's no one to take the other side, price can't move step by step — it gets pushed until it reaches someone willing to trade. The space it crossed on the way is left empty. On the live stream, I explained this from the seller's side: the side that wanted to sell a lot of size dumped it all at once, but nobody was buying, so price got pushed down.
That was my interpretation on the stream at the time. In this series, a liquidity void is a zone marked by the consecutive-displacement-candle criteria. OHLC (open, high, low, close) data alone can't confirm unfilled orders or thin volume at those prices. A void may overlap a low-volume node (LVN), but that has to be checked separately on a volume profile.
A large FVG or balanced price range (BPR) is a zone to watch for a reaction if price revisits it. It is not a signal that promises a revisit, or that price will reach the zone's bottom or midpoint.
The explanation above is one way of interpreting a non-overlapping zone; it is not a forecast of where price will go. When price passes back through a zone it crossed quickly before, that's called a rebalance, the same word used in ICT FVG Part 1.
One point is worth stressing. A void is a place price may revisit, not a place price is guaranteed to bounce from. A pullback can pass straight through the whole void, and whether it holds as support has to be confirmed separately. The real example right below is exactly that case.
5. A Liquidity Void on a Real Ethereum Chart
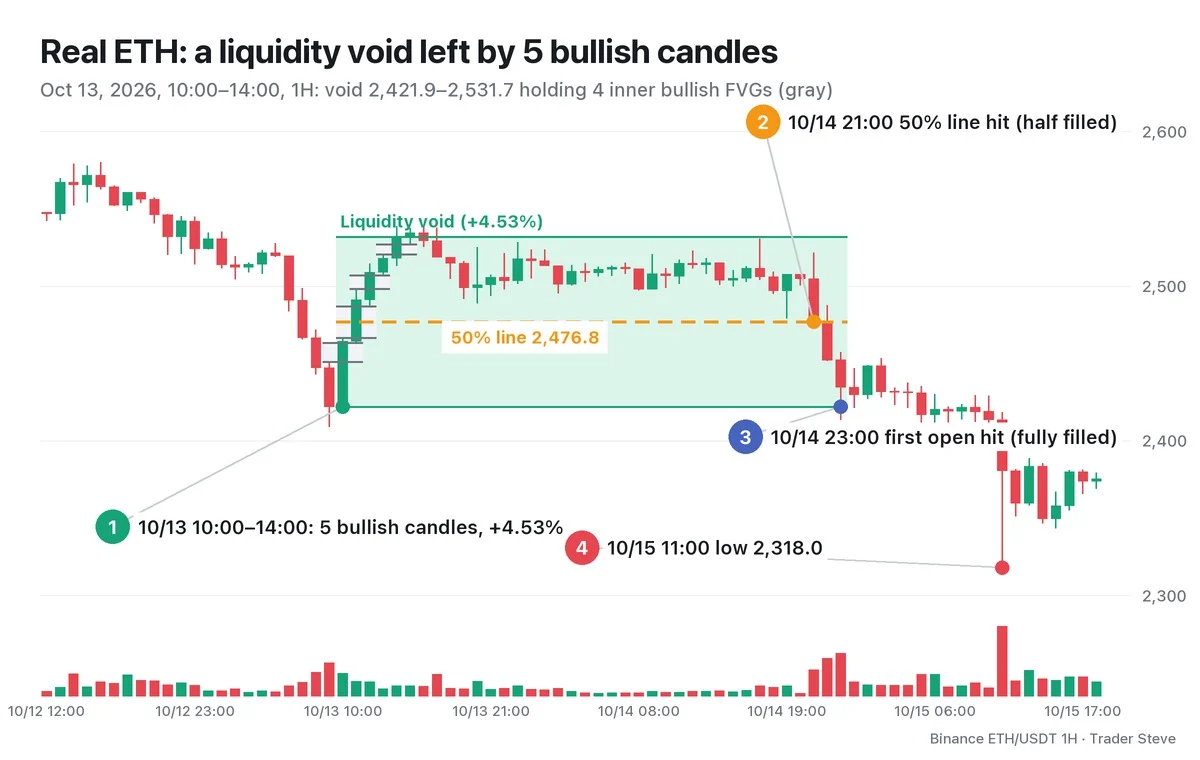
All times in this example are Korea Standard Time (KST, UTC+9). ① From 10:00 to 14:00 on Oct 13, five bullish 1-hour candles printed in a row. From the first candle's open at 2,421.9 to the last candle's close at 2,531.7, that's +4.53%. The body ratios of the five candles (body ÷ total range) were 0.95, 0.76, 0.64, 0.67 and 0.54 — all above half — and the average volume over those five hours was 1.43x the average of the previous 48 hours.
Inside it, 4 bullish FVGs stacked up like stairs (2,451.0–2,463.2 / 2,466.5–2,486.8 / 2,498.1–2,506.9 / 2,520.7–2,526.8). The void's 50% line is 2,476.8. Note that for all five candles, the open differed from the previous close by $0.01 or less. That's why, in crypto, voids like this — not two-candle volume imbalances — are what matter in practice.
The top two FVGs were filled right away, at 17:00 and 19:00 that day, but price held above the 50% line for more than a day. ② At 21:00 on Oct 14 it touched the 50% line, and ③ two hours later, at 23:00, it came down to the first candle's open and filled the void completely — 33 hours after the void ended. Then ④ at 11:00 on Oct 15, it fell further to 2,318.0.
The void was filled, but nowhere inside it did price find support. "Price comes back" and "price bounces there" are two different statements. Part 3 covers how to use a void for entries, stops and targets, and Part 4 looks at how unpredictable the time to fill can be.
Key Takeaways
- Imbalance is the umbrella term for a fast one-directional move that leaves candle ranges not overlapping; the FVG, volume imbalance, gap and liquidity void are one family.
- A volume imbalance is a spot where two consecutive candles' bodies are apart but their wicks overlap. It is not a volume indicator.
- A liquidity void is the whole leg formed by consecutive large candles in the same direction, holding FVGs stacked like stairs. Draw the box from the first candle's open to the last candle's close and watch the 50% line with it.
- Because it's a zone where price was pushed along with no one to take the other side, price often comes back to fill it — but support inside it is thin, so price can pass straight through.
In Part 2, we'll cover the rules for finding volume imbalances, what to watch out for in crypto markets, and how to draw a liquidity void step by step.
This lesson adapts the text, figures and live-stream quotes of the Trader Steve TA series for the web, translated from the original Korean. Check the text and figure captions for the timing and interpretation of each real example, and read conceptual diagrams and real charts separately.
Corrections: support@omnisight.report


