
What Are ICT Kill Zones? Sessions, Meaning and Times in KST
Historical examples for learning · not current prices or trade recommendations.
Contents
Chart analysis usually asks "at what price?" ICT adds one more question: "when did price get there?" This lesson uses charts to explain what sessions, kill zones (KZ) and the Judas swing are, why timing matters, and when they fall in Korea Standard Time (KST).
1. Price Also Cares About "When"
Large orders don't arrive evenly across the 24-hour day. Big participants such as banks and funds act while their own market is open, and that is when trading activity and price ranges concentrate. The windows when a major market is open and activity piles up are called trading sessions, usually split into three: Asia (Tokyo, Hong Kong, Seoul), London and New York.
Within each session, ICT singles out the 2–4 hour window where volatility and large orders are most concentrated and calls it a kill zone. The key point: ICT defines every time in New York time.
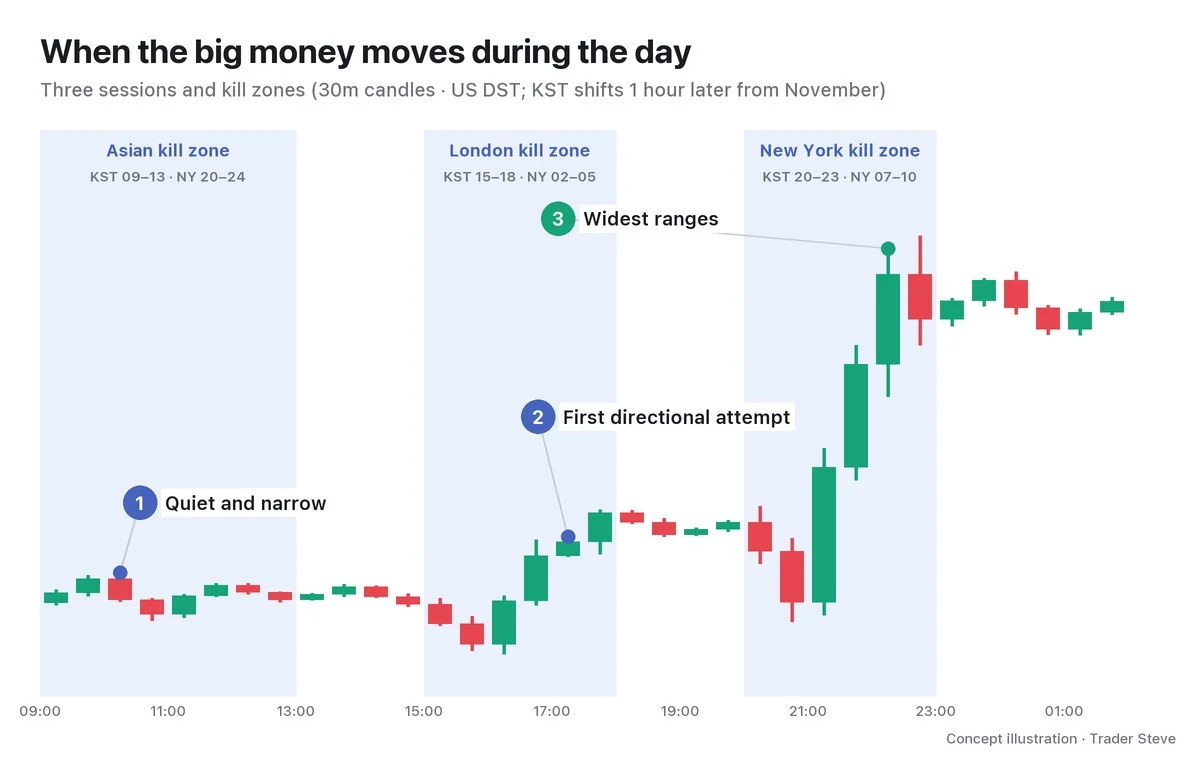
On my live streams I almost never say "kill zone." I say "the Asian session," "US market hours" or "the move at the Nasdaq open" instead, but I'm pointing at the same thing.
"These days the Asian session is flatlining, no fun at all, and then in US market hours it's flopping up and down, rallying and dropping, just dancing all over the place…" — Trader Steve, live stream, Sep 2, 2026 (translated from Korean) · ▶ Watch the stream highlights (Korean audio)
2. Three Sessions and Four Kill Zones (in KST)
The table below converts New York times to KST. It lists US daylight saving time (DST, 3/8–10/31) and standard time (from 11/1) separately; from Nov 1, every KST time moves one hour later.
| New York time | Name | KST (US daylight saving time, Mar 8–Oct 31) | KST (US standard time, from Nov 1) |
|---|---|---|---|
| 20:00–00:00 | Asian kill zone · Asian range | 09:00–13:00 | 10:00–14:00 |
| 00:00 | Midnight open (New York midnight open) | 13:00 | 14:00 |
| 02:00–05:00 | London kill zone (London Open Kill Zone, LOKZ) | 15:00–18:00 | 16:00–19:00 |
| 07:00–10:00 | New York kill zone (New York Kill Zone, NYKZ) | 20:00–23:00 | 21:00–00:00 |
| 08:30 | US economic data releases (CPI, etc.) | 21:30 | 22:30 |
| 09:30 | US stock market open | 22:30 | 23:30 |
| 10:00–12:00 | London close kill zone | 23:00–01:00 | 00:00–02:00 |
- London kill zone: the day's first directional attempt often shows up here.
- New York kill zone: it contains the economic data releases and the stock market open, so ranges are widest. When I say "the Nasdaq open at 9:30," I mean 09:30 New York time, which is 22:30 KST during daylight saving time.
- London close kill zone: a short window where pullbacks and profit-taking are common.
- Midnight open: the 00:00 New York opening price that ICT uses as the day's reference line (see ICT Opening Gaps, ict/opening-gaps).
The Binance daily candle opens at 09:00 KST. During daylight saving time, that is 20:00 in New York, the same moment the Asian kill zone begins.
3. The Asian Range: Liquidity for the Next Session
The span between the high and the low made during the four hours of the Asian kill zone is called the Asian range. Because it forms during a quiet stretch, many participants place orders around its high and low.
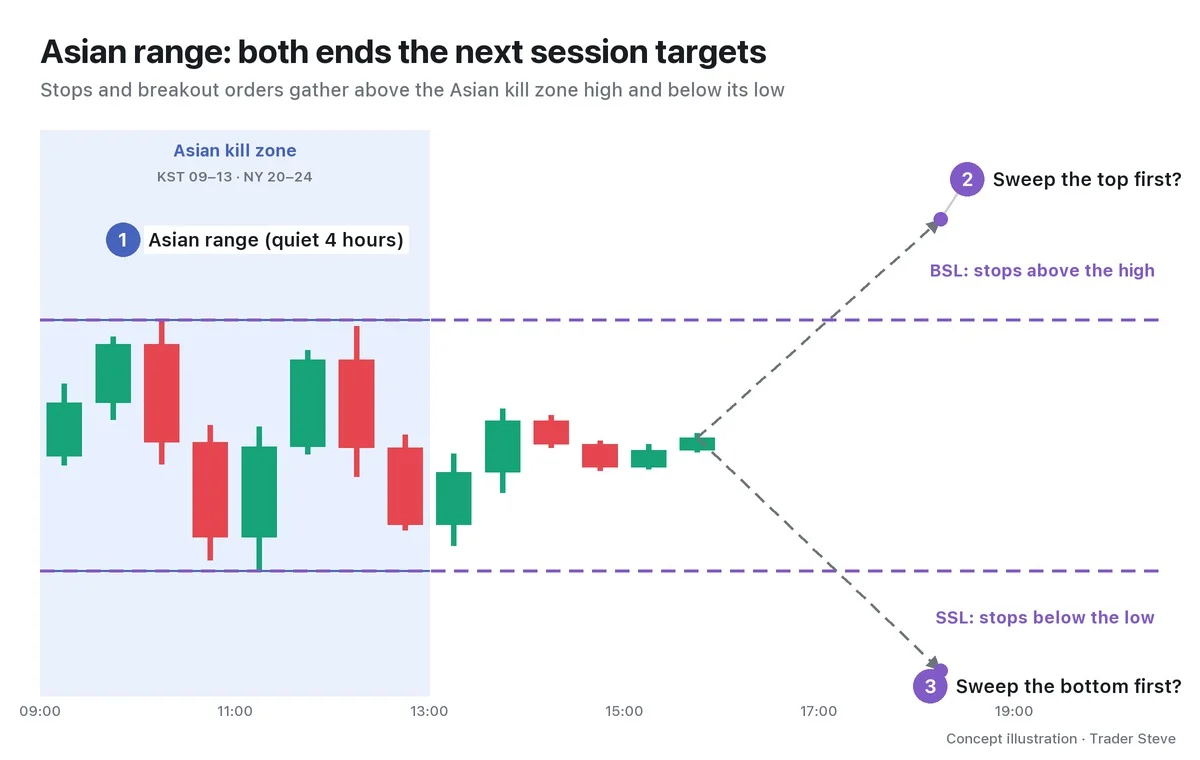
- Above the high: stop-losses on short positions (buy orders) and breakout buy orders → buy-side liquidity (BSL)
- Below the low: stop-losses on long positions (sell orders) and breakout sell orders → sell-side liquidity (SSL)
Filling a large order requires a place with plenty of orders on the other side, so the London and New York sessions often touch one end of the Asian range first. Timing alone can't tell you which end. How liquidity builds up is covered in ICT Liquidity (related lesson).
4. The Judas Swing: The Wrong Way First, Then the Real Direction
A Judas swing is a false move early in a session that first moves against the day's real direction, sweeps the stops beyond the Asian range high or low or beyond the midnight open, and then comes back. The name comes from Judas, the betrayer.
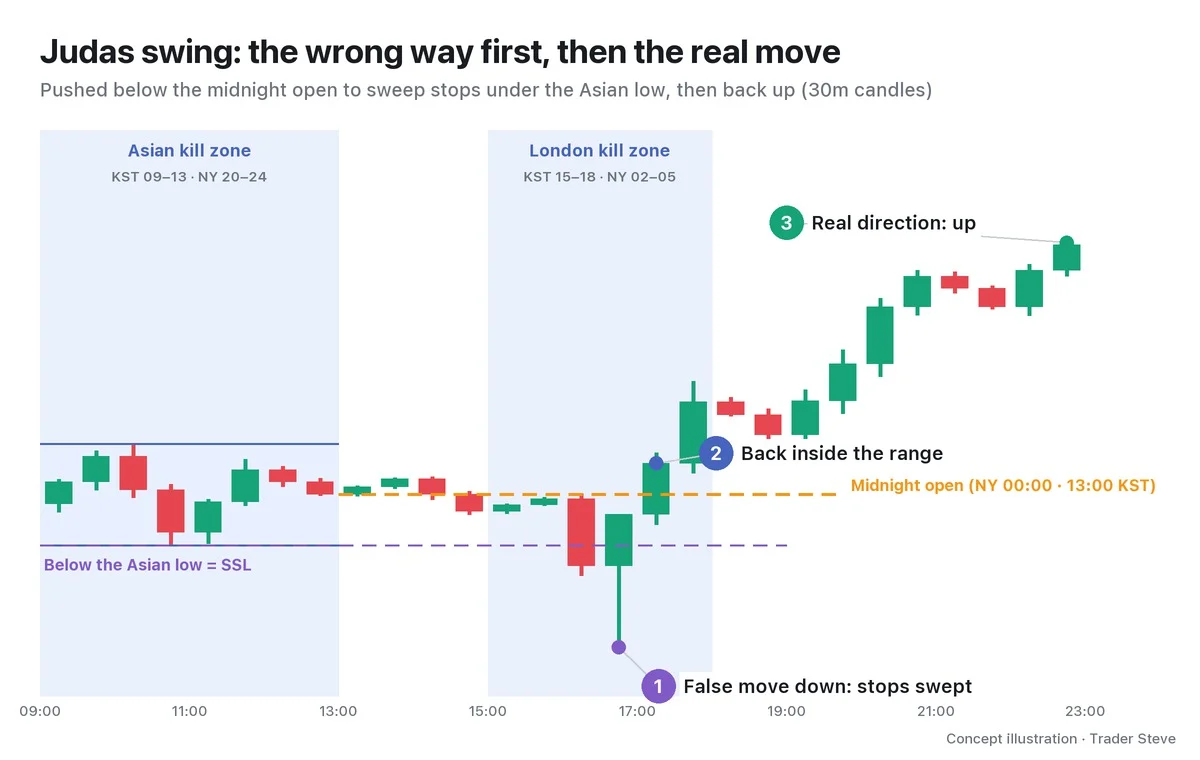
Why does this happen? Think about it from the side that wants to buy big. While price is rising, it's hard to accumulate size cheaply. Push price down instead, and the stops and liquidations below the low fire all at once, releasing a flood of forced selling that the buyer can absorb to fill the position. On a live stream, I explained a bounce after the previous night's sharp drop this way:
"See where the liquidation orders are sitting here? They put long orders underneath and pushed price down. As all of these blow up, a huge amount of forced selling hits right here, right? They soak up every bit of that forced selling…" — Trader Steve, live stream, Oct 16, 2026 (translated from Korean) · ▶ Watch the stream highlights (Korean audio)
That said, the Judas swing is a pattern that is easy to name after the fact. Sweeping a low does not guarantee a bounce, and on many days price just keeps falling. Part 2 covers how to tell a sweep from a breakout, and Part 5 checks how often a reversal actually follows. In the framework that splits the day into accumulation–manipulation–distribution, the Judas swing is the "manipulation" phase (see ICT Power of 3, ict/po3-amd).
5. Real BTC: When During the Day Does It Move the Most?
Bitcoin (BTC) trades 24 hours a day. Does it still move most in New York hours? Below, BTC 1-hour candles from 148 weekdays, Apr 1–Oct 23, 2026 (all during US daylight saving time), are grouped by KST hour, with the average range ((high − low) / open) for each hour.
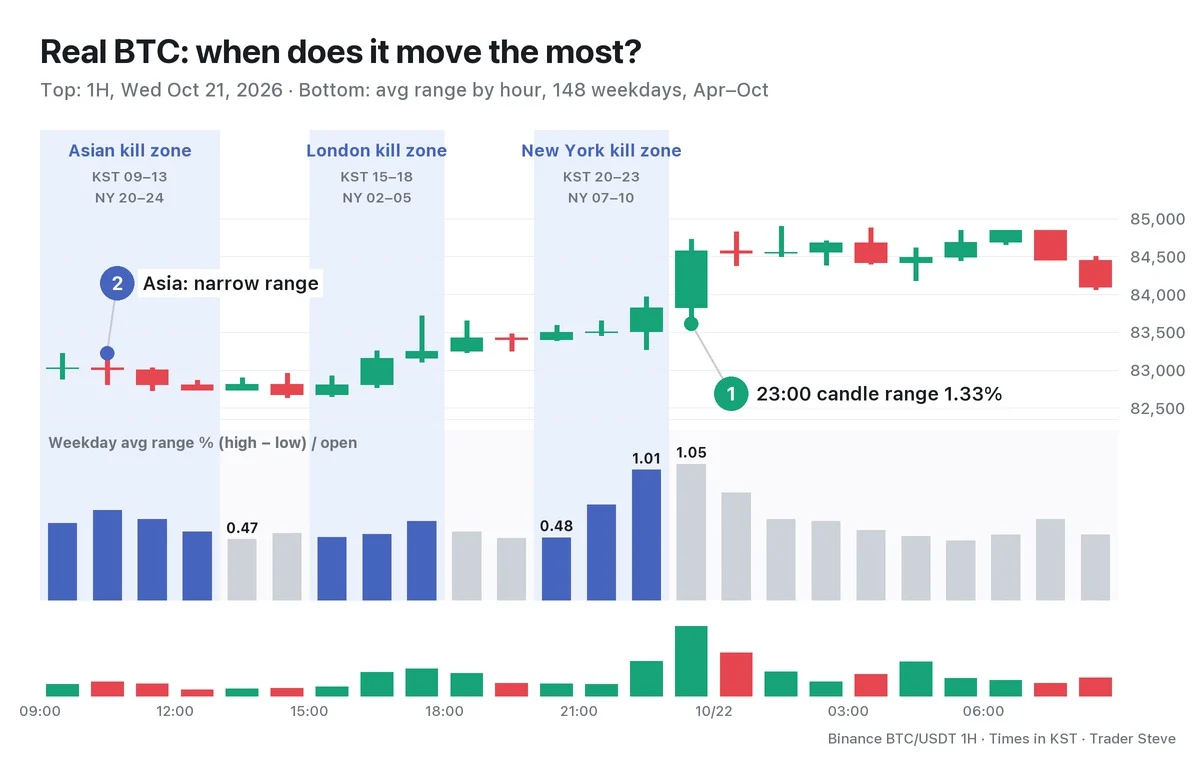
- The biggest moves came in the 22:00 candle (1.01%) and the 23:00 candle (1.05%). The 22:00 candle contains the US stock market open (22:30), and the 23:00 candle comes right after the New York kill zone (10:00 New York time).
- The 22:00–23:00 average of 1.03% is about two times the 13:00–20:00 average of 0.51%.
- The London kill zone (the 15:00–17:00 candles) came in at 0.49, 0.51 and 0.61%, so the London open effect was weak in crypto. The 09:00–10:00 candles, where the daily candle opens (0.60 and 0.70%), were actually a little larger.
- Volume has the same shape (all-days average: 1,232 BTC for the 23:00 candle, 433 BTC for the 05:00 candle).
Oct 21 in the top panel looks similar. During the four hours of the Asian kill zone, price stayed within 82,729–83,225 and only 378 BTC traded per hour on average, while the single 23:00 candle had a range of 1.33% and volume of 2,383 BTC. Time on its own doesn't tell you direction, but it shows fairly clearly when a big move is most likely.
The hourly statistics in ICT Silver Bullet Part 1 (related lesson) use the most recent 66 weekdays, while this lesson uses 148 weekdays. They are separate calculations over different periods, so the figures differ slightly.
Key Takeaways
- A kill zone is a 2–4 hour window within a session where large orders concentrate, and ICT defines it in New York time.
- In KST under US daylight saving time: Asia 09:00–13:00, London 15:00–18:00, New York 20:00–23:00. From Nov 1, everything shifts 1 hour later.
- The area above the Asian range high and below its low is the liquidity the next session targets.
- The Judas swing sweeps the wrong way first and then moves in the real direction, but it is an easy label to apply after the fact, so it needs confirmation.
- BTC also moved most at 22:00–23:00 on weekdays. Crypto, however, trades 24 hours a day and on weekends, so Part 5 covers what to watch before applying kill zones as-is.
In Part 2, we'll cover the step-by-step way to draw kill zones on a chart using the Asian range and the midnight open, plus a checklist for identifying a Judas swing.
If checking liquidity and structure by time of day by hand every time feels like a chore, take a look at the Omnisight Report.
This lesson adapts the text, figures and live-stream quotes of the Trader Steve TA series for the web, translated from the original Korean. Check the text and figure captions for the timing and interpretation of each real example, and read conceptual diagrams and real charts separately.
Corrections: support@omnisight.report


