What Is the Composite Man? Why Wyckoff Treats Big Players as One Person
Historical examples for learning · not current prices or trade recommendations.
Contents
Every so often a chart gives you the feeling that someone made a move on purpose. Wyckoff theory has a tool for imagining that "someone" as a single person: the Composite Man (CM). This lesson uses charts to explain what the Composite Man is, and why a chart starts to make sense once you read the market as "one person's campaign."
All dates and times are Korea Standard Time (KST, UTC+9). A daily candle is dated by its 09:00 KST open; intraday extremes are identified by their KST date and time.
1. The One-Line Definition: One Imaginary Big Player
The Composite Man is an imaginary figure who bundles the market's big money (institutions, whales, market makers and so on) into one person running one campaign. Richard D. Wyckoff originally called this figure the Composite Operator, and he advised studying every rise and fall in the market as if this one person had caused it.
The key point is that he is not a real person. This is not a conspiracy theory about one individual hidden somewhere who moves the market at will. It is a mental model for reading a chart in terms of "who moved it this way, and why." The closest plain description is "one imaginary big player."

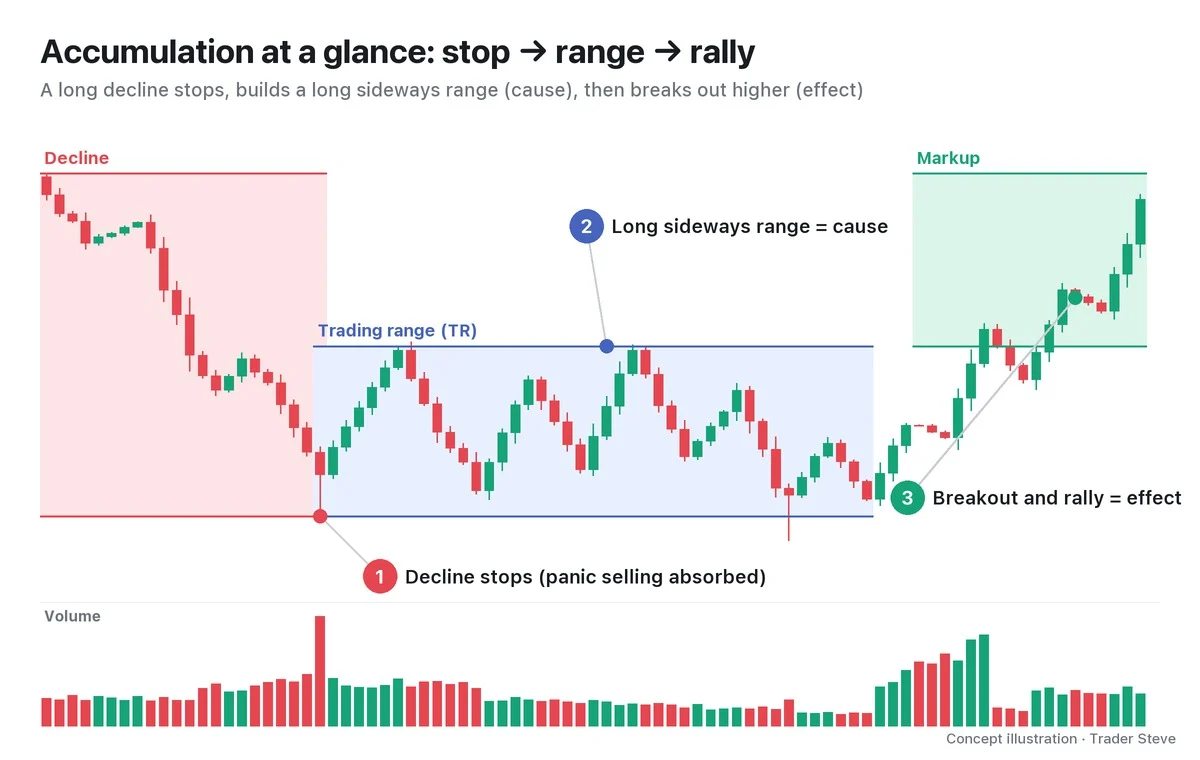
- ① Panic selling: at the end of a decline, volume explodes and price is pushed down one more time. The public sells out of fear.
- ② Range: price then moves up and down in a narrow band (the blue box) while volume gradually shrinks. You can read this as someone quietly absorbing the supply that comes out.
- ③ Rally: with fewer sellers left, price rises easily, and the public buys only after seeing it go up.
2. Why Treat Them as One Person?
In a real market, millions of people buy and sell at the same time. But not all of those orders carry the same weight. The side that sets the main direction is a small group with large capital, and the rest often follow that direction. The Composite Man simplifies that direction-setting side into one person.
On my live streams I don't say "Composite Man"; I say "the big players" or "smart money." They refer to the same thing.
"Of course, I'm not saying there's one specific, single entity — some almighty big player — that can push price up and down at will. My premise is that as price rises and falls, there is what people call smart money, which sets the main direction." — Trader Steve, live stream, Aug 24, 2026 (translated from Korean) · ▶ Watch the stream highlights (Korean audio)
I said the same thing on the Oct 8 live stream: smart money, hedge funds, whatever name you give it, you can't say there is no one creating the price action.
The benefit of bundling them into one person is that the questions get simple. You can't read the psychology of millions of people, but you can ask one person these questions:
- Is this person buying right now, or selling?
- Who benefits from this move?
- What does this person need next?
3. What CM Wants: Buy Low, Sell High
The Composite Man's goal is simple: buy low and sell high. The problem is that his size is enormous. To buy a lot, he needs just as many people willing to sell to him; to sell a lot, he needs just as many people willing to buy from him.
That is why CM always stands on the opposite side from the public. When the public panics and dumps, he collects that supply; when the public piles in, convinced price is going higher, he hands his size over to those buyers.
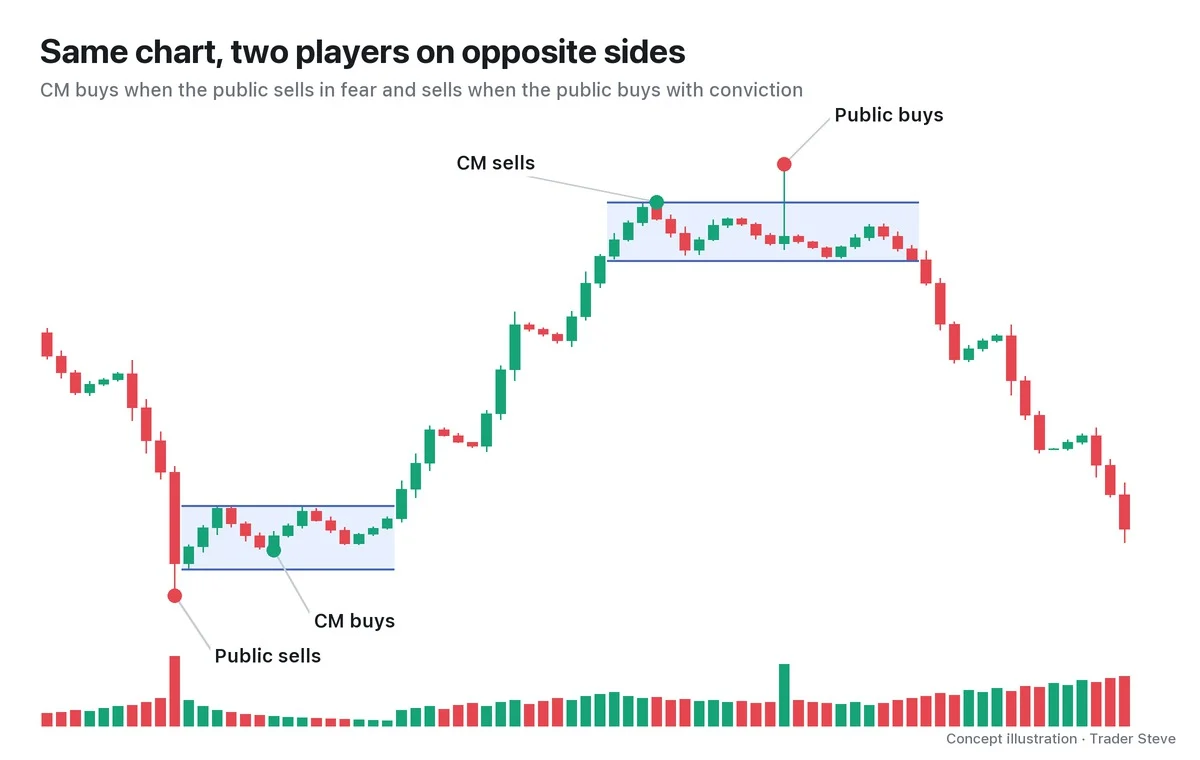
"The public are exactly like racehorses wearing blinkers, running in whatever direction suits the intent of the big players herding them that way. … So the big players set the direction and herd people, and those people simply run that way together." — Trader Steve, live stream, Oct 16, 2026 (translated from Korean) · ▶ Watch the stream highlights (Korean audio)
At the top right of the chart, in the distribution range, there is a candle that pokes above the range and immediately comes back. To the public it looks like a "breakout," but from CM's point of view it is where the most buyers crowd in. These tools for shaking out and luring traders are covered in detail in Part 2.
4. A Preview of One CM Lap: The Four-Stage Campaign
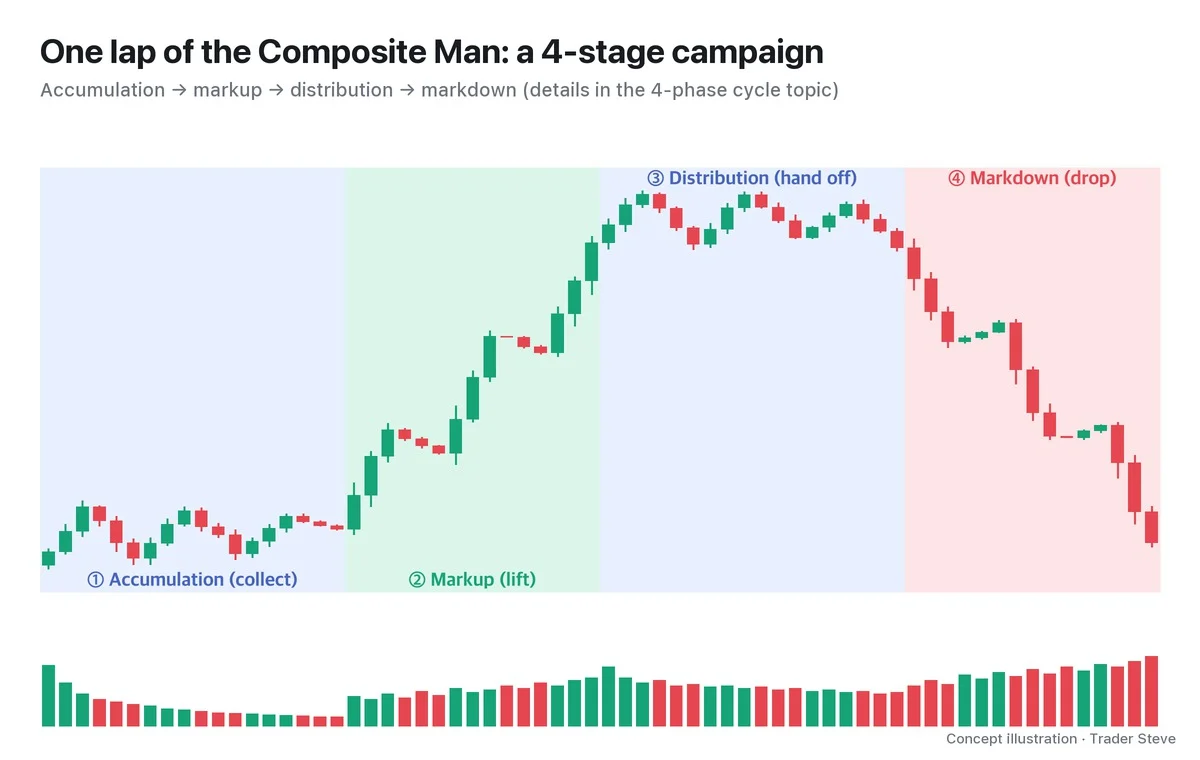
Wyckoff saw one full lap of CM's operation as a campaign and divided it into four stages.
| Stage | Wyckoff term | What CM does | What volume looks like |
|---|---|---|---|
| ① | Accumulation | Collects the supply the public dumps, at low prices | Spikes on the panic selling, then gradually dries up |
| ② | Markup | Lifts price once fewer sellers are left | Rises as price rises |
| ③ | Distribution | Hands his size over to the buyers who follow in | Stays heavy at high prices |
| ④ | Markdown | Price falls after he has handed everything off | Grows again as the decline continues |
This lesson only covers what CM does in each stage. The features of each stage and how to tell them apart are covered in detail in the next topic, Wyckoff Market Cycle (related lesson). Wyckoff's three laws, such as supply and demand, are laid out in Wyckoff Three Laws (related lesson).
5. One Lap on the Real BTC Weekly Chart (A Reading)
Now let's lay this framework over a real Bitcoin (BTC) weekly chart. To be clear up front: the way the chart is divided below is just one reading from the Composite Man's point of view, not an established fact that "the big players actually did this."
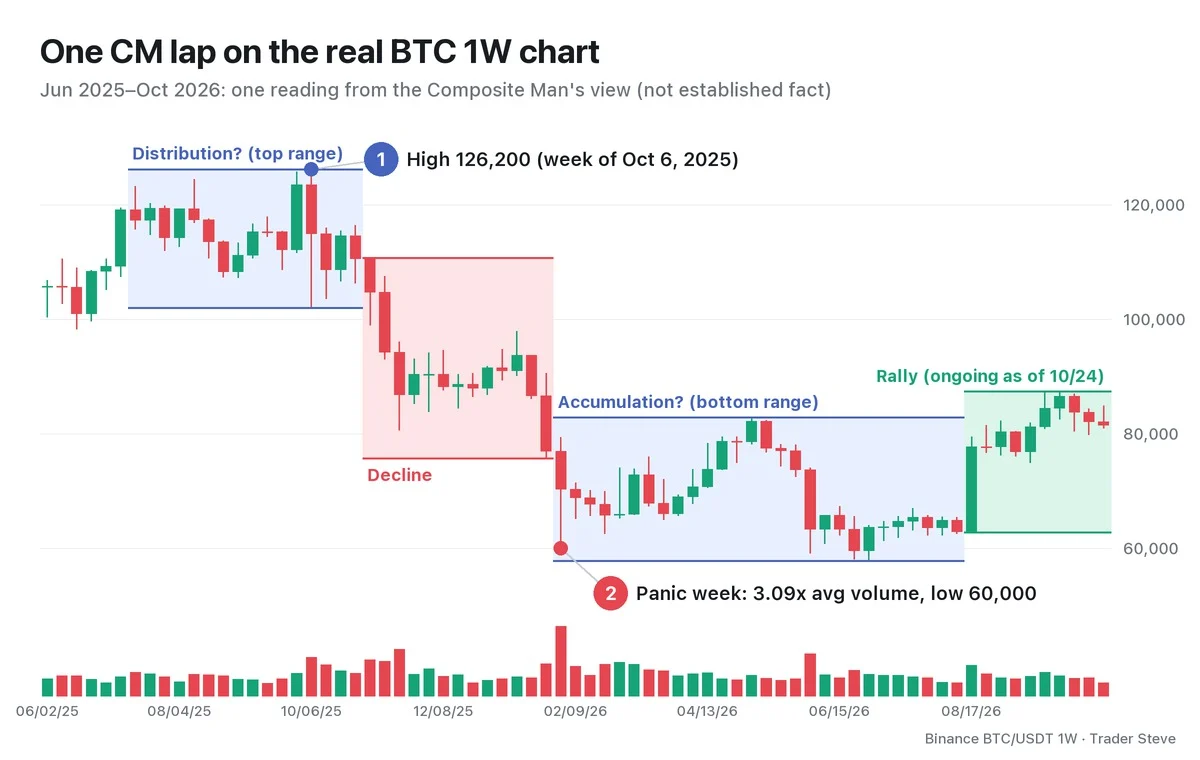
- Top range (a zone you can read as distribution): from Jul to Oct 2025, price moved between 102,000 and 126,200, and it set its high of 126,200 in the week of Oct 6.
- Decline: from the open of the week of Nov 3, 2025 to the close of the week of Jan 26, 2026, price fell 30.4%.
- Panic week: in the week of Feb 2, 2026, price was pushed down to a low of 60,000, and that week's volume was 3.09x the average of the 73 weeks in the chart — the largest of the whole period. You can read it as the spot where the public dumped all at once and someone absorbed that supply.
- Bottom range (a zone you can read as accumulation): price then ranged between 57,800 and 82,850 for about six months, through the second week of Aug. In Jun–Jul it poked below the panic low once more; how to read that kind of move is covered in the case studies in Part 4.
- Rally: from the open of the week of Aug 17, 2026 to the high of the week of Sep 21, price rose 38.9%. As of Oct 24, this leg is still in progress and nothing has been settled.
Seen this way, the chart reads as one story: "someone makes the public dump, absorbs it, lifts price and hands it off." But this story is a name given in hindsight. It is impossible to be certain of CM's intent while a leg is still in progress, which is why Wyckoff also left a way to confirm it through the footprints of price and volume.
Shared reference table: 2025 BTC weekly chart
| Reading · period | Selling/buying climax (SC/BC) · automatic rally/reaction (AR) | Bottom–top · update | Decline confirmed |
|---|---|---|---|
| Large cycle range: weeks of 5/19–11/3 | Uses the whole phase instead of an individual BC and AR | Expanded from 98,200 (6/22) to 126,200 (week of 10/6) | Break below the bottom, week of 11/10 |
| The Composite Man's smaller top range: Jul–Oct | Uses the supply zone instead of an individual BC and AR | Updated from 102,000 (10/10) to 126,200 (week of 10/6) | Read as turning down from the week of 11/3 |
Because the periods and bottoms differ, the week the decline starts is read differently too. The large cycle is the reading in Wyckoff Market Cycle Part 1 (related lesson); the smaller top range is the alternative reading in this lesson.
Key Takeaways
- The Composite Man (CM) is a mental model that bundles the market's big money into one imagined person. He is not a real person or a conspiracy theory.
- Treating them as one person lets you ask: "Is he buying or selling right now, and who benefits?"
- CM buys low and sells high, and because large size only fills when someone is on the other side, he always stands opposite the public.
- One CM lap is accumulation → markup → distribution → markdown.
- The stage names you put on a real chart are always a reading, and they have to be confirmed by price and volume.
In Part 2, we'll cover Wyckoff's four principles of the CM and, stage by stage, the tools CM uses during accumulation and distribution (absorption, shakeouts, luring and tests).
Working out "which stage are we in?" by hand every time takes real time. The Omnisight Report includes the Wyckoff stage for each market as part of its combined analysis.
This lesson adapts the text, figures and live-stream quotes of the Trader Steve TA series for the web, translated from the original Korean. Check the text and figure captions for the timing and interpretation of each real example, and read conceptual diagrams and real charts separately.
Corrections: support@omnisight.report